. 2024 Oct 10:15:1437391.
doi: 10.3389/fimmu.2024.1437391. eCollection 2024.

Pre-vaccination transcriptomic profiles of immune responders to the MUC1 peptide vaccine for colon cancer prevention

Affiliations

Pre-vaccination transcriptomic profiles of immune responders to the MUC1 peptide vaccine for colon cancer prevention

Cheryl M Cameron et al. Front Immunol. .

Abstract

Introduction: Self-antigens abnormally expressed on tumors, such as MUC1, have been targeted by therapeutic cancer vaccines. We recently assessed in two clinical trials in a preventative setting whether immunity induced with a MUC1 peptide vaccine could reduce high colon cancer risk in individuals with a history of premalignant colon adenomas. In both trials, there were immune responders and non-responders to the vaccine.

Methods: Here we used PBMC pre-vaccination and 2 weeks after the first vaccine of responders and non-responders selected from both trials to identify early biomarkers of immune response involved in long-term memory generation and prevention of adenoma recurrence. We performed flow cytometry, phosflow, and differential gene expression analyses on PBMCs collected from MUC1 vaccine responders and non-responders pre-vaccination and two weeks after the first of three vaccine doses.

Results: MUC1 vaccine responders had higher frequencies of CD4 cells pre-vaccination, increased expression of CD40L on CD8 and CD4 T-cells, and a greater increase in ICOS expression on CD8 T-cells. Differential gene expression analysis revealed that iCOSL, PI3K AKT MTOR, and B-cell signaling pathways are activated early in response to the MUC1 vaccine. We identified six specific transcripts involved in elevated antigen presentation, B-cell activation, and NF-κB1 activation that were directly linked to finding antibody response at week 12. Finally, a model using these transcripts was able to predict non-responders with accuracy.

Discussion: These findings suggest that individuals who can be predicted to respond to the MUC1 vaccine, and potentially other vaccines, have greater readiness in all immune compartments to present and respond to antigens. Predictive biomarkers of MUC1 vaccine response may lead to more effective vaccines tailored to individuals with high risk for cancer but with varying immune fitness.

Keywords: MUC1; cancer vaccine; colon cancer; colorectal adenoma; serological response; transcriptomics.


Conflict of interest statement

Author RS reports support from Freenome, Exact Sciences, and Immunovia during the conduct of the study. Author OF reports personal fees from PDS Biotech, Invectys, Immodulon, and Ardigen outside the submitted work. The remaining authors declare that the research was conducted in the absence of any commercial or financial relationships that could be construed as a potential conflict of interest. The author(s) declared that they were an editorial board member of Frontiers, at the time of submission. This had no impact on the peer review process and the final decision.

Figures
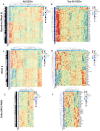
Figure 1
Figure 1
Differential gene expression pre- and post-MUC1 vaccination in responders and non-responders. All differentially expressed genes (DEGs) are shown in two-way hierarchical heatmaps for each time point and contrast in the left column and top 50 DEGs by p-value are shown in the right column. Group status is indicated in the row above the heatmap with responders (R) in dark blue, and non-responders (NR) in light blue. Z-scored normalized gene expression for each gene is displayed horizontally across all samples (diverging color scale legend on the upper right of each heatmap). Log2 fold-change, p-values (all p ≤ 0.05) and adjusted p-values are indicated in labelled vertical columns. Hierarchical clustering of the samples is indicated by the dendrogram at the top of heatmap, while clustering of the genes is indicated at the far left. Heatmaps showing all DEGs pre-vaccination (Baseline/Week 0) (A) top 50 DEGs pre-vaccination (Baseline/Week 0) (B), DEGs at Week 2 post-vaccination (C), top 50 DEGs at Week 2 post-vaccination (D), all genes demonstrating longitudinal changes at Week 2 vs. Week 0 (Delta Wk2-Wk0) (E), top 50 genes demonstrating longitudinal changes at Week 2 vs. Week 0 (Delta Wk2-Wk0) (F) in PBMCs from responders versus non-responders. Available samples from responders and non-responders for analysis were n=13 and 33, respectively, in (A, B), n=24 and 19, respectively, in (C, D), and n=13 and 7, respectively, for the paired analysis in (E, F).
Figure 2
Figure 2
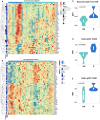
Differentially expressed T-cell fitness signatures in PBMCs from responders and non-responders to MUC1 vaccination is associated with CD4 frequencies and expression of multiple regulators of T-cell help. (A, B) iCOSL signaling pathway-related genes are associated with response to MUC1 vaccination at Baseline (A) and Week 2 post-vaccination (B) in MUC1 vaccine responders and non-responders. Heatmaps are organized as in Figure 1 . Violin plots of CD4+ T-cell frequencies as determined by flow cytometry. (C) Violin plots of CD40L expression on CD4 T-cells (D), CD8 T-cells (E), and the change in ICOS levels on CD8 T-cells (Delta Week 2 vs. Week 0/Baseline) (F) measured by geometric mean fluorescence intensity (MFI). Samples from responders and non-responders were n=13 and 33, respectively, in (A), n=24 and 19, respectively, in (B), and n=13 and 7, respectively, in (C-F).
Figure 3
Figure 3
The mTOR signaling pathway is upregulated in the highest response to MUC1 vaccination. (A) Heatmap showing top differentially enriched pathways from the Hallmark Gene Set (MSigDB) in the PBMCs from high responders (HR, n=9) vs. non-responders (NR, n=33) at Baseline. Group status is indicated in the row above the heatmap as follows: high responders (HR) - pink, while non-responders (NR) - light blue. Z-scored normalized pathway enrichment log 2 fold-change and p values are displayed as in Figure 1 . Unsupervised clustering of the samples is indicated at the top of the heatmap, while clustering of the pathways is displayed on the far left. (B) Violin plots showing the level of S6 ribosomal protein phosphorylation in the indicated cell subsets (CD4, CD8, CD19/B-cells and CD14/monocytes). (C) Violin plots showing the level of AKT1 phosphorylation in the indicated cell subsets (CD4, CD8, CD19/B-cells and CD14/monocytes). For all violin plots, geometric mean fluorescence intensity (MFI) is shown on the y-axis. Responders (R, n=13) and non-responders (NR, n=7) are designated by dark blue and light blue respectively in the violin plots.
Figure 4
Figure 4
B-cell signaling and NFκB signaling signatures are associated with response to MUC1 vaccination. (A, B) Heatmaps showing enrichment of B-Cell Receptor Signaling pathways in the PBMCs from Responders (R) vs. non-responders (NR) at Baseline (A) and high responders (HR, n=9) vs. non-responders (NR) at Baseline (B). (C, D) Differential gene expression from the CD40 Signaling pathway from PBMCs from R vs. NR at Baseline (C) and Week 2 (D). Heat maps are organized as in Figure 1 . (E) Violin plots showing expression levels of CD40 and HLA-DR on B-cells (CD19+). (F) Violin plots of NFκB complex p65 subunit phosphorylation in T-cells (CD3+), non-DC/non-B antigen presenting cells (CD11C-HLADR+), and B-cells (CD19+). For violin plots, geometric mean fluorescence intensity (MFI) is shown on the y-axis. Samples from responders and non-responders were n=13 and 33, respectively, in (A, C), n=24 and 19, respectively, in (D). Responders (R, n=13) and non-responders (NR, n=7) are designated by dark blue and light blue respectively in the violin plots.
Figure 5
Figure 5
Signatures of enhanced antigen presentation are evident in participants with an enhanced response to MUC1 vaccination. Heatmaps showing enrichment of dendritic cell (DC) specific genes in the PBMCs from Responders (R) vs. non-responders (NR) at Baseline (A) and Week 2 post-vaccination (B). Heatmaps are organized as in Figure 1 . Violin plots of HLA-DR expression on DCs at Baseline (Week 0) (C), as well relative change in expression of CD86 (D) and CD40 (E) in these cells. For all violin plots, geometric mean fluorescence intensity (MFI) is shown on the y-axis. Samples from responders and non-responders were n=13 and 33, respectively, in (A), n=24 and 19, respectively, in (B). Week 2 vs. baseline paired responders (R, n=13) and non-responders (NR, n=7) are designated by dark blue and light blue respectively in the violin plots.
Figure 6
Figure 6
Graphical models of response from transcriptomic data measured two-weeks post-vaccination. (A) Receiver Operating Characteristic curve of response (≥2-fold increase in IgG) using week 2 transcriptome signature. (B) Correlation of predicted response odds with the magnitude of antibody titer at week 12 (C) Full model showing all neighbors and second neighbors of week 12 antibody titer levels (Week 12 IgG), (D) reduced model showing only direct causes of week 12 antibody titer. Color of edge denotes a positive vs negative correlation, and size denotes edge stability.

Update of

References

    1. Zitvogel L, Perreault C, Finn OJ, Kroemer G. Beneficial autoimmunity improves cancer prognosis. Nat Rev Clin Oncol. (2021) 18:591–602. doi: 10.1038/s41571-021-00508-x - DOI - PubMed
    1. Jacqueline C, Finn OJ. Antibodies specific for disease-associated antigens (DAA) expressed in non-malignant diseases reveal potential new tumor-associated antigens (TAA) for immunotherapy or immunoprevention. Semin Immunol. (2020) 47:101394. doi: 10.1016/j.smim.2020.101394 - DOI - PMC - PubMed
    1. Finn OJ, Rammensee HG. Is it possible to develop cancer vaccines to neoantigens, what are the major challenges, and how can these be overcome? Neoantigens: nothing new in spite of the name. Cold Spring Harb Perspect Biol. (2018) 10. doi: 10.1101/cshperspect.a028829 - DOI - PMC - PubMed
    1. Gnjatic S, Bronte V, Brunet LR, Butler MO, Disis ML, Galon J, et al. . Identifying baseline immune-related biomarkers to predict clinical outcome of immunotherapy. J Immunother Cancer. (2017) 5:44. doi: 10.1186/s40425-017-0243-4 - DOI - PMC - PubMed
    1. Liu J, Fu M, Wang M, Wan D, Wei Y, Wei X. Cancer vaccines as promising immuno-therapeutics: platforms and current progress. J Hematol Oncol. (2022) 15:28. doi: 10.1186/s13045-022-01247-x - DOI - PMC - PubMed