. 2024 Oct 10:15:1455454.
doi: 10.3389/fimmu.2024.1455454. eCollection 2024.

Exploring the naturally acquired response to Pvs47 gametocyte antigen

Affiliations

Exploring the naturally acquired response to Pvs47 gametocyte antigen

Gisele Tatiane Soares da Veiga et al. Front Immunol. .

Abstract

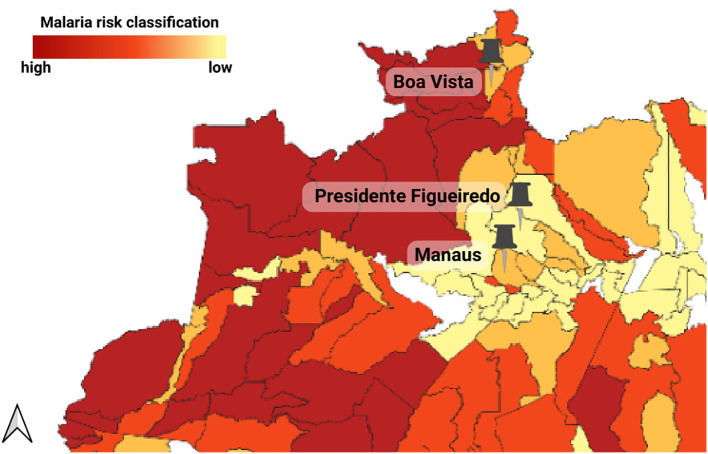
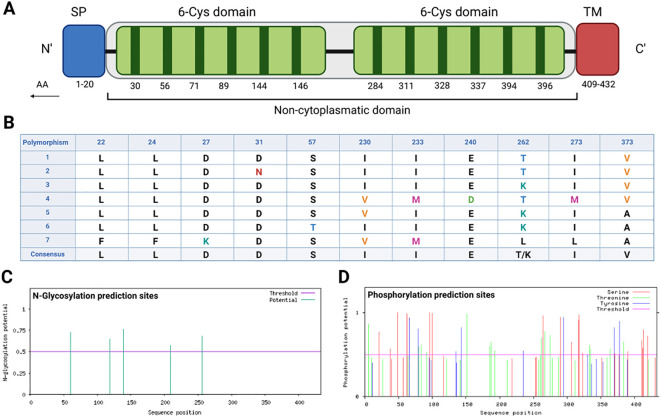
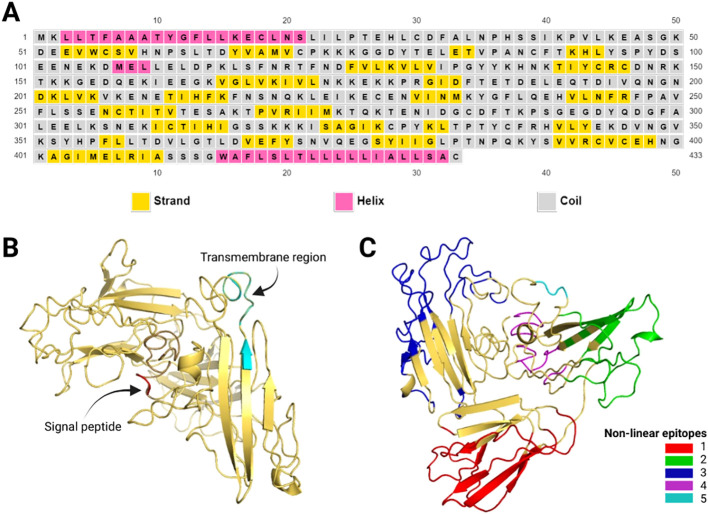
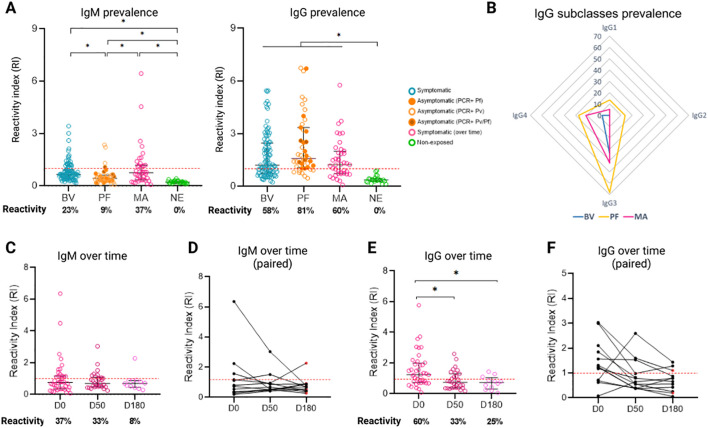
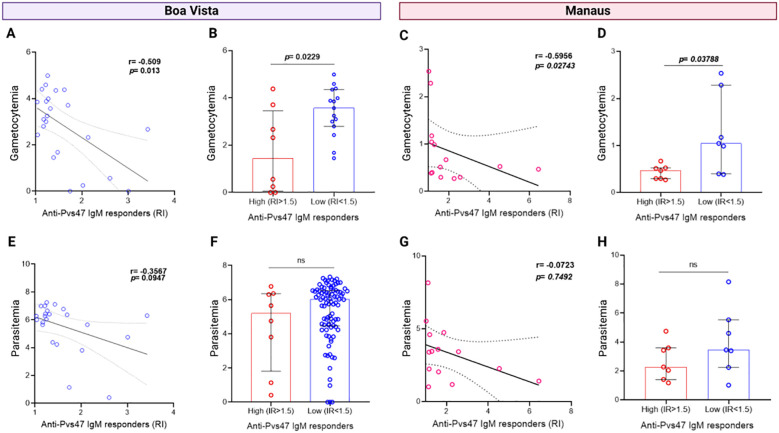
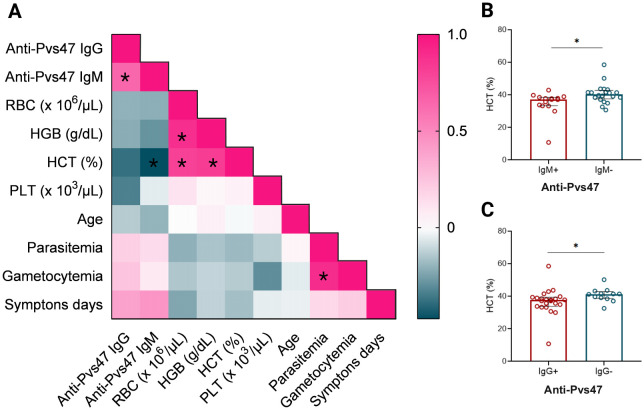
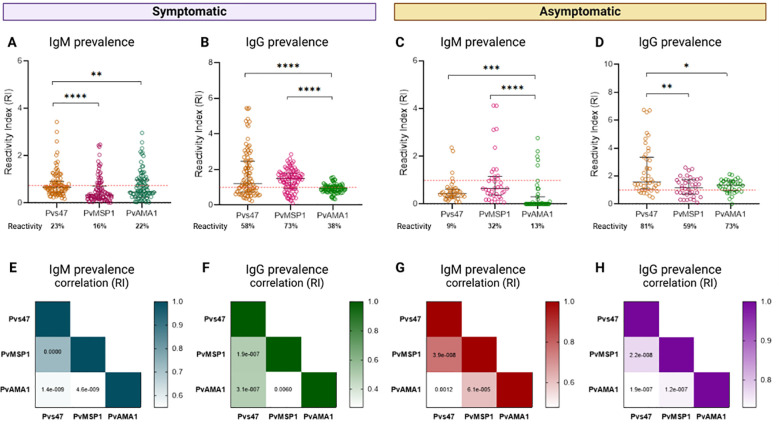
Malaria represents a challenging global public health task, with Plasmodium vivax being the predominant parasite in Brazil and the most widely distributed species throughout the world. Developing a vaccine against P. vivax malaria demands innovative strategies, and targeting gametocyte antigens shows promise for blocking transmission prevention. Among these antigens, Pvs47, expressed in gametocytes, has shown remarkable efficacy in transmission blocking. However, remains underexplored in vaccine formulations. This study employed in silico methods to comprehensively characterize the physicochemical properties, structural attributes, epitope presence, and conservation profile of Pvs47. Additionally, we assessed its antigenicity in individuals exposed to malaria in endemic Brazilian regions. Recombinant protein expression occurred in a eukaryotic system, and antigenicity was evaluated using immunoenzymatic assays. The responses of naturally acquired IgM, total IgG, and IgG subclasses were analyzed in three groups of samples from Amazon region. Notably, all samples exhibited anti-Pvs47 IgM and IgG antibodies, with IgG3 predominating. Asymptomatic patients demonstrated stronger IgG responses and more diverse subclass responses. Anti-Pvs47 IgM and IgG responses in symptomatic individuals decrease over time. Furthermore, we observed a negative correlation between anti-Pvs47 IgM response and gametocytemia in samples of symptomatic patients, indicating a gametocyte-specific response. Additionally, negative correlation was observed among anti-Pvs47 antibody response and hematocrit levels. Furthermore, comparative analysis with widely characterized blood antigens, PvAMA1 and PvMSP119, revealed that Pvs47 was equally or more recognized than both proteins. In addition, there is positive correlation between P. vivax blood asexual and sexual stage immune responses. In summary, our study unveils a significant prevalence of anti-Pvs47 antibodies in diverse Amazonian samples and the importance of IgM response for gametocytes depuration. These findings regarding the in silico characterization and antigenicity of Pvs47 provide crucial insights for potential integration into P. vivax vaccine formulations.

Keywords: Plasmodium vivax; Pvs47; antigenicity; gametocyte; malaria; transmission blocking vaccine.


Conflict of interest statement

The authors declare that the research was conducted in the absence of any commercial or financial relationships that could be construed as a potential conflict of interest.

Figures

Figure 1
Figure 1
Geographical distribution of the three studied groups: symptomatic individuals from Boa Vista (Roraima), symptomatic individuals from Manaus (Amazonas), and asymptomatic individuals from Presidente Figueiredo (Amazonas). The range color indicates malaria risk levels based on the Incidence Parasite Index (IPA). The municipalities studied are classified as very low risk (IPA <1 case/1,000 inhabitants) and low risk (IPA between 1 and <10 cases/1,000 inhabitants). Adapted from Sivep-Malaria (2).
Figure 2
Figure 2
Pvs47 amino acid sequence analysis. (A) Predicted domains along the Pvs47 sequence. The protein contains a signal peptide (SP), two 6-cysteine domains (6-Cys domain), and a transmembrane region (TM). The residue numbers are annotated below the domain blocks in the figure. (B) Polymorphisms observed among 46 Pvs47 sequences. Sequences deposited in GenBank were analyzed, with seven chosen to represent the diversity. Eleven polymorphisms were identified, and the mutations with corresponding amino acid positions are illustrated in the figure. (C) The N-glycosylation sites predicted along the Pvs47 sequence. The results were generated by the NetNglyc server. (D) The phosphorylation sites predicted along the Pvs47 sequence. The results were generated by the NetPhos server.
Figure 3
Figure 3
Pvs47 predicted structure. (A) Secondary structure of the proposed antigen according to the PSIPRED tool. The helical structures are represented in pink, the strands in yellow, and the coils in gray. (B) Pvs47 tridimensional structure after modeling, refinement, and validation. The signal peptide is represented in red and the transmembrane region in cyan. (C) Structural position of the 5 non-linear B-cell epitopes described in the Supplementary Table S5 . Each of the colors represents a different epitope.
Figure 4
Figure 4
Prevalence of anti-Pvs47 antibodies in three different samples from the Brazilian Amazon. (A) Reactivity index (RI) for IgM and IgG among symptomatic individuals from Boa Vista (BV), asymptomatic individuals from Presidente Figueiredo (PF), Manaus (MA), and nonexposed (NE) individuals. Reactivity is represented as a percentage below the chart. (B) Radar charts representing the reactivity of the IgG1, IgG2, IgG3, and IgG4 subclasses in Boa Vista (blue), Manaus (pink) and Presidente Figueiredo (yellow). (C) IgM reactivity index and positivity percentage at D0, D50, and D180 in symptomatic individuals from Manaus. (D) The IgM reactivity index demonstrating the trend of reduction for each individual from Manaus. (E) IgG reactivity index and positivity percentage for D0, D50, and D180 from Manaus. (F) The IgG reactivity index demonstrating the trend of reduction for each individual from Manaus. The red points (D, F) at D50 (1/12) and D180 (6/12) indicate patients who tested positive for malaria again at the time of collection. The RI was calculated from the OD of individual samples divided by the cutoff, with samples with an RI > 1 (indicated by the red dotted line) considered positive. Each circle represents the response of an individual. The data from independent experiments are presented as median with interquartile range. p values were determined using the Kruskal−Wallis test, followed by Dunnett’s multiple comparison test (* p < 0.05).
Figure 5
Figure 5
Relationship between anti-Pvs47 IgM antibody response and gametocytemia or parasitaemia levels. (A) Correlation between the reactivity index (RI) of the anti-Pvs47 IgM response and the levels of gametocytemia in samples from Boa Vista. (B) Comparison of gametocytemia levels between groups of high (RI>1.5) and low response (RI<1.5) to anti-Pvs47 IgM in samples from Boa Vista. (C) Correlation between the reactivity index (RI) of the anti-Pvs47 IgM response and the levels of gametocytemia in samples from Manaus at D0. (D) Comparison of gametocytemia levels between groups of high (RI>1.5) and low response (RI<1.5) to anti-Pvs47 IgM in samples from Manaus at D0. (E) Correlation between the reactivity index (RI) of the anti-Pvs47 IgM response and the levels of parasitaemia in samples from Boa Vista. (F) Comparison of parasitaemia levels between groups of high (RI>1.5) and low response (RI<1.5) to anti-Pvs47 IgM in samples from Boa Vista. (G) Correlation between the reactivity index (RI) of the anti-Pvs47 IgM response and the levels of parasitaemia in samples from Manaus at D0. (H) Comparison of parasitaemia levels between groups of high (RI>1.5) and low response (RI<1.5) to anti-Pvs47 IgM in samples from Manaus at D0. Circles indicate the response of each individual. Data from independent experiments are shown as median with interquartile range. The difference between the groups was evaluated by the Mann−Whitney test, and the correlation by the Spearman test was considered significant when p<0.05. In the correlation analyses, the linear regression line of the data with a 95% confidence interval is represented.
Figure 6
Figure 6
Relationship between hematological parameters and anti-Pvs47 response at Manaus population D0. (A) The heatmap represents the correlation between IgM, IgG responses, quantity of erythrocytes (RBC), hemoglobin (HGB), hematocrit percentage (HCT), platelets (PLT), age, parasitemia, gametocytemia and days of symptoms determined by the Spearman test. The color scale indicates the correlation index r; shades of pink represent the most positive correlations (r>0), and shades of turquoise represent the most negative correlations (r<0). (B) Comparison between hematocrit levels in anti-Pvs47 IgM reactive (IgM+) and non-reactive individuals (IgM-). (C) Comparison between hematocrit levels in anti-Pvs47 IgG reactive (IgG+) and non-reactive individuals (IgG-). Circles indicate the response of each individual. Data from independent experiments are shown as median with interquartile range. The difference between groups was assessed using the Mann−Whitney test, and correlations were evaluated using Spearman’s test. The correlation’s p-value was adjusted using the Holm-Sidak method and deemed significant when p<0.05*.
Figure 7
Figure 7
Relationship between the prevalence of anti-Pvs47 antibodies and the response to blood-stage antigens. (A) Reactivity index for IgM against Pvs47, PvAMA-1, and PvMSP1 in symptomatic patients from Boa Vista. (B) Reactivity index for IgG against Pvs47, PvAMA-1, and PvMSP1 in symptomatic patients from Boa Vista. (C) Reactivity index for IgM against Pvs47, PvAMA-1, and PvMSP1 in asymptomatic patients from Presidente Figueiredo. (D) Reactivity index for IgG against Pvs47, PvAMA-1, and PvMSP1 in asymptomatic patients from Presidente Figueiredo. (E) Correlation of the IgM response across the three antigens in the sample of Boa Vista. (F) Correlation of the IgG response across the three antigens in the Boa Vista sample. (G) Correlation of the IgM response across the three antigens in the Presidente Figueiredo sample. (H) Correlation of the IgG response across the three antigens in the Presidente Figueiredo sample. The RI was calculated from the OD of the individual samples divided by the cutoff. Samples with an RI>1 (indicated by the red dotted line) were considered positive. The circle symbols indicate the response of each individual. The data from independent experiments are shown as median with interquartile range. The color scale in the heatmap indicates the correlation index r of the RI of each antigen response; the darkest color represents the most positive correlation, and the lightest color represents the most negative correlation. A significance level of *p<0.05 was established, and significant p values are depicted in the heatmap. * p < 0,05; ** p < 0,01; ***p < 0,001; ****p < 0,0001.

Similar articles

References

    1. WHO . World malaria report 2022. Geneva: World Health Organization; (2022) p. 0–293. Available at: https://www.who.int/teams/global-malaria-programme.
    1. Brasil . Ministério da Saúde. Secretaria de Vigilância em Saúde. Boletim Epidemiológico. (2024) 55(1):1–15. www.saude.gov.br/svs.
    1. Baird JK. Neglect of Plasmodium vivax malaria. Trends Parasitol. (2007) 23:533–9. doi: 10.1016/j.pt.2007.08.011 - DOI - PubMed
    1. Walker IS, Rogerson SJ. Pathogenicity and virulence of malaria: Sticky problems and tricky solutions. Virulence. (2023) 14:1–34. doi: 10.1080/21505594.2022.2150456 - DOI - PMC - PubMed
    1. Totino PR, Lopes SC. Insights into the Cytoadherence Phenomenon of Plasmodium vivax: The Putative Role of Phosphatidylserine. Front Immunol. (2017) 8:1148. doi: 10.3389/fimmu.2017.01148 - DOI - PMC - PubMed

LinkOut - more resources