. 2024 Dec;65(6):113.
doi: 10.3892/ijo.2024.5701. Epub 2024 Oct 25.

SHARPIN is a novel gene of colorectal cancer that promotes tumor growth potentially via inhibition of p53 expression

Affiliations

SHARPIN is a novel gene of colorectal cancer that promotes tumor growth potentially via inhibition of p53 expression

Yusuke Nakano et al. Int J Oncol. 2024 Dec.

Abstract

Colorectal cancer (CRC) is widely prevalent and represents a significant contributor to global cancer‑related mortality. There remains a pressing demand for advancements in CRC treatment modalities. The E3 ubiquitin ligase is a critical enzyme involved in modulating protein expression levels via posttranslational ubiquitin‑mediated proteolysis, and it is reportedly involved in the progression of various cancers, making it a target of recent interest in anticancer therapy. In the present study, using comprehensive expression analysis involving spatial transcriptomic analysis with single‑cell RNA sequencing in clinical CRC datasets, the ubiquitin‑associated protein Shank‑associated RH domain interactor (SHARPIN) was identified, located on amplified chromosome 8q, which could promote CRC progression. SHARPIN was found to be upregulated in tumor cells, with elevated expression observed in tumor tissues. This heightened expression of SHARPIN was positively associated with lymphatic invasion and served as an independent predictor of a poor prognosis in patients with CRC. In vitro and in vivo analyses using SHARPIN‑overexpressing or ‑knockout CRC cells revealed that SHARPIN overexpression upregulated MDM2, resulting in the downregulation of p53, while SHARPIN silencing or knockout downregulated MDM2, leading to p53 upregulation, which affects cell cycle progression, tumor cell apoptosis and tumor growth in CRC. Furthermore, SHARPIN was found to be overexpressed in several cancer types, exerting significant effects on survival outcomes. In conclusion, SHARPIN represents a newly identified novel gene with the potential to promote tumor growth following apoptosis inhibition and cell cycle progression in part by inhibiting p53 expression via MDM2 upregulation; therefore, SHARPIN represents a potential therapeutic target for CRC.

Keywords: colorectal cancer; novel gene; p53; shank‑associated RH domain interactor; ubiquitin‑proteasome system.


Conflict of interest statement

The authors declare that they have no competing interests.

Figures
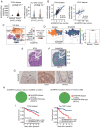
Figure 1
Figure 1
SHARPIN is a potential novel gene. (A) SHARPIN mRNA expression in CRC and normal colon tissues in TCGA and our CRC datasets. The dashed lines in the figure show the median of each group. (B) The correlation between DNA copy number and mRNA expression of SHARPIN in TCGA and CCLE datasets. R is the Pearson correlation coefficient. (C) SHARPIN expression in CRC tissues using public CRC single-cell RNA sequencing data. UMAP plot of the cell types in all cells (left). Dot plot of the expression proportions of SHARPIN per cell type (right). (D) UMAP plot of cell types after annotation of epithelial cells (left) and expression of SHARPIN in UMAP representation (middle). Violin plot of SHARPIN mRNA expression in normal vs. tumor tissues (right). (E) Pathological diagnosis distribution of a spatial transcriptomics slide. N, normal tissue; T, tumor tissue. (F) Spatial distribution of SHARPIN expression in epithelial cells in tissue sections analyzed using the deconvolution tool 'DeepCOLOR'. (G) Immunohistochemical staining of SHARPIN in CRC and normal tissues. N, normal tissue; T, tumor tissue. Scale bars, 200 µm (left) and 50 µm (middle and right). (H) Pie chart of SHARPIN mutation distribution in CRC cases of the COSMIC database (n=2,561) and TCGA (n=380). (I) Kaplan-Meier curves for the overall survival of patients with CRC according to SHARPIN mRNA expression in TCGA (n=372) and our CRC (n=111) datasets. The data are presented as the mean ± standard deviation. ***P<0.005. SHARPIN, shank-associated RH domain interactor; TCGA, The Cancer Genome Atlas; CRC, colorectal cancer; CCLE, Cancer Cell Line Encyclopedia; UMAP, Uniform Manifold Approximation and Projection; COSMIC, Catalogue of Somatic Mutations in Cancer.
Figure 2
Figure 2
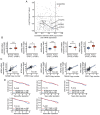
SHARPIN is a potential therapeutic target in CRC. (A) Statistical evaluation of 360 E3 ubiquitin ligase-related genes. Each gene is depicted as a dot on the graph, with its vertical position indicating the corrected P-value from the log-rank test (represented as-log10) and its horizontal position indicating the Pearson correlation coefficient between copy number and mRNA expression. The red dots represent SHARPIN and the blue dots MDM2, BTRC, SKP2, TRAF6 and PRC1. (B) mRNA expression of MDM2, BTRC, SKP2, TRAF6 and PRC1 in CRC and normal colon tissues in the TCGA dataset. (C) The correlation between the DNA copy number and mRNA expression of MDM2, BTRC, SKP2, TRAF6 and PRC1 in the TCGA dataset. (D) Kaplan-Meier curves for the OS of patients with CRC according to mRNA expression of MDM2, BTRC, SKP2, TRAF6 and PRC1 in the TCGA dataset (n=372). The data are presented as the mean ± standard deviation. *P<0.05 and ***P<0.005. SHARPIN, shank-associated RH domain interactor; CRC, colorectal cancer; TCGA, The Cancer Genome Atlas; OS, overall survival.
Figure 3
Figure 3
RNA sequencing of SHARPIN-knockout and non-target cells and enrichment pathway analysis of single-cell CRC data. (A) Volcano plot of the genes differentially expressed between non-target (NT) and SHARPIN-knockout (KO) LoVo cells. Upregulated genes are represented as red dots and downregulated genes as blue dots. (B) Heat map of mRNA expression changes between non-target and SHARPIN-knockout cells. (C) GSEA analysis of upregulated genes in SHARPIN knockout cells and GSEA plots of selected hallmark gene sets. (D) Tumor epithelial cells were extracted from scRNA-seq CRC data and divided into two groups by median expression of SHARPIN, with UMAP distribution showing carcinoma epithelial cells with high vs. low SHARPIN expression (left). Violin plots of cancer epithelial cells with high vs. low SHARPIN expression (right). (E) Hallmark pathway analysis of carcinoma epithelial cells with high vs. low SHARPIN expression. SHARPIN, shank-associated RH domain interactor; CRC, colorectal cancer; GSEA, Gene set enrichment analysis; FDR, false discovery rate; NES, normalized enrichment score; UMAP, Uniform Manifold Approximation and Projection.
Figure 4
Figure 4
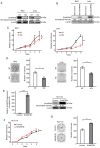
SHARPIN is associated with the growth of CRC in vitro. (A) Western blot analysis of SHARPIN in SHARPIN-KO and NT cells. (B) SHARPIN protein levels in the indicated cells. SHARPIN protein expression using western blot analysis in these rescued cells. (C) MTT assays in SHARPIN-knockout RKO and LoVo cells. (D) Colony formation assays in SHARPIN-knockout RKO and LoVo cells. (E) SHARPIN mRNA expression using reverse transcription-quantitative PCR and SHARPIN protein expression using western blot analysis in SHARPIN-overexpressing and control cells. (F) MTT assay in SHARPIN-overexpressing cells. (G) Colony formation assay in SHARPIN-overexpressing cells. The data are presented as the mean ± standard deviation. *P<0.05 and ***P<0.005. SHARPIN, shank-associated RH domain interactor; CRC, colorectal cancer; NT, non-target; KO, knockout.
Figure 5
Figure 5
SHARPIN is associated with the growth of CRC in vivo. (A) In vivo analysis using a tumor xenograft model. Tumor size in xenograft models generated using NT or SHARPIN-KO CRC cells (n=7 per group). (B) Immunohistochemical staining of SHARPIN and p53 in tumor tissues from NT and KO CRC cells (left). Scale bars, 20 µm. The bar graphs represent the percentage of p53-positive cells in tumor tissues from KO (n=3) and NT (n=3) tumor tissues (right). (C) In vivo analysis using a tumor xenograft model. Tumor size in xenograft models generated using control cells and SHARPIN-overexpressing CRC cells (n=5) per group. (D) Immunohistochemical staining of SHARPIN and p53 in tumor tissues from control and SHARPIN-overexpressing CRC cells (left). Scale bars, 20 µm. The bar graphs represent the percentage of p53-positive cells in tumor tissues from SHARPIN-overexpressing (n=5) and control (n=5) tumor tissues (right). The data are presented as the mean ± standard deviation. *P<0.05, **P<0.01 and ***P<0.005. SHARPIN, shank-associated RH domain interactor; CRC, colorectal cancer; NT, non-target; KO, knockout.
Figure 6
Figure 6
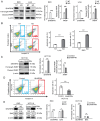
SHARPIN induces apoptosis in CRC cells. (A) Western blot analysis of SHARPIN, full-length PARP and cleaved PARP in SHARPIN-KO and NT cells. β-actin was used as the loading control. The right panel quantitatively displays the proteins from the left panel. (B) Left, Apoptosis assay of SHARPIN-KO LoVo (upper) and RKO (lower) cell lines. Right, Quantification of cell distribution in the apoptosis assay (Annexin V-FITC+). (C) Western blot analysis of SHARPIN, full-length PARP and cleaved PARP in SHARPIN-overexpressing and control cells. β-actin was used as the loading control. The right panel quantitatively displays the proteins from the left panel. (D) Left, apoptosis assay of SHARPIN-overexpressing HCT116 cells. Right, quantification of cell distribution in the apoptosis assay. (E) Western blot analysis of SHARPIN and BAX in SHARPIN-KO, SHARPIN-overexpressing, and control cells. β-actin was used as the loading control. The right panel quantitatively displays the proteins from the left panel. The data are presented as the mean ± standard deviation. Statistical significance between groups was assessed using a two-tailed unpaired Student's t-test. *P<0.05, **P<0.01 and ***P<0.005. SHARPIN, shank-associated RH domain interactor; CRC, colorectal cancer; PARP, Poly (ADP-ribose) polymerase; NT, non-target; KO, knockout; BAX, Bcl-2-associated X protein.
Figure 7
Figure 7
SHARPIN knockout prevents cell cycle progression via MDM2-dependent regulation of p53 expression in CRC cells. (A) Cell cycle assay of RKO control cells and SHARPIN-KO RKO cells. Propidium iodide staining was performed after refeeding of fetal bovine serum for the indicated time periods (upper). Bar graphs represent the percentage of cell distribution in G1 and S-phase (lower). (B) Western blot analysis of SHARPIN and p21 in control and SHARPIN-KO cells. β-actin was used as the loading control. (C) Western blot analysis of SHARPIN, MDM2 and p53 in SHARPIN-KO, SHARPIN-overexpressing and control cells. β-actin was used as the loading control. The lower panel quantitatively displays the proteins from the upper panel. Data are presented as the mean ± standard deviation. Statistical significance between groups was assessed using a two-tailed unpaired Student's t-test. *P<0.05, **P<0.01 and ***P<0.005. SHARPIN, shank-associated RH domain interactor; CRC, colorectal cancer; KO, knockout; NT, non-target.
Figure 8
Figure 8
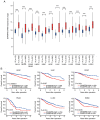
Pan-cancer analysis of SHARPIN. (A) mRNA expression of SHARPIN in various cancers. (B) Kaplan-Meier overall survival curves based on data from the indicated The Cancer Genome Atlas datasets. Data are presented as the mean ± standard deviation. ***P<0.005. SHARPIN, shank-associated RH domain interactor; BLCA, bladder urothelial carcinoma; BRCA, breast invasive carcinoma; CESC, cervical squamous cell carcinoma; COADREAD, colon adenocarcinoma and rectal adenocarcinoma; HNSC, head and neck squamous cell carcinoma; KIRC, kidney renal clear cell carcinoma; KIRP, kidney renal papillary cell carcinoma; LIHC, liver hepatocellular carcinoma; LUAD, lung adenocarcinoma; LUSC, lung squamous cell carcinoma; PAAD, pancreatic adenocarcinoma; PRAD, prostate adenocarcinoma; THCA, thyroid carcinoma; UCEC, uterine corpus endometrial carcinoma.

References

    1. Varshavsky A. The ubiquitin system, an immense realm. Annu Rev Biochem. 2012;81:167–176. doi: 10.1146/annurev-biochem-051910-094049. - DOI - PubMed
    1. Dikic I. Proteasomal and autophagic degradation systems. Annu Rev Biochem. 2017;86:193–224. doi: 10.1146/annurev-biochem-061516-044908. - DOI - PubMed
    1. Welchman RL, Gordon C, Mayer RJ. Ubiquitin and ubiquitin-like proteins as multifunctional signals. Nat Rev Mol Cell Biol. 2005;6:599–609. doi: 10.1038/nrm1700. - DOI - PubMed
    1. Scheffner M, Nuber U, Huibregtse JM. Protein ubiquitination involving an E1-E2-E3 enzyme ubiquitin thioester cascade. Nature. 1995;373:81–83. doi: 10.1038/373081a0. - DOI - PubMed
    1. Bence NF, Sampat RM, Kopito RR. Impairment of the ubiquitin-proteasome system by protein aggregation. Science. 2001;292:1552–1555. doi: 10.1126/science.292.5521.1552. - DOI - PubMed

MeSH terms