. 2024 Dec;20(12):8231-8245.
doi: 10.1002/alz.14125. Epub 2024 Oct 25.

Synaptic and extrasynaptic distribution of NMDA receptors in the cortex of Alzheimer's disease patients

Affiliations

Synaptic and extrasynaptic distribution of NMDA receptors in the cortex of Alzheimer's disease patients

Sergio Escamilla et al. Alzheimers Dement. 2024 Dec.

Abstract

Background: Synaptic and extrasynaptic distribution of N-methyl-D-aspartate receptors (NMDARs) has not been addressed in the brain from Alzheimer´s disease (AD) subjects, despite their contribution to neurodegeneration.

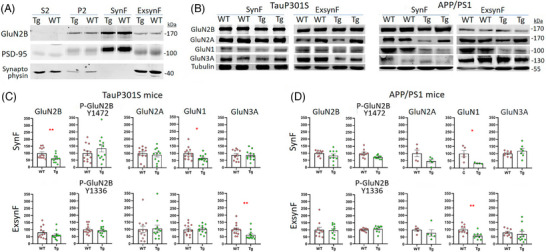
Methods: We have developed a protocol to isolate synaptic and extrasynaptic membranes from controls and AD frontal cortex. We characterized the distribution of the NMDAR subunits GluN2B, GluN2A, GluN1, and GluN3A, as well as post-translational modifications, such as phosphorylation and glycosylation.

Results: Lower levels of synaptic GluN2B and GluN2A were found in AD fractions, while extrasynaptic GluN2B and GluN1 levels were significantly higher; GluN3A distribution remained unaffected in AD. We also identified different glycoforms of GluN2B and GluN2A in extrasynaptic membranes. Synaptic Tyr1472 GluN2B phosphorylation was significantly lower in AD fractions.

Discussion: Reduction of synaptic NMDAR subunits, particularly for GluN2B, is likely to contribute to synaptic transmission failure in AD. Additionally, the increment of extrasynaptic NMDAR subunits could favor the activation of excitotoxicity in AD.

Highlights: New protocol to isolate synaptic and extrasynaptic membranes from the human cortex. Low GluN2B and GluN2A levels in Alzheimer´s disease (AD) synaptic membranes. High GluN2B and GluN1 levels in AD extrasynaptic membranes. Specific glycoforms of extrasynaptic GluN2B and GluN2A. Low phosphorylation at Tyr1472 in synaptic GluN2B in AD.

Keywords: Alzheimer´s disease; GluN1; GluN2A; GluN2B; GluN3A; NMDA; Tyr1336; Tyr1472; extrasynaptic; human.


Conflict of interest statement

The authors declare no conflicts of interest. Author disclosures are available in the Supporting information.

Figures

FIGURE 1
FIGURE 1
Validation of the fractionation protocol in human post mortem cortex. (A) Scheme of the fractionation procedure indicating the centrifugation steps and the fractions resulting from each one. P: pellet. S: supernatant. In brief, cortical homogenates (Ho) were centrifuged a 1000×g to obtain a nuclear‐free supernatant (S1) and a pellet (P1) containing the nucleus. Centrifugation at 10,000×g of S1 resolved a supernatant that contained cell cytosol and microsomes (S2) and a pellet (P2) of plasma membranes. P2 was incubated with 1% (w/v) Triton X‐100 and centrifuged at 32,000×g to obtain a supernatant fraction collected contained extrasynaptic membranes (ExsynF); the pellet fraction was solubilized in RIPA buffer to obtain the post‐synaptic membranes (synaptic fraction, SynF). Ultracentrifugation at 100,000×g of S2 fraction served to obtain microsomal (P3) and cytosolic fractions (S3). (B). Western blot of different fractions from the fractionation protocol revealed with antibodies against synaptic‐related proteins (PSD‐95, synaptophysin), astroglial cells (glial fibrillary acidic protein [GFAP]) and no synaptic proteins associated to early endosome‐associated protein (EEA1) and to Golgi apparatus (TGN46), in control and AD samples. (C) Representative Western blot of the N‐methyl‐D‐aspartate receptor (NMDAR) subunit GluN2B, revealed with an antibody against the C‐terminal of GluN2B, of a synaptic fraction from a control sample and the quantification of the HUSPIR index for all samples (controls n = 16, Braak I–II n = 8, Braak III–IV n = 9 and Braak V–VI n = 8).
FIGURE 2
FIGURE 2
Characterization of N‐methyl‐D‐aspartate receptor (NMDAR) subunits in SynF and ExsynF. (A) Representative blots of the NMDAR subunits GluN2B, GluN2A, GluN1, and GluN3A from different fractions of the fractionation protocol (50 μg for S2 and extrasynaptic membranes [ExsynF]; 10 μg for P2 and synaptic fraction [SynF]). Black arrowheads indicate bands corresponding to ∼170 kDa GluN2B, ∼170 kDa GluN2A, ∼120 kDa GluN1 and ∼130 kDa GluN3A in each blot. White arrowheads indicate ∼160 kDa bands of GluN2B and GluN2A. (B) Immunoprecipitations (IP) of SynF and ExsynF of control samples. IP of GluN2B (antibody GluN2B N‐terminal, rabbit, 10 μL, Alomone AGC‐003); revealed with antibody against GluN2B C‐terminal (mouse, 1:800, Invitrogen MA1‐2014). IP of GluN2A (antibody GluN2A N‐terminal, mouse, 100 μL supernatant, HybridomaBank N327/95) revealed with antibody against GluN2A C‐terminal (rabbit, 1:800, Invitrogen A6473). IP of GluN1 (antibody GluN1 N‐terminal, guinea pig, 10 μL, Alomone AGP‐046) revealed with antibody against GluN1 N‐terminal (mouse, 30 μL supernatant, HybridomaBank, N308/48). Bc, bound from control IP (IgG); B, bound fraction from the IP; Input, SynF or ExsynF. (C) Western blot of brain homogenates from a wild‐type mouse (WT), a mouse lacking GluN3A (Grin3a −/−) and from control human samples (SynF and ExsynF) revealed with GluN3A ‐Ct (rabbit, 1:1000, Millipore 07‐356).
FIGURE 3
FIGURE 3
Glycosylation of N‐methyl‐D‐aspartate receptor (NMDAR) subunits. (A) Enzymatic deglycosylation of synaptic fraction (SynF) and extrasynaptic membranes (ExsynF) (3B) with N‐glycanase (N), syalidase (SA), O‐glycanase (OG), or a combination of them in control samples, revealed with antibodies against Glun2B C‐terminal (Invitrogen MA1‐2014) and GluN2A C‐terminal (Invitrogen A6473). Black arrowheads indicate bands corresponding to ∼170 kDa GluN2B and ∼170 kDa GluN2A. White arrowheads indicate ∼160 kDa bands of GluN2B and GluN2A. (B) NMDAR subunits in SynF and ExsynF fractions from control and AD cases, after N‐deglycosilation (+) or in unprocessed samples (‐), revealed with antibodies against the C‐terminal of GluN2B and GluN2A.
FIGURE 4
FIGURE 4
Comparison of GluN2B phosphorylation in synaptic fraction (SynF) and extrasynaptic membranes (ExsynF) between control and Alzheimer's disease (AD) cases. (A) Representative blots and (B) quantification of GluN2B (total protein resolved with mouse C‐terminal antibody MA1‐2014) and GluN2B phosphorylation (P‐GluN2B) at Tyr1472 (rabbit antibody p1516‐1472) and at Tyr1336 (rabbit antibody p1516‐1336) in synaptic and extrasynaptic GluN2B‐170 kDa from control and AD samples (Braak V–VI). The fluorescence of the secondary antibodies (IRDye 680RD goat anti‐mouse, red; IRDye 800CW goat anti‐rabbit, green) was detected with the Odyssey CLx Infrared Imaging system (LI‐COR); merge fluorescence shows co‐localization (yellow). Ratio of phosphorylated GluN2B respect to total GluN2B levels are plotted. Cases control SynF n = 9–11; control ExsynF n = 8–11; AD SynF = 11–20; AD ExsynF n = 11–14. Observe the different Y scale for ExsynF graphs. *< 0.05, **p < 0.001 with respect to control, t‐test.
FIGURE 5
FIGURE 5
Distribution of N‐methyl‐D‐aspartate receptor (NMDAR) subunits in membrane‐containing fractions from control and Alzheimer's disease (AD) cases. (A) Representative Western blots of NMDAR subunits in membrane fraction (P2, 10 μg), synaptic fraction (SynF, 10 μg) and extrasynaptic fractions (ExsynF, 50 μg) from control and AD samples (Braak V–VI). Tubulin was used to normalize quantifications. (B) Quantification of NMDAR subunits levels at different Braak stages and all Braak stages together (AD: Braak stages I–VI) expressed as percentage respect to controls. GluN2B‐170 kDa and GluN2A‐170 kDa levels were measured in P2, SynF and ExsynF; GluN2B‐160 kDa and GluN2A‐160 kDa were measured in ExsynF only. *< 0.05, **< 0.01, ***< 0.001 respect to control, t‐test; #< 0.01 analysis of variance (ANOVA) one‐way comparing control and all Braak stages. Cases control P2 n = 10–13; control SynF n = 10–14; control ExsynF n = 10–12; AD P2 n = 18–22; AD SynF n = 21–24; AD ExsynF AD = 17–24.
FIGURE 6
FIGURE 6
GluN2B phosphorylation from control and Alzheimer's disease (AD) cases comparing synaptic fraction (SynF) and extrasynaptic membranes (ExsynF). (A) Representative Western blots of GluN2B, phospho GluN2B Tyr1472, and phospho GluN2B Tyr1336 in SynF and ExsynF of controls and AD (Braak V–VI) samples. (B) Quantification of GluN2B‐170 kDa phosphorylation at SynF (phospho Tyr1472, phospho Tyr1336) and at ExsynF (phospho Tyr1336). Levels of phosphorylated GluN2B were normalized to total GluN2B and estimated as in Figure 4. *p < 0.05 AD v control, t‐test. Cases control SynF n = 15–17; control ExsynF n = 13; AD SynF n = 17–22; AD ExsynF n = 19.
FIGURE 7
FIGURE 7
N‐Methyl‐D‐aspartate receptor (NMDAR) subunits interaction with N‐glycan lectins. (A) Representative Western blots for GluN2B, GluN2A, GluN1, and GluN3A of unbounds and inputs of synaptic fraction (SynF) and extrasynaptic membranes (ExsynF) fractions after incubation with wheat germ agglutinin (WGA) and Con A lectins, from control and Braak stage V–VI samples. (B) Quantification of SynF and ExsynF unbound fraction to WGA or Con A lectins from control and AD samples, with respect to the input fraction (SynF or ExsynF respectively) expressed as percentage (%). Data represent SynF GluN2B‐170 kDa, SynF GluN2A‐170 kDa, SynF GluN1, ExsynF GluN2B‐160 kDa, ExsynF GluN2A‐160 kDa, and ExsynF GluN1. Values represent percentage unbound ± standard deviation. Control SynF n = 5, controls ExsynF n = 7; Braak V–VI SynF n = 6, Braak V–VI ExsynF n = 7. nd, not determined.
FIGURE 8
FIGURE 8
N‐Methyl‐D‐aspartate receptor (NMDAR) subunit levels and GluN2B phosphorylation in Alzheimer's disease (AD) mouse models TauP301S and APP/PS1. (A) The fractionation protocol in wild‐type mice (WT) and transgenic mice (Tg) cortex was the same as that described for human samples in Figure 1. Representative Western blot of S2, P2, synaptic fraction (SynF), and extrasynaptic membranes (ExsynF) fractions from WT and TauP301S mice (Tg) developed with antibodies against Glun2B, post‐synaptic density95 (PSD95), synaptophysin, and glial fibrillary astrocytic protein (GFAP); similar patterns were obtained for APP/PS1 mice (not shown). (B) Representative Western blots of NMDAR subunits in SynF and ExsynF from WT and TauP301S mice (Tg); and from WT and APP/PS1 mice (Tg), as indicated. (C) Quantification of GluN2B, Tyr1472 phosphorylation of GluN2B (P‐GluN2B Tyr1472), Tyr1336 phosphorylation of GluN2B (P‐GluN2B Tyr1472), GluN2A, GluN1, and GluN3A levels in SynF and ExsynF from WT and TauP301S mice (Tg). WT SynF n = 6–13, WT ExsynF = 12–13, Tg SynF n = 6–12, Tg ExsynF nn = 12. (D) Quantification of GluN2B, Tyr1472 phosphorylation of GluN2B (P‐GluN2B Tyr1472), Tyr1336 phosphorylation of GluN2B (P‐GluN2B Tyr1472), GluN2A, GluN1, and GluN3A levels in SynF and ExsynF from WT and APP/PS1 mice (Tg). WT SynF = 5–10, WT ExsynF n = 5–10, Tg SynF n = 5–10; Tg ExsynF n = 5–10. **< 0.01 respect to WT.

References

    1. Paoletti P, Bellone C, Zhou Q. NMDA receptor subunit diversity: impact on receptor properties, synaptic plasticity and disease. Nat Rev Neurosci. 2013;14(6):383‐400. doi:10.1038/NRN3504 - DOI - PubMed
    1. Reisberg B, Doody R, Stöffler A, Schmitt F, Ferris S, Möbius HJ. Memantine in moderate‐to‐severe Alzheimer's disease. N Engl J Med. 2003;348(14):1333‐1341. doi:10.1056/NEJMOA013128 - DOI - PubMed
    1. Paoletti P. Molecular basis of NMDA receptor functional diversity. Eur J Neurosci. 2011;33(8):1351‐1365. doi:10.1111/J.1460-9568.2011.07628.X - DOI - PubMed
    1. Sanz‐Clemente A, Nicoll RA, Roche KW. Diversity in NMDA receptor composition: many regulators, many consequences. Neuroscientist. 2013;19(1):62‐75. doi:10.1177/1073858411435129 - DOI - PMC - PubMed
    1. Pegasiou CM, Zolnourian A, Gomez‐Nicola D, et al. Age‐dependent changes in synaptic NMDA receptor composition in adult human cortical neurons. Cereb Cortex. 2020;30(7):4246‐4256. doi:10.1093/CERCOR/BHAA052 - DOI - PubMed

Substances

LinkOut - more resources