. 2024 Dec 1;137(23):jcs263546.
doi: 10.1242/jcs.263546. Epub 2024 Dec 11.

The dual Ras-association domains of Drosophila Canoe have differential roles in linking cell junctions to the cytoskeleton during morphogenesis

Affiliations

The dual Ras-association domains of Drosophila Canoe have differential roles in linking cell junctions to the cytoskeleton during morphogenesis

Emily D McParland et al. J Cell Sci. .

Abstract

During development cells must change shape and move without disrupting dynamic tissue architecture. This requires robust linkage of cell-cell adherens junctions to the force-generating actomyosin cytoskeleton. Drosophila Canoe and mammalian afadin play key roles in the regulation of such linkages. One central task for the field is defining mechanisms by which upstream inputs from Ras-family GTPases regulate Canoe and afadin. These proteins are unusual in sharing two tandem Ras-association (RA) domains - RA1 and RA2 - which when deleted virtually eliminate Canoe function. Work in vitro has suggested that RA1 and RA2 differ in GTPase affinity, but their individual functions in vivo remain unknown. Combining bioinformatic and biochemical approaches, we find that both RA1 and RA2 bind to active Rap1 with similar affinities, and that their conserved N-terminal extensions enhance binding. We created Drosophila canoe mutants to test RA1 and RA2 function in vivo. Despite their similar affinities for Rap1, RA1 and RA2 play strikingly different roles. Deleting RA1 virtually eliminates Canoe function, whereas mutants lacking RA2 are viable and fertile but have defects in junctional reinforcement in embryos and during pupal eye development. These data significantly expand our understanding of the regulation of adherens junction-cytoskeletal linkages.

Keywords: Adherens junction; Afadin; Canoe; GTPases; Morphogenesis; Rap1.


Conflict of interest statement

Competing interests The authors declare no competing or financial interests.

Figures

Fig. 1.
Fig. 1.
The Cno RA domains are predicted to bind Rap1 using a conserved surface but have unique conserved surfaces outside that binding site. (A) Drosophila Cno and human afadin. Regions involved in interactions with Rap1, F-actin, and E-cadherin (Ecad) and Echinoid are marked, along with amino acid sequence identity for selected domains (aas, amino acids). (B) Sequence alignment and secondary structure of Drosophila Cno and mouse afadin (Afd) RA1 and RA2. αN helices (αN) are colored in purple. Green, residues identical strictly within either RA1 or RA2; orange, residues identical between RA1 and RA2. (C,D) AlphaFold2 models of Cno RA1–Rap1 (C) and Cno RA2–Rap1 (D) complexes. Left: cartoon format. Right three panels: RA domain in surface representation, with identity mapped as in B, rotated as shown. The αN helix of each RA domain is colored in purple. Rap1 switch I and II regions are shown in dark red. GMPPNP and Mg2+ are modeled based on aligning predictions with the afadin RA1–H-Ras structure (PDB ID: 6AMB; Fig. S1C).
Fig. 2.
Fig. 2.
Activated Rap1 forms stable complexes with both RA1 and RA2. (A–B‴) SEC-MALS of Drosophila Rap1 and Cno RA domains alone and in complex. Formula molecular masses for GMPPNP-bound Rap1G12V, RA1 and RA2, and for 1:1 stoichiometric Rap1–RA domain complexes, are indicated in the respective panels by dashed horizontal lines and were confirmed with SDS-PAGE (right-hand images are Coomassie Brilliant Blue-stained gels, molecular mass marked in kDa). Experimental masses were determined by SEC-MALS. SEC-MALS was performed in duplicate. A representative run is shown, with experimental mass data overlaid on the chromatograms. (A) Rap1-GMPPNP-Mg: formula mass=21.0 kDa, experimental mass=24.6±0.1 kDa. (A′) RA1: formula mass=15.1 kDa (His-tag removed), experimental mass=16.4±0.1 kDa. (A″) The complex: formula mass=36.1 kDa, experimental mass=35.7±0.1 kDa (left peak). Unbound RA1 (right peak): experimental mass=19.5±0.1 kDa. (A‴) Super-positioning of runs in A–A″. (B) Rap1-GMPPNP-Mg: formula mass=21.0 kDa, experimental mass=21.4±0.1 kDa. (B′) RA2 with His-tag: formula mass=17.0 kDa, experimental mass=16.82±0.03 kDa. (B″) The complex: formula mass=38.0 kDa, experimental mass=30.44±0.04 kDa (left peak). Unbound RA2 (right peak): experimental mass=19.0±0.1 kDa. (B‴) Super-positioning of runs in B–B″. Errors are s.e.m. (C,D) ITC analyses of interactions between Rap1-GMPPNP and RA1 (C) or RA2 (D). Data from representative experiments are shown. Rap1–RA1 ITC and Rap1–RA2 ITC were performed in duplicate and triplicate, respectively. Detailed results of each experiment are in the Materials and Methods.
Fig. 3.
Fig. 3.
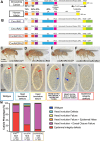
Deleting RA1 severely reduces Cno function in morphogenesis, RA2 is dispensable and the RA1 domain cannot be replaced by RA2. (A) Drosophila Cno and human afadin, labeled as in Fig. 1A. (B) The Cno mutants examined. (C–F) Adult flies of the indicated genotypes. cnoΔRA2 and cnoRA1RA1 are viable over the null allele cnoR2 and are viable when homozygous. Scale bar in C applies to C–F. (G–L) Embryonic cuticles in eggshells at the end of embryonic development, showing illustrative examples of possible defects differing in severity. (G) Wild-type embryo with intact head skeleton (arrow). (H) Defects in head involution disrupt the head skeleton (arrow). (I) Complete head involution failure, leading to an anterior hole (arrow). (J) Head involution failure (red arrow) and holes in dorsal or ventral epidermis (blue arrow). (K) Complete failure of head involution and dorsal closure, leaving cuticles open anterior (red arrow) and dorsally (blue arrow). (L) More severe defects in epidermal integrity. Scale bar in G applies to G–L. (M) Stacked bar graph illustrating defects in different mutants. The indicated mutants were scored according to the phenotype categories in G–L. Most cno maternal–zygotic (M/Z) null mutants (cnoR10) combine complete failure of head involution and dorsal closure with additional defects in epidermal integrity. Most cnoΔRA1 maternal–zygotic mutants are slightly less severe, with complete failure of head involution and dorsal closure but without additional epidermal holes. cnoRA2RA2 maternal–zygotic mutants are similar but on average slightly less severe. Sibs, siblings. Images in G–L are also shown in Fig. 7B–G to illustrate the phenotype categories used in Fig. 7H.
Fig. 4.
Fig. 4.
The RA1 domain is required for Cno localization and function as AJs are positioned during cellularization. (A–K′) Immunofluorescence images of late cellularization embryos. Genotypes and antigens are indicated. (A–B″) Wild-type (WT) cross-section (XC) (A–A″) and MIP (B–B″). Arm is enriched both in nascent SAJs (green arrowheads) and basal junctions (red arrowheads). Cno localizes to SAJs (green arrowheads) and is largely absent more basally (red arrowheads). (C–C″) Images acquired at the level of SAJs. Wild-type Cno is enriched at TCJs (green arrowheads) relative to bicellular junctions (red arrowheads). (D–E″) cnoΔRA1 cross-section (D–D″) and MIP (E–E′). (F–G″) cnoΔRA1. Images acquired at the level of SAJs (F–F″) or basal junctions (BJs) (G–G″). Arm enrichment at SAJs is reduced (D–E″ green arrowheads) whereas basal junction enrichment remains (D–E″ red arrowheads, G). CnoΔRA1 protein puncta are found all along the apical–basal axis. Membrane enrichment is reduced (F″,G″). No TCJ enrichment is apparent (arrowheads in F–F″). (H,I) Baz imaged at the level of SAJs (H) and in MIP (I). Normal apical Baz enrichment is lost. (J–K′) cnoΔRA. Although CnoΔRA protein is less apically enriched, it remains localized to cell membranes (green arrowheads indicate SAJs; red arrowheads more basally localized protein). (L–L″) Immunofluorescence images of a stage 7 cnoΔRA1 embryo. Antigens are indicated. As gastrulation starts, CnoΔRA1 protein returns to AJs. All scale bars: 10 μm. Scale bars in A and D are also accurate for B and E. Scale bar in G is accurate in H and I.
Fig. 5.
Fig. 5.
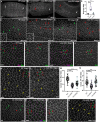
The Cno RA1 domain is important for reinforcing AJs under tension and for Cno enrichment at these junctions. Immunofluorescence images of embryos, anterior left, dorsal up; stage, genotype and antigens indicated. (A) Wild-type (WT) embryo. Ventral furrow is completely closed (arrows). (B,C) In many cnoΔRA1 mutants, the furrow has not fully closed (red arrows). White arrows indicate closed ventral furrow. (D) Quantification of AJ gaps per field of view at stages 7 and 8. n=9–10 embryos analyzed per genotype. (E,G) Wild-type embryos. At stages 7 and 8, very few AJ gaps are seen (green arrows, no gap; red arrows, gap). (F,H) cnoΔRA1 mutants have numerous gaps at aligned AP borders and rosette centers (red arrows). Insets in E and F show enlarged regions illustrating this. (I,I′) Wild-type embryo. Baz is subtly enriched at DV borders (green arrowheads) as compared to AP borders (red arrowheads) but surrounds each cell. (J) cnoΔRA1. Baz is substantially reduced at AP borders (red arrowheads) and often confined to the center of DV borders (green arrowheads). (K) Wild-type embryo. Cno is enriched at many TCJs (yellow arrows) and subtly enriched at AP borders (red arrowheads) as compared to DV borders (green arrowheads). (L) cnoΔRA1. TCJ and AP border enrichment are reduced (arrows and arrowheads as in K). (M,N) Quantification of Cno enrichment at TCJs (M) and AP borders (N). n=40 TCJ or aligned AP borders from four embryos per genotype. (O) cnoΔRA2. Few gaps are seen in AJs (green arrows, no gap; red arrow, gap). (P,P′) cnoΔRA2. Baz localization is relatively normal (green and red arrowheads as in E). (Q) cnoΔRA2. Some TCJ enrichment remains (yellow arrows) and AP border enrichment is unchanged (red arrowheads, AP borders; green arrowheads, DV borders). Box and whisker plots in D,M,N show the median (line), 25th–75th percentiles (box) and 5th–95th percentiles (whiskers). ****P<0.0001; n.s., not significant (ANOVA and Brown–Forsythe test). All scale bars: 10 μm.
Fig. 6.
Fig. 6.
The Cno RA1 domain is important for dorsal closure, head involution and epidermal integrity. Immunofluorescence images of embryos, anterior left and dorsal up unless stated; stage, genotype and antigens indicated. (A,B) Stage 10. (A) Wild-type (WT) embryo. Some cells are rounded up to divide (white arrows), but they rapidly return to columnar architecture. (B) cnoΔRA1. Groups of cells near the ventral midline fail to resume columnar architecture (red arrows). (C–E) Stage 11. (C) Wild-type embryo. (D,E) cnoΔRA1. Failure to resume columnar architecture becomes more apparent (red arrows). (F–H) Stage 14. (F) Ventral view of a wild-type embryo. Dorsal closure is completed (white arrow), head involution is underway (yellow arrow) and segmental grooves are shallow (green arrowheads). (G) cnoΔRA1. Dorsal closure failed, exposing underlying tissues (red arrow). There are gaps in the head epidermis (yellow arrows) and deep segmental grooves remain (green arrowheads). (H) Ventral view, cnoΔRA1. Holes in the epidermis (red arrows) and deep segmental grooves (green arrowheads) are observed. (I–J) Closeups, wild-type stage 10 (I–I″) and 11 (J). Dividing cells (green arrows) and forming tracheal pits (cyan arrows) are observed. Arm, Baz and Cno remain enriched at AJs. (K–K‴) Stage 10/11 cnoΔRA1 mutant. Cells that retained columnar architecture retain junctional Arm, Baz and CnoΔRA1 (yellow arrows). However, in some cells AJs are fragmented (red arrows) and in less epithelial regions Arm, Baz and Cno are strongly reduced (cyan arrows). Scale bar in A applies to A–H; scale bar in I applies to I–K‴. Images are representative of more than 30 embryos from six experiments.
Fig. 7.
Fig. 7.
A sensitized assay reveals that CnoΔRA2 does not provide fully wild-type function in embryonic morphogenesis. (A) Quantification of embryonic lethality for the indicated genotypes (sibs, siblings). Right-hand axis shows expected distribution of genotypes at Mendelian ratios. Data are presented as mean±s.d. of three to five experiments. (B–G) Embryonic cuticles illustrating range of severity of phenotypes (images also used in Fig. 3G–L). Scale bar in B applies to B–G. (H) Stacked bar graphs illustrating cuticle defects in the indicated genotypes. Mutants were scored according to the phenotype categories illustrated in B–G. Most cnoR2 zygotic mutants only have defects in head involution. Progeny of cnoR2/cnoΔRA2 parents have more severe defects, with frequent dorsal closure failure. In contrast, progeny of cnoR2/cnoRA1RA1 parents have defects indistinguishable from those of cnoR2/+ parents. (I–N) Immunofluorescence images of embryos, anterior left; stages and antigen indicated. Embryos labeled cnoΔRA2/cnoR2 are progeny of cnoΔRA2/cnoR2 parents – genotype was not determined. (I,J) Wild-type (WT) embryo at stage 13. (I) Dorsal closure (red arrowheads) and head involution (yellow arrow) are proceeding, with zipping beginning at canthi (green arrow). (J) The leading edge is straight, and cell shapes are relatively uniform (red arrowheads). (K–N) cnoΔRA2/cnoR2 at stage 13 and 14, as indicated. The leading edge is wavy (K, red arrowheads), zipping is slowed (K, green arrowhead), leading edge cell shapes are less uniform (L, arrowheads), head involution fails (M and N, yellow arrows) and ventral epidermal holes are sometimes present (N, cyan arrows). Images are representative of 13 embryos from three experiments. Scale bars (I–N): 15 μm.
Fig. 8.
Fig. 8.
The Cno RA2 domain is essential for morphogenesis in the pupal eye. (A) Diagram of a pupal eye ommatidium 40 h after puparium formation. (B,C) Immunofluorescence images showing regions of cno-wt-GFP (B) and cnoΔRA2 (C) homozygote eyes 40 h after puparium formation, with tracings of images below. Incorrectly organized cone cells are colored orange in the tracings. (D) Patterning errors for all genotypes quantified as average number of patterning errors per ommatidium. Data are presented as mean±s.e.m. of n=76–110 ommatidia from three experiments. Statistical significance determined using two-tailed two-sample with unequal variance Student's t-tests. (E–G) Regions of cnoR2/cnoΔRA2 (E), cnoR2/+ (F) and cnoRA1RA1 (G) eyes 40 h after puparium formation, with tracings of images below. Incorrectly organized cone cells are colored orange in the tracings. GFP-tagged Cno was detected in B,C,E and G, and endogenous Cno was detected in F. Scale bar in B applies to B,C,E–G.

References

    1. Birukova, A. A., Tian, X., Tian, Y., Higginbotham, K. and Birukov, K. G. (2013). Rap-afadin axis in control of Rho signaling and endothelial barrier recovery. Mol. Biol. Cell 24, 2678-2688. 10.1091/mbc.e13-02-0098 - DOI - PMC - PubMed
    1. Blackie, L., Tozluoglu, M., Trylinski, M., Walther, R. F., Schweisguth, F., Mao, Y. and Pichaud, F. (2021). A combination of Notch signaling, preferential adhesion and endocytosis induces a slow mode of cell intercalation in the Drosophila retina. Development 148, dev197301. 10.1242/dev.197301 - DOI - PMC - PubMed
    1. Boettner, B. and Van Aelst, L. (2009). Control of cell adhesion dynamics by Rap1 signaling. Curr. Opin. Cell Biol. 21, 684-693. 10.1016/j.ceb.2009.06.004 - DOI - PMC - PubMed
    1. Boettner, B., Govek, E.-E., Cross, J. and Van Aelst, L. (2000). The junctional multidomain protein AF-6 is a binding partner of the Rap1A GTPase and associates with the actin cytoskeletal regulator profilin. Proc. Natl. Acad. Sci. USA 97, 9064-9069. 10.1073/pnas.97.16.9064 - DOI - PMC - PubMed
    1. Boettner, B., Harjes, P., Ishimaru, S., Heke, M., Fan, H. Q., Qin, Y., Van Aelst, L. and Gaul, U. (2003). The AF-6 homolog canoe acts as a Rap1 effector during dorsal closure of the Drosophila embryo. Genetics 165, 159-169. 10.1093/genetics/165.1.159 - DOI - PMC - PubMed

MeSH terms

LinkOut - more resources