. 2024 Dec;11(12):3175-3191.
doi: 10.1002/acn3.52224. Epub 2024 Oct 25.

RNA mis-splicing in children with congenital myotonic dystrophy is associated with physical function

Affiliations

RNA mis-splicing in children with congenital myotonic dystrophy is associated with physical function

Julia M Hartman et al. Ann Clin Transl Neurol. 2024 Dec.

Abstract

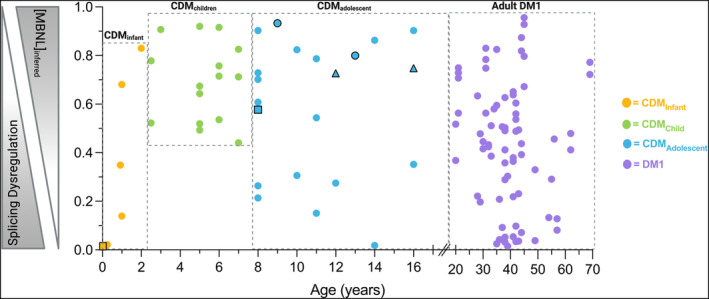
Objectives: Dysregulated RNA alternative splicing is the hallmark of myotonic dystrophy type 1 (DM1). However, the association between RNA mis-splicing and physical function in children with the most severe form of disease, congenital myotonic dystrophy (CDM), is unknown.

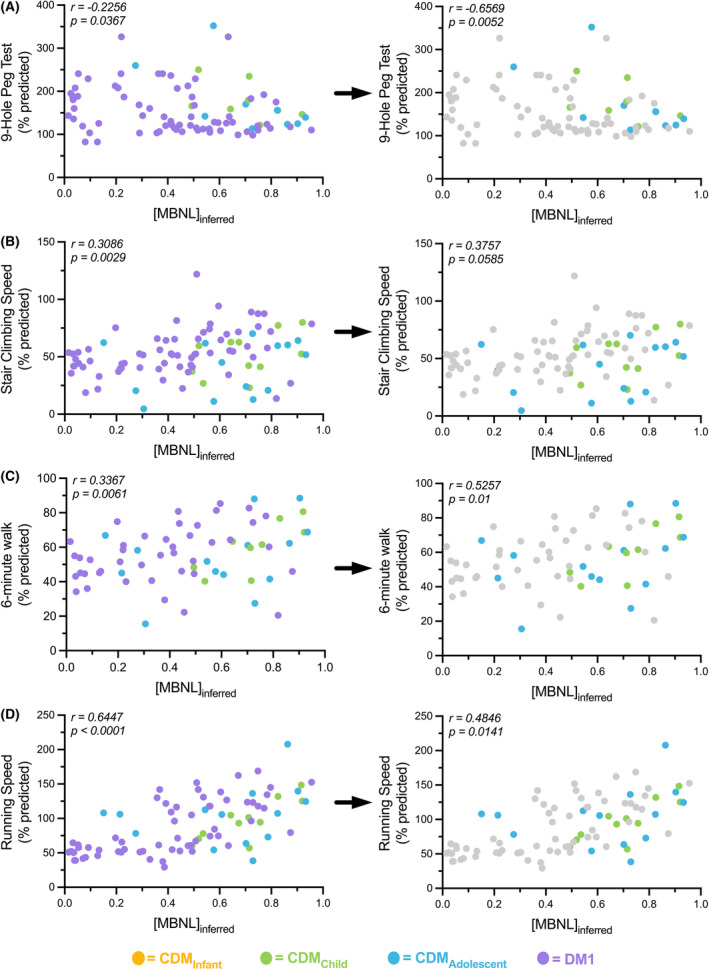
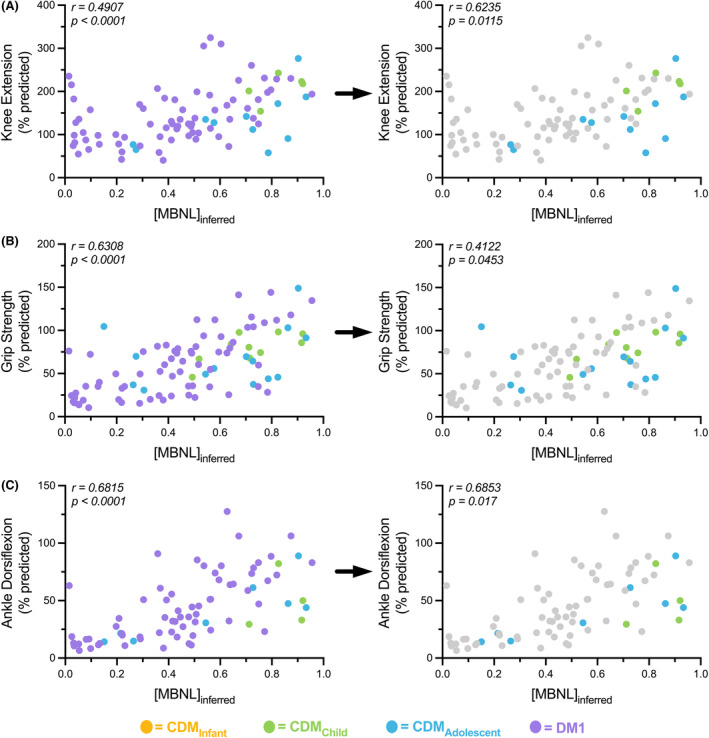
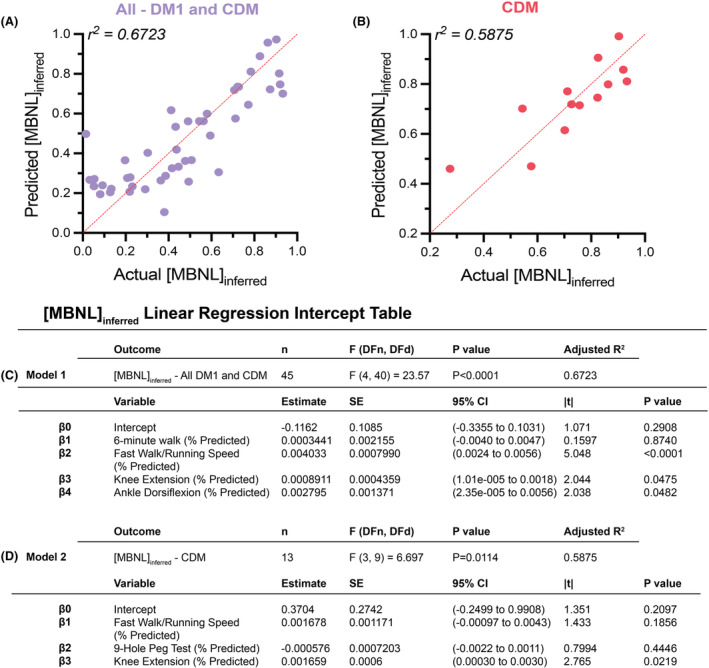
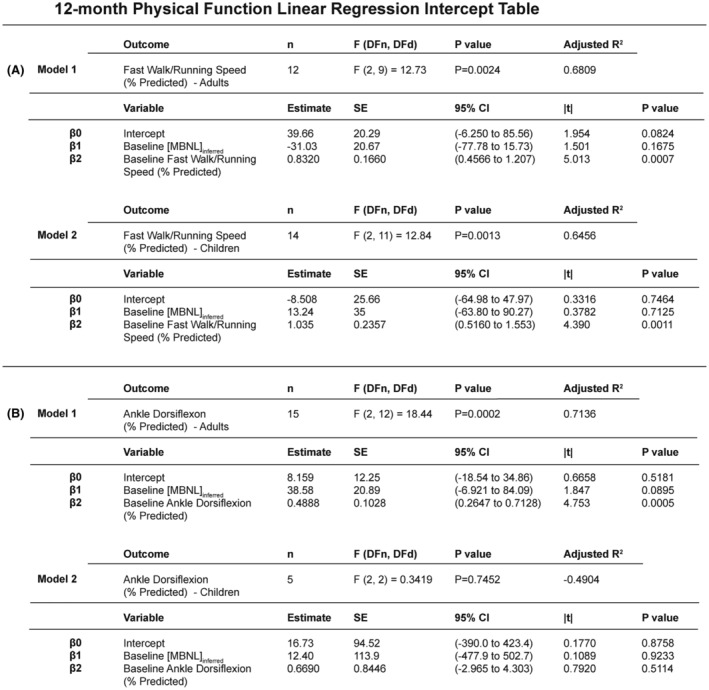
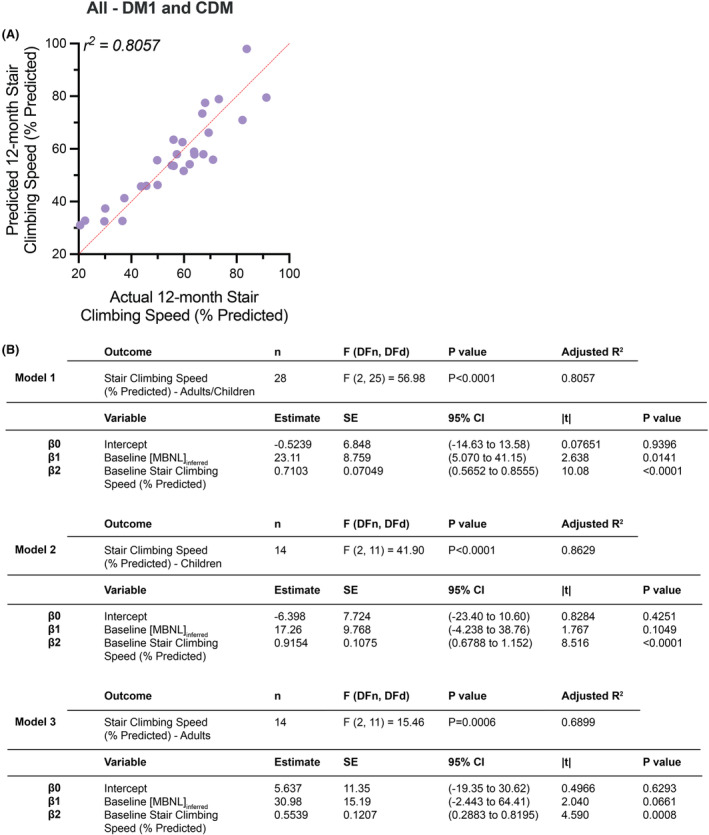
Methods: Eighty-two participants (42 adults with DM1 and 40 children with CDM) with muscle biopsies and measures of myotonia, motor function, and strength were combined from five observational studies. Data were normalized and correlated with an aggregate measure of alternative splicing dysregulation, [MBNL]inferred, in skeletal muscle biopsies. Multiple linear regression analysis was performed to predict [MBNL]inferred using clinical outcome measures alone. Similar analyses were performed to predict 12-month physical function using baseline metrics.

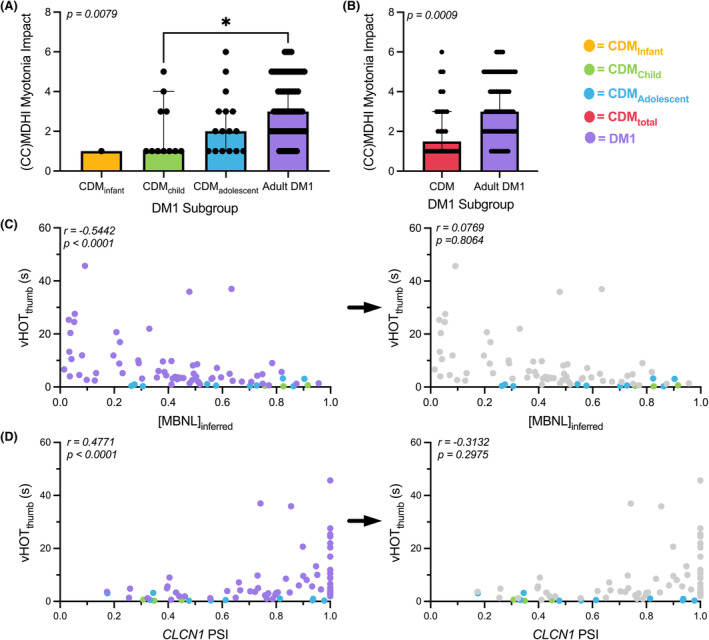
Results: Myotonia (measured via vHOT) was significantly correlated with RNA mis-splicing in our cross-sectional population of all DM1 individuals; CDM participants alone displayed no myotonia despite a similar range of RNA mis-splicing. Measures of motor performance and muscle strength were significantly associated with [MBNL]inferred in our cohort of all DM1 individuals and when assessing children with CDM independently. Multiple linear regression analyses yielded two models capable of predicting [MBNL]inferred from select clinical outcome assessments alone in all subjects (adjusted R2 = 0.6723) or exclusively in children with CDM (adjusted R2 = 0.5875).

Interpretation: Our findings establish significant correlations between skeletal muscle performance and a composite measure of alternative splicing dysregulation, [MBNL]inferred, in DM1. The strength of these correlations and the development of predictive models will assist in designing efficacious clinical trials for individuals with DM1, particularly CDM.


Conflict of interest statement

Julia M. Hartman, Marina Provenzano, Kameron Bates, Kobe Ikegami, Amanda Butler, Aileen S. Jones, Kiera N. Berggren, Marnee J. McKay, Jennifer N. Baldwin, and Kayla M.D. Cornett – None. Jeanne Dekdebrun – Consultation for Avidity Biosciences, Dyne Therapeutics, Vertex, Lupin, Arthex, PepGen and Trins. Joshua Burns – Research Support from the University of Sydney, Sydney Children's Hospitals Network, Australian Government (NHMRC#2015970, MRFF#1152226), United States Government (NIH NINDS#1U01NS109403, NIH NCATS/NINDS# U54NS065712), Muscular Dystrophy Association, American Orthotic and Prosthetic Association, Charcot Marie Tooth Association and Charcot Marie Tooth Australia. Scientific Advisory Board fees from Faculty of Medicine Siriraj Hospital Mahidol University Thailand; Department of Rehabilitation Sciences, The Hong Kong Polytechnic University; Hereditary Neuropathy Foundation. Consulted for DTx Pharma, Applied Therapeutics, Pharnext. Michael Kiefer – Has provided consultation for Aspa therapeutics. Nicholas E. Johnson – He has received grant funding from NINDS (R01NS104010, U01NS124974), NCATS (R21TR003184), CDC (U01DD001242) and the FDA (7R01FD006071). He receives royalties from the CCMDHI and the CMTHI. He receives research funds from Novartis, Takeda, PepGen, Sanofi Genzyme, Dyne, Vertex Pharmaceuticals, Fulcrum Therapeutics, AskBio, ML Bio, and Sarepta. He has provided consultation for Arthex, Angle Therapeutics, Juvena, Rgenta, PepGen, AMO Pharma, Takeda, Design, Dyne, AskBio, Avidity, and Vertex Pharmaceuticals. Melissa A. Hale – She has provided consultation for Juvena and Arrakis Therapeutics.

Figures

Figure 1
Figure 1
[MBNL]inferred values calculated from DM1 and CDM skeletal muscle total RNA sequencing across pediatric development and adulthood. [MBNL]inferred values range from 0 to 1 and inversely correlate with global mis‐splicing severity. CDM infants (CDMinfant; ≤ 2 years) are shown in yellow. CDM children (CDMchild; 2–8 years) are shown in green; CDM adolescent (CDMadolescent; 8–16 years) individuals are show in blue. Adult DM1 (20–69 years) individuals are shown in purple. CDM‐01 longitudinal biopsies shown as black‐outlined squares. CDM‐30 longitudinal biopsies shown as black‐outlined circles. CDM‐37 longitudinal biopsies are shown as black‐outlined triangles.
Figure 2
Figure 2
Myotonia measures in adult DM1 and CDM participants correlate disparately with skeletal muscle spliceopathy. (A) Myotonia MDHI/CCMDHI scale average responses across CDM subcohorts and adult DM1 participants. Results are expressed as median ± 95% confidence interval (CI) via Kruskal–Wallis test with Dunn's multiple comparisons test. (B) Myotonia scale average value between DM1 individuals and all CDM individuals. Results are expressed as median ± 95% CI via unpaired Mann–Whitney test. (C) Correlation between [MBNL]inferred and vHOTthumb times in all DM1 individuals (left) and CDM individuals alone (right panel). Adult DM1 measures are removed from the statistical analysis in the right panel but grayed out and included in the figure for visual reference. (D) Correlation between CLCN1 exon 7a percent spliced in (PSI) and vHOTthumb times in all DM1 individuals and CDM individuals. All correlations are reported from a two‐tailed Spearman test.
Figure 3
Figure 3
MBNL‐dependent mis‐splicing as measured by [MBNL]inferred correlates moderately with motor function measures in DM1 individuals. Correlation between [MBNL]inferred and (A) 9‐hole peg test (% predicted), (B) stair climbing speed (% predicted), (C) 6‐min walk distance (% predicted), and (D) walk/running speed (% predicted) in all DM1 individuals and CDM individuals. Left panels represent correlations of all DM1 subjects and right panels represent CDM subjects only. The adult DM1 measures were excluded from the CDM statistical analyses but grayed out and included in the figure on the right for visual reference. Correlations are reported from a two‐tailed Spearman test.
Figure 4
Figure 4
MBNL‐dependent mis‐splicing as measured by [MBNL]inferred correlates with muscle strength independent of age. Correlation between [MBNL]inferred and (A) knee extension (% predicted), (B) hand grip strength (% predicted), and (C) ankle dorsiflexion (% predicted) in all DM1 and CDM individuals. Left panels represent correlations of all DM1 subjects and right panels represent CDM subjects only. The adult DM1 measures were excluded from the CDM statistical analyses but grayed out and included in the figure on the right for visual reference. Correlations are reported from a two‐tailed Spearman test.
Figure 5
Figure 5
Multiple linear regression modeling to predict [MBNL]inferred in DM1 participants using functional outcomes. (A) Multiple linear regression plot showing observed [MBNL]inferred versus predicted [MBNL]inferred for all DM1 individuals. (B) Multiple linear regression plot showing observed [MBNL]inferred versus predicted [MBNL]inferred for CDM individuals. Intercept table of multiple linear regression models for (C) complete DM1 cohort and (D) CDM cohort alone using clinical outcome measures to predict [MBNL]inferred. Multiple statistical elements are reported (|t|, t‐test statistic; 95% CI, 95% confidence interval; DFd, degrees of freedom denominator; DFn, degrees of freedom numerator; F, F‐distribution; SE, standard error). Extended intercept tables for the complete DM1 cohort model are provided in Table S3 and for the CDM cohort in Table S4.
Figure 6
Figure 6
Multiple linear regression predictive models of 12‐month ankle dorsiflexion strength and 10‐meter walk/running speed in DM1 participants. Intercept table of multiple linear regression models for (A) 12‐month walk/running speed (% predicted) and (B) 12‐month ankle dorsiflexion strength (% predicted) using baseline [MBNL]inferred values and baseline physical function values. Multiple statistical elements are reported (|t|, t‐test statistic; 95% CI, 95% confidence interval; DFd, degrees of freedom denominator; DFn, degrees of freedom numerator; F, F‐distribution; SE, standard error). Extended intercept tables for the 12‐month walk/running speed models and 12‐month ankle dorsiflexion strength are in Tables S5 and S6, respectively.
Figure 7
Figure 7
Multiple linear regression predictive modeling of 12‐month stair climbing speed in DM1 participants. (A) Multiple linear regression plot showing observed 12‐month stair climbing speed (% predicted) versus predicted 12‐month stair climbing speed (% predicted) for all DM1 individuals (adults and children). (B) Intercept table of multiple linear regression models for complete DM1 cohort (Model 1), CDM cohort alone (Model 2), and adult cohort alone (Model 3). Multiple statistical elements are reported (|t|, t‐test statistic; 95% CI, 95% confidence interval; DFd, degrees of freedom denominator; DFn, degrees of freedom numerator; F, F‐distribution; SE, standard error). Extended intercept tables for all three models are provided in Table S7.

Update of

References

    1. Johnson NE, Butterfield RJ, Mayne K, et al. Population‐based prevalence of myotonic dystrophy type 1 using genetic analysis of statewide blood screening program. Neurology. 2021;96(7):e1045‐e1053. - PMC - PubMed
    1. Mahadevan M, Tsilfidis C, Sabourin L, et al. Myotonic dystrophy mutation: an unstable CTG repeat in the 3′ untranslated region of the gene. Science. 1992;255(5049):1253‐1255. - PubMed
    1. Fu YH, Pizzuti A, Fenwick RG, et al. An unstable triplet repeat in a gene related to myotonic muscular dystrophy. Science. 1992;255(5049):1256‐1258. - PubMed
    1. Brook JD, McCurrach ME, Harley HG, et al. Molecular basis of myotonic dystrophy: expansion of a trinucleotide (CTG) repeat at the 3′ end of a transcript encoding a protein kinase family member. Cell. 1992;68(4):799‐808. - PubMed
    1. Hartman J, Patki T, Johnson NE. Diagnosis and Management of Myotonic Dystrophy Type 1. JAMA. 2024;331(14):1227‐1228. doi:10.1001/jama.2024.2511 - DOI - PMC - PubMed

LinkOut - more resources