. 2024 Oct 12;13(20):1686.
doi: 10.3390/cells13201686.

Long-Term Human Immune Reconstitution, T-Cell Development, and Immune Reactivity in Mice Lacking the Murine Major Histocompatibility Complex: Validation with Cellular and Gene Expression Profiles

Affiliations

Long-Term Human Immune Reconstitution, T-Cell Development, and Immune Reactivity in Mice Lacking the Murine Major Histocompatibility Complex: Validation with Cellular and Gene Expression Profiles

Milita Darguzyte et al. Cells. .

Abstract

Background: Humanized mice transplanted with CD34+ hematopoietic cells (HPCs) are broadly used to study human immune responses and infections in vivo and for testing therapies pre-clinically. However, until now, it was not clear whether interactions between the mouse major histocompatibility complexes (MHCs) and/or the human leukocyte antigens (HLAs) were necessary for human T-cell development and immune reactivity.

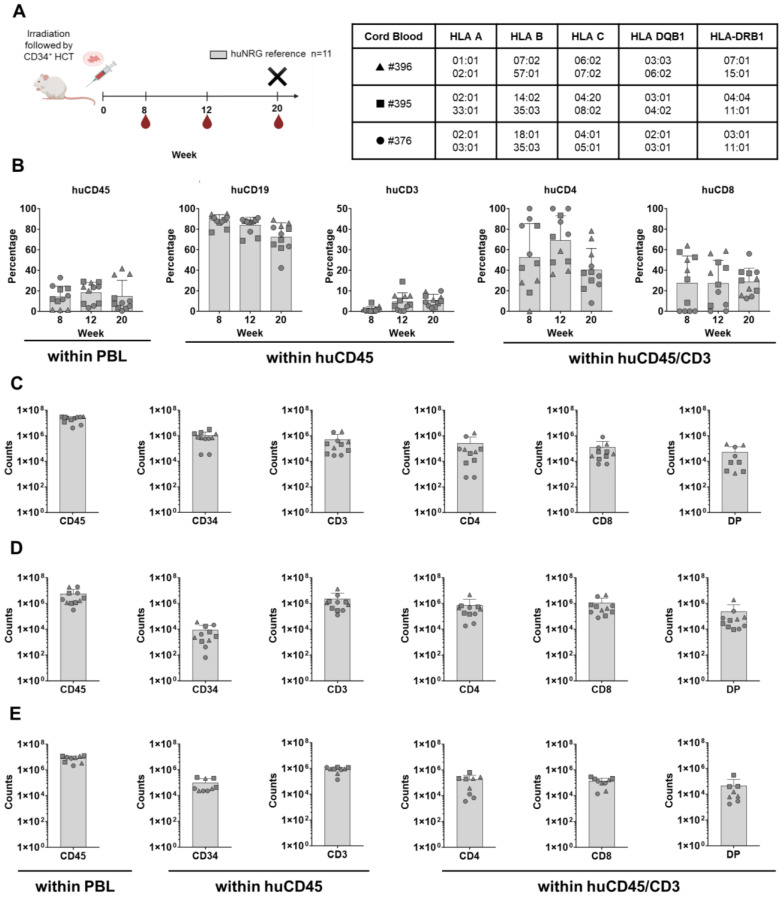
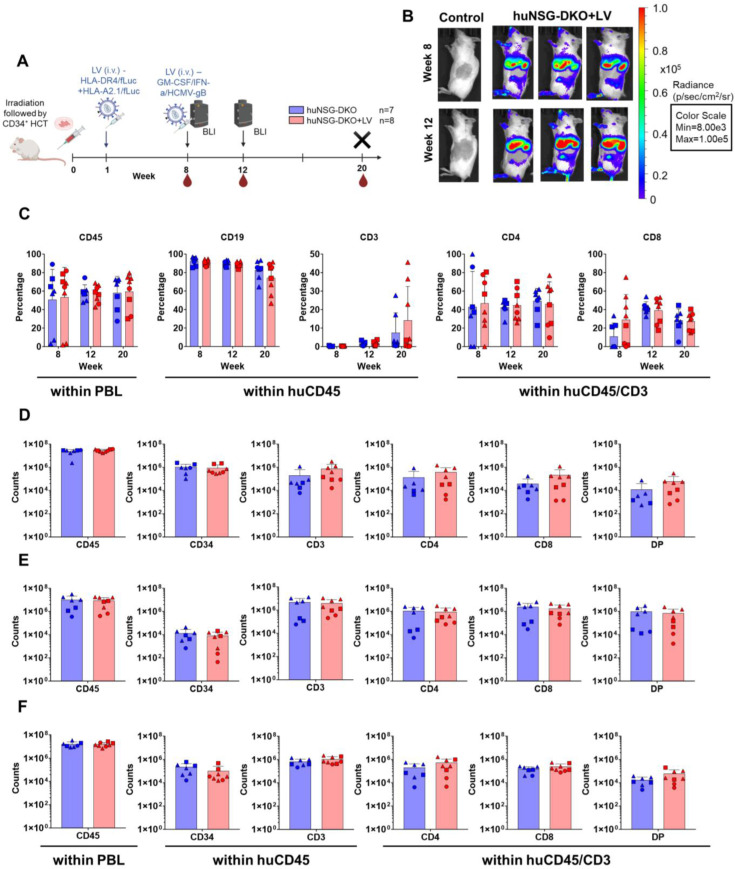
Methods: We evaluated the long-term (20-week) human hematopoiesis and human T-cell development in NOD Scid Gamma (NSG) mice lacking the expression of MHC class I and II (NSG-DKO). Triplicate experiments were performed with HPCs obtained from three donors, and humanization was confirmed in the reference strain NOD Rag Gamma (NRG). Further, we tested whether humanized NSG-DKO mice would respond to a lentiviral vector (LV) systemic delivery of HLA-A*02:01, HLA-DRB1*04:01, human GM-CSF/IFN-α, and the human cytomegalovirus gB antigen.

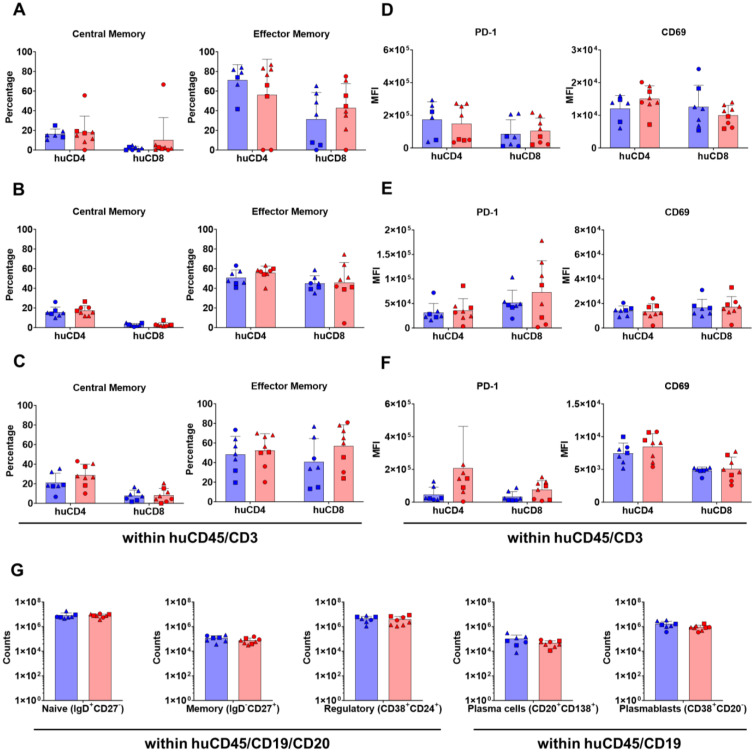
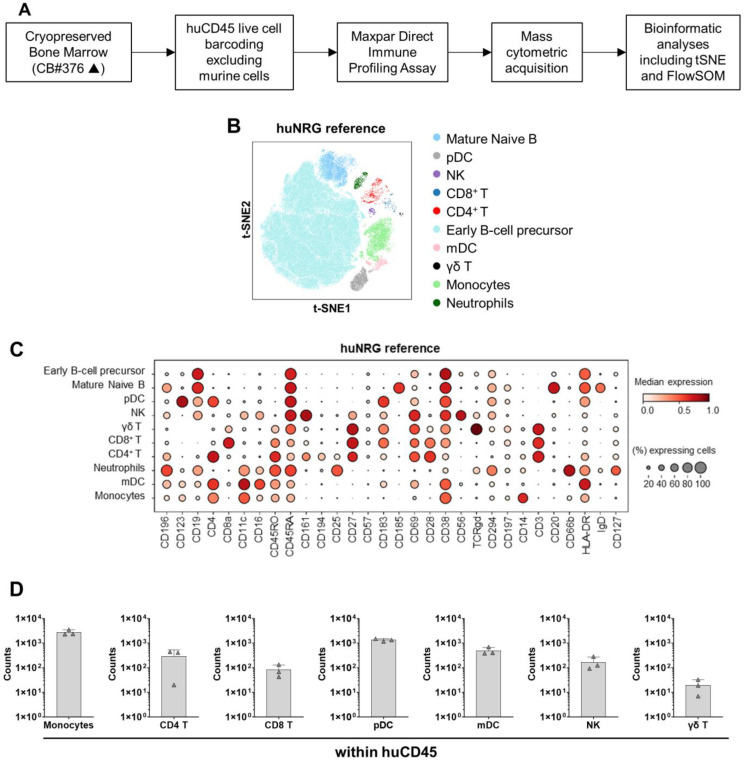
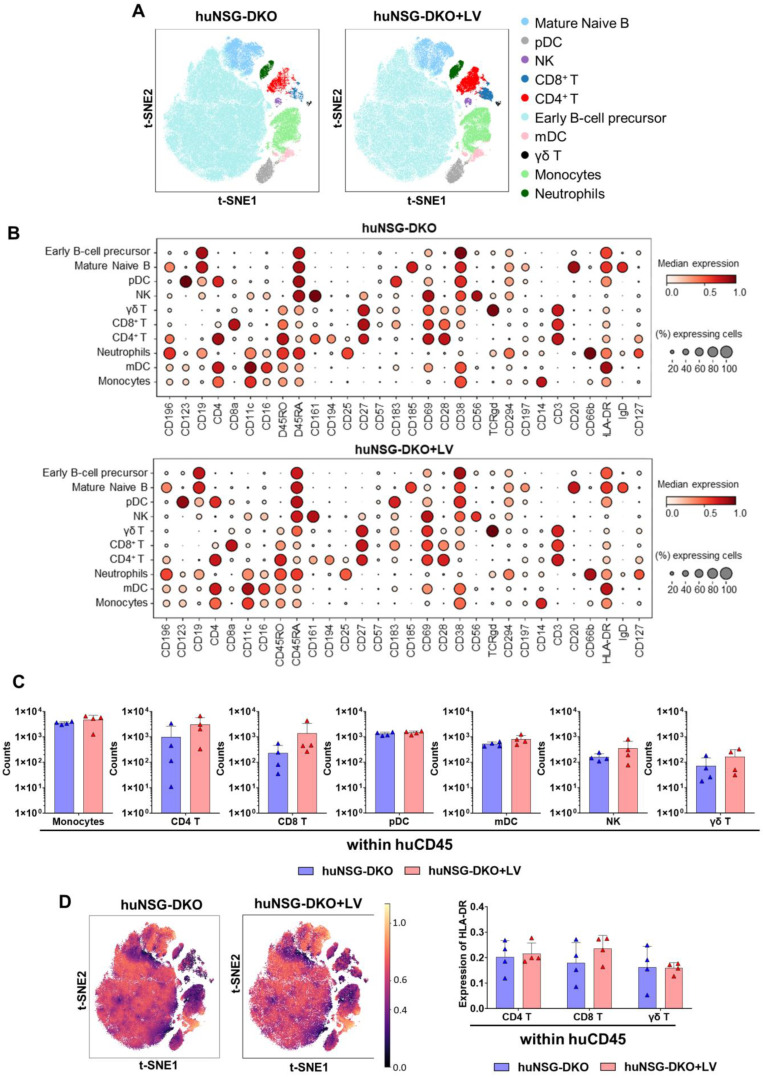
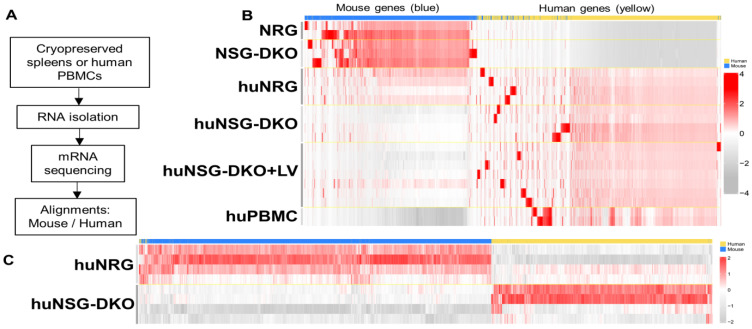
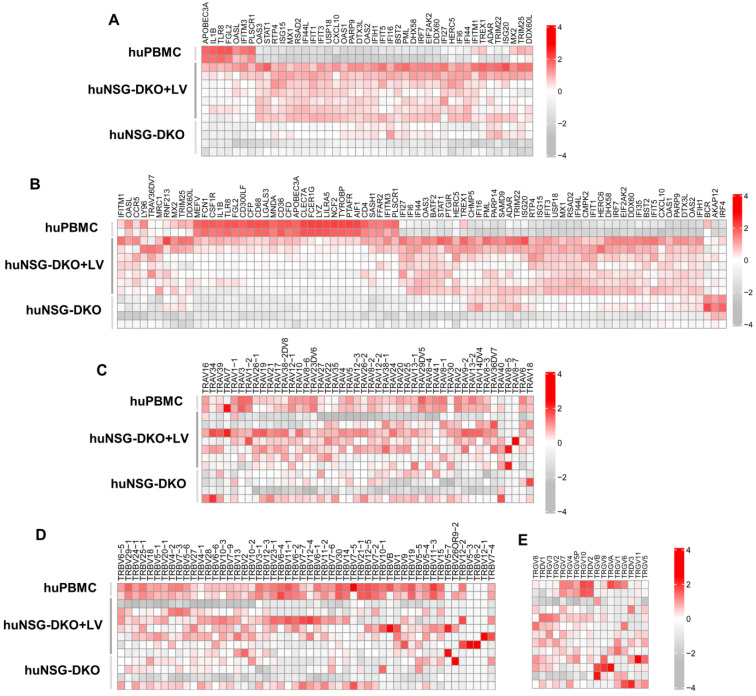
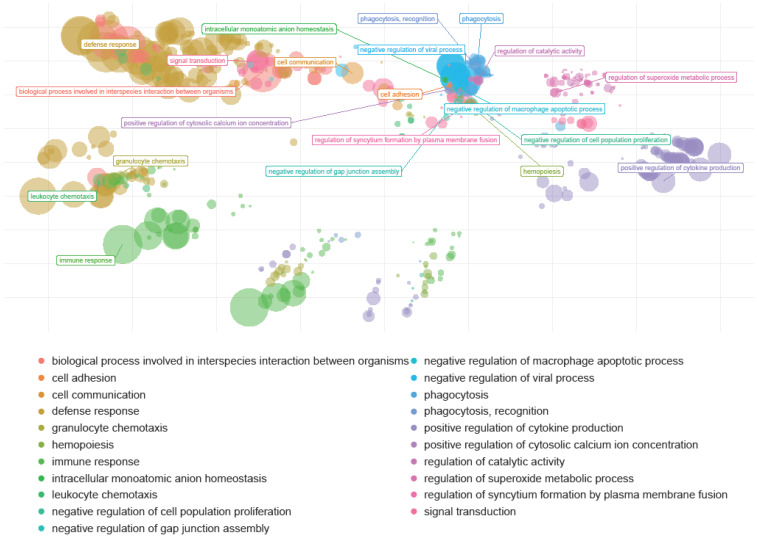
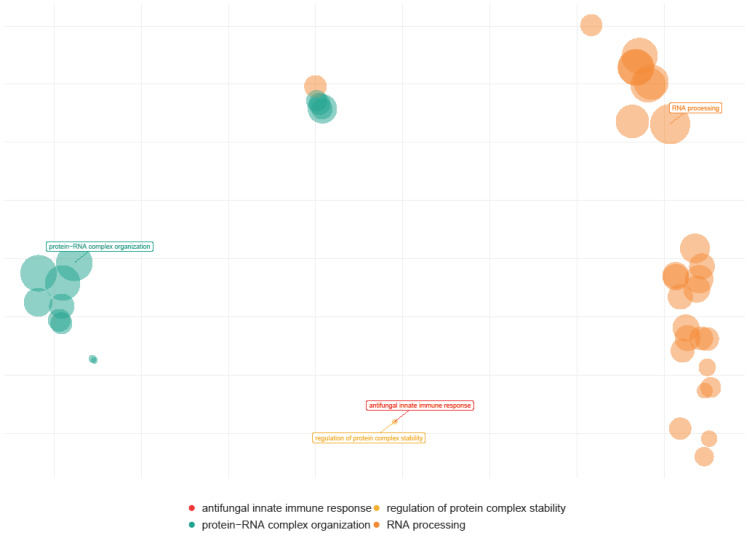
Results: Human immune reconstitution was detectable in peripheral blood from 8 to 20 weeks after the transplantation of NSG-DKO. Human single positive CD4+ and CD8+ T-cells were detectable in lymphatic tissues (thymus, bone marrow, and spleen). LV delivery harnessed the detection of lymphocyte subsets in bone marrow (αβ and γδ T-cells and NK cells) and the expression of HLA-DR. Furthermore, RNA sequencing showed that LV delivery increased the expression of different human reactome pathways, such as defense responses to other organisms and viruses.

Conclusions: Human T-cell development and reactivity are independent of the expression of murine MHCs in humanized mice. Therefore, humanized NSG-DKO is a promising new model for studying human immune responses, as it abrogates the xenograft mouse MHC interference.

Keywords: HLA; IFN; MHC; NSG; T-cell; humanized mice; immunization; lentivirus; stem cell transplantation.


Conflict of interest statement

R.S. received honoraria for participating and organizing conferences with The Jackson Laboratory, a not-for-profit organization commercializing the mouse strains used in these studies. L.S. and B.S. are employees of The Jackson Laboratory. The other authors declare no conflicts of interest.

Figures

Figure 1
Figure 1
Human hematopoietic engraftment and T-cell development in humanized NRG mice used as a reference strain. (A) Scheme of experiments: CD34+ stem cell transplantation (HCT) i.v. after irradiation, blood collection (BL), and termination (X). The humanized mice were humanized with three different CB donors: #396 (depicted as a triangle), #395 (depicted as a square), and #376 (depicted as a circle). Both female and male mice were used in this experiment (details in Table S1). Created in BioRender. Lab, S. (2024) BioRender.com/x52w302. (B) Blood analyses at weeks 8, 12, and 20 after HCT and longitudinal quantification of cells expressing huCD45, huCD34, huCD19, huCD3, huCD4, and huCD8 (in percentages). (C) Bone-marrow analyses showing the quantification of cells expressing huCD45, huCD34, huCD3, huCD4, huCD8, and double positive (DP) (in absolute cell counts, log scale). (D) Thymus analyses and the quantification of cells expressing huCD45, huCD34, huCD3, huCD4, huCD8, and DP (in absolute cell counts, log scale). (E) Spleen analyses and quantification of cells expressing huCD45, huCD34, huCD3, huCD4, huCD8, and DP (in absolute cell counts, log scale).
Figure 2
Figure 2
Human hematopoietic engraftment and T-cell development in humanized NSG-DKO mice. (A) Scheme of experiments: CD34+ stem-cell transplantation (HCT) i.v. after irradiation, lentivirus (LV) immunization i.v., bioluminescence imaging (BLI) analyses, blood collections (BL), and termination (X). Created in BioRender. Lab, S. (2024) BioRender.com/y83d419; (B) full-body BLI quantified as photons/second (p/s) at 8 or 12 weeks post-HCT of huNSG-DKO control (representative of one mouse) or after LV administration (representative of three mice). (C) Blood analyses at weeks 8, 12, and 20 after HCT and longitudinal quantification of cells expressing huCD45, huCD19, huCD3, huCD4, and huCD8 (in percentages). (D) Bone marrow analyses showing the quantification of cells expressing huCD45, huCD34, huCD3, huCD4, huCD8, and DP (in absolute cell counts, log scale). (E) Thymus analyses and quantification of cells expressing huCD45, huCD34, huCD3, huCD4, huCD8, and DP (in absolute cell counts, log scale). (F) Spleen analyses and quantification of cells expressing huCD45, huCD34, huCD3, huCD4, huCD8, and DP (in absolute cell counts, log scale).
Figure 3
Figure 3
Human T-cell and B-cell maturation and activation in huNSG-DKO mice. (A) Analysis of central memory and effector memory T-cell subtypes within huCD4+ and huCD8+ T-cells in bone marrow (in percentages). (B) Analysis of central memory and effector memory T-cell subtypes within huCD4+ and huCD8+ T-cells in thymus (in percentages). (C) Analysis of central memory and effector memory T-cell subtypes within huCD4+ and huCD8+ T-cells in spleen (in percentages). (D) Analysis of T-cell activation markers PD-1 and CD69 within huCD4+ and huCD8+ T-cells in bone marrow (in absolute numbers, log scale). (E) Analysis of T-cell activation markers PD-1 and CD69 within huCD4+ and huCD8+ T-cells in thymus (in absolute numbers, log scale). (F) Analysis of T-cell activation markers PD-1 and CD69 within huCD4+ and huCD8+ T-cells in spleen (in absolute numbers, log scale). (G) Analysis of B-cell subtypes in spleens. B-cell subtypes: naïve, memory, regulatory, plasma cells, and plasmablasts (in absolute cell counts, log scale).
Figure 4
Figure 4
CyTOF analysis of huNRG mice as a reference. (A) Scheme of sample preparation, staining, CyTOF measurement, and analysis of bone marrow samples. The mice were humanized using only one donor (CB #376). (B) Anti-human CD45-CD live cell barcoded analysis of immune cell types in bone marrow samples 20 weeks post-HCT. A total of 152,755 cells were analyzed for huNRG mice. t-SNE plots displaying different subtypes of human immune cells clustered using FlowSOM and annotated manually using the lineage markers presented in the dot plot below. (C) Dotplot of huNRG cell subtypes and their expression of different Maxpar Direct Immune Profiling lineage markers. The dot size corresponds to the fraction of cells expressing the indicated marker within each cell type, and the color indicates the median expression. (D) CyTOF analysis of monocytes, CD4+, CD8+, and γδ T-cells, and natural killer, myeloid, and plasmacytoid dendritic cell counts in bone marrow samples (in absolute cell numbers, log scale).
Figure 5
Figure 5
CyTOF analysis of huNSG-DKO mice. LV delivery promotes T-cell reactivity in humanized NSG-DKO mice. (A) Anti-human CD45-CD live cell barcoded analysis of immune cell types in bone marrow samples 20 weeks post-HCT. A total of 185,888 cells and 160,343 cells were analyzed for huNSG-DKO and huNSG-DKO+LV, respectively. t-SNE plots displaying different subtypes of human immune cells clustered using FlowSOM and annotated manually using the lineage markers presented in the dot plot (panels below). (B) Dotplot of huNSG-DKO and huNSG-DKO+LV cell subtypes and their expression of different Maxpar Direct Immune Profiling lineage markers. The dot size corresponds to the fraction of cells expressing the indicated marker within each cell type, and the color indicates the median expression. (C) CyTOF analysis of CD4+, CD8+, and γδ T-cells and natural killer, monocytes, myeloid, and plasmacytoid dendritic cell counts in bone marrow samples (in absolute cell numbers, log scale). (D) On right side: overlay of HLA-DR expression on t-SNE embeddings of huNSG-DKO and huNSG-DKO+LV across various cell types, as depicted in panel A. On left side: HLA-DR expression in CD4+, CD8+, and γδ T-cells (in absolute numbers).
Figure 6
Figure 6
Humanized NSG-DKO mice showed better humanization than huNRG mice that were used as a reference. (A) Scheme of sample preparation, RNA isolation, mRNA sequencing, and analysis of spleen samples. (B) Alignment of mouse (blue) versus human (yellow) genes. As expected, non-humanized NRG and NSG-DKO mice have higher frequencies of mouse upregulated transcripts than humanized mice and PBMCs. HuNRG mice still upregulate some mouse genes, while in comparison, huNSG-DKO mice do not. (C) Differentially expressed genes between humanized NRG and NSG-DKO mice. Higher frequencies of mouse transcripts are seen in huNRG, while huNSG-DKO upregulate more human genes.
Figure 7
Figure 7
Humanized NSG-DKO mice show upregulation of several biomarkers of immune responses after LV delivery. (A) Genes responsible for defense response to viruses are upregulated in huNSG-DKO+LV. (B) Genes responsible for response to other organism are upregulated in huNSG-DKO+LV. (C) Recombinations in T-cell-receptor A-variable chain are polyclonal and more frequent in huNSG-DKO+LV. (D) Recombinations in T-cell-receptor B-variable chain are polyclonal and more frequent in huNSG-DKO+LV. (E) Recombinations in T-cell-receptor G- and D-variable chains are polyclonal and more frequent in huNSG-DKO+LV.
Figure 8
Figure 8
Human genome pathways upregulated in huNSG-DKO + LV in comparison to huNSG-DKO mice. Humanized NSG-DKO mice show the activation of several immune (immune response, defense response, and myeloid leukocyte activation) pathways after LV delivery. The sizes of the bubbles represent their relevance.
Figure 9
Figure 9
Mouse genome pathways upregulated in huNSG-DKO + LV in comparison to huNSG-DKO mice. LV delivery upregulates RNA-processing pathways within a mouse. The sizes of the bubbles represent their relevance.

References

    1. Götze D., Burger R. The Major Histocompatibility Complex. In: Bier O.G., Dias Da Silva W., Götze D., Mota I., editors. Fundamentals of Immunology. Springer; Berlin/Heidelberg, Germany: 1986. pp. 139–178.
    1. Thorsby E. A Short History of HLA. Tissue Antigens. 2009;74:101–116. doi: 10.1111/j.1399-0039.2009.01291.x. - DOI - PubMed
    1. Granot N., Storb R. History of Hematopoietic Cell Transplantation: Challenges and Progress. Haematologica. 2020;105:2716–2729. doi: 10.3324/haematol.2019.245688. - DOI - PMC - PubMed
    1. Anjos-Afonso F., Bonnet D. Human CD34+ Hematopoietic Stem Cell Hierarchy: How Far Are We with Its Delineation at the Most Primitive Level? Blood. 2023;142:509–518. doi: 10.1182/blood.2022018071. - DOI - PMC - PubMed
    1. Ishikawa F., Yasukawa M., Lyons B., Yoshida S., Miyamoto T., Yoshimoto G., Watanabe T., Akashi K., Shultz L.D., Harada M. Development of Functional Human Blood and Immune Systems in NOD/SCID/IL2 Receptor γ Chain(Null) Mice. Blood. 2005;106:1565–1573. doi: 10.1182/blood-2005-02-0516. - DOI - PMC - PubMed

Publication types

LinkOut - more resources