. 2024 Oct 9;11(10):1006.
doi: 10.3390/bioengineering11101006.

The Diagnostic Value of bpMRI in Prostate Cancer: Benefits and Limitations Compared to mpMRI

Affiliations

The Diagnostic Value of bpMRI in Prostate Cancer: Benefits and Limitations Compared to mpMRI

Roxana Iacob et al. Bioengineering (Basel). .

Abstract

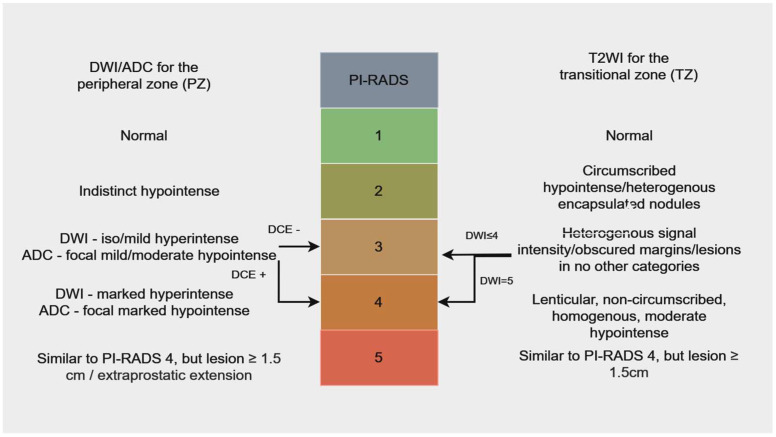
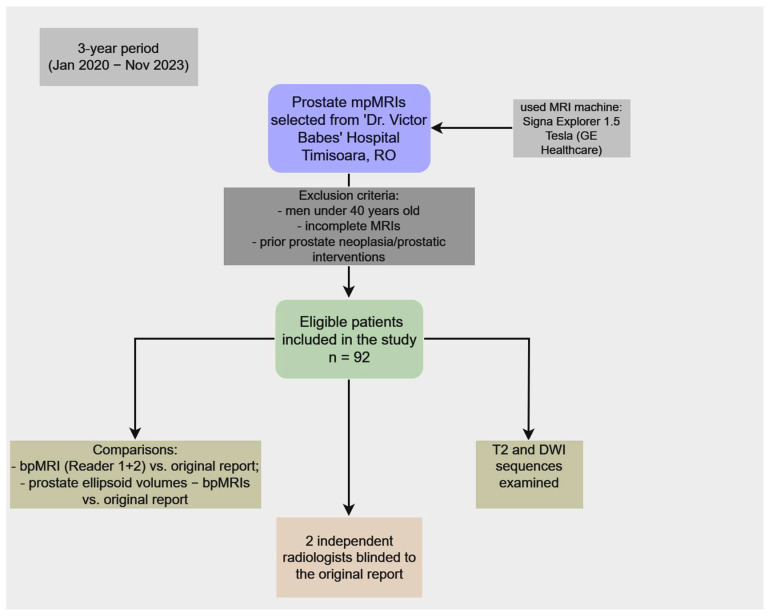
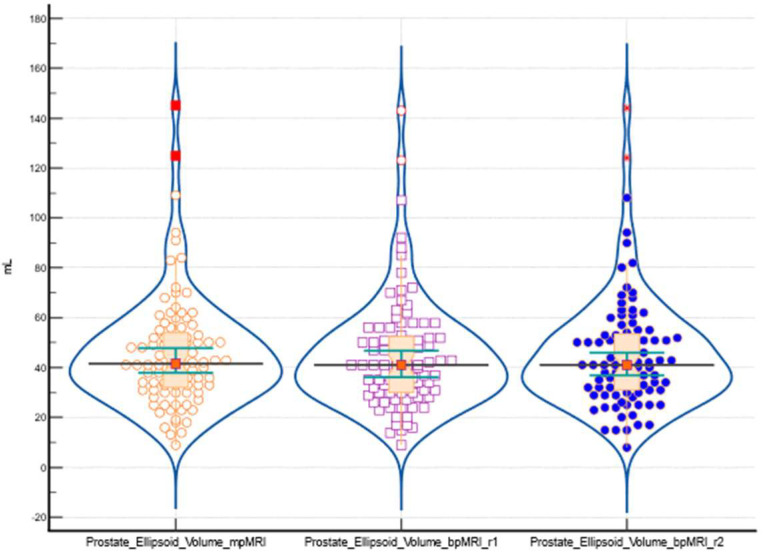
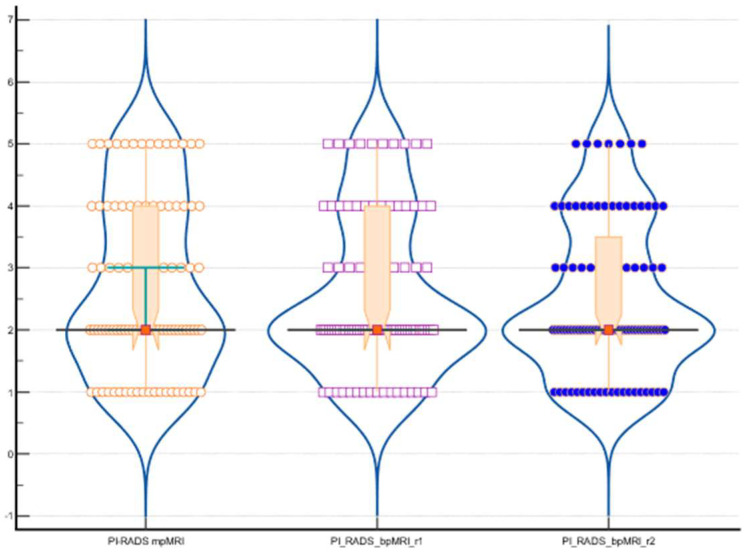
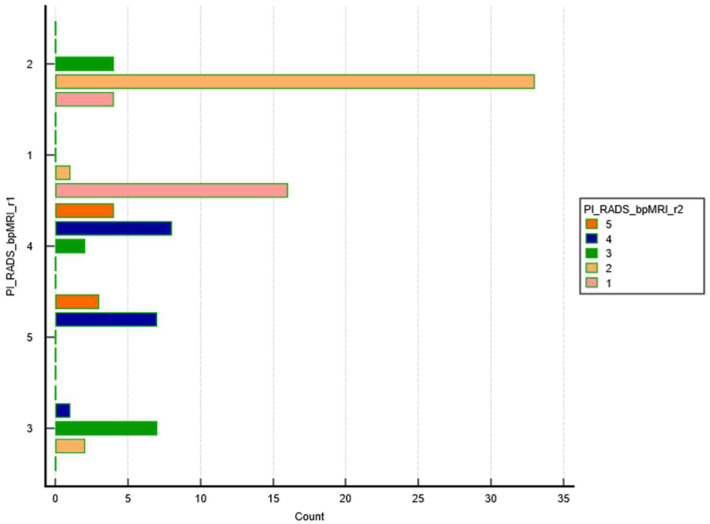
Prostate cancer is the second most common cancer in men and a leading cause of death worldwide. Early detection is vital, as it often presents with vague symptoms such as nocturia and poor urinary stream. Diagnostic tools like PSA tests, ultrasound, PET-CT, and mpMRI are essential for prostate cancer management. The PI-RADS system helps assess malignancy risk based on imaging. While mpMRI, which includes T1, T2, DWI, and dynamic contrast-enhanced imaging (DCE), is the standard, bpMRI offers a contrast-free alternative using only T2 and DWI. This reduces costs, acquisition time, and the risk of contrast-related side effects but has limitations in detecting higher-risk PI-RADS 3 and 4 lesions. This study compared bpMRI's diagnostic accuracy to mpMRI, focusing on prostate volume and PI-RADS scoring. Both methods showed strong inter-rater agreement for prostate volume (ICC 0.9963), confirming bpMRI's reliability in this aspect. However, mpMRI detected more complex conditions, such as periprostatic fat infiltration and iliac lymphadenopathy, which bpMRI missed. While bpMRI offers advantages like reduced cost and no contrast use, it is less effective for higher-risk lesions, making mpMRI more comprehensive.

Keywords: bpMRI; mpMRI; prostate cancer diagnosis; prostate cancer imaging; prostate volume assessment.


Conflict of interest statement

The authors declare no conflicts of interest.

Figures

Figure 1
Figure 1
PI−RADS v2 for mpMRI, adapted from Lo et al. [9]—Colors were used to differentiate various prostate conditions, with green representing the normal prostate, which has a very low cancer risk. Benign lesions, with low to intermediate cancer risk, were indicated by a darker shade of green and a bright shade of orange. High-risk lesions were marked in dark orange, while red signified lesions with a very high likelihood of being malignant.
Figure 2
Figure 2
Anatomy of the prostate, adapted by Radiology Assistant [20]—zones (a)—base, (b)—middle segment, (c)—apex. AS—anterior fibromuscular stroma; TZ(a/p)—anterior and posterior transition zone; PZ(a/m)—anterior and posterior peripheric zone; PZm—the right and left posteromedial peripheral zone.
Figure 3
Figure 3
Flowchart illustrating the design of our study.
Figure 4
Figure 4
The distribution of prostate ellipsoid volume measured using both mpMRI and bpMRI using a combination of violin plots, box plots, and individual data points. Each violin plot represents the density of the data within the respective group, with wider sections indicating a higher concentration of values. Overlaid within each violin is a box plot, highlighting the IQR, with a central line denoting the median value and whiskers extending to capture the spread of the data. Outliers are visible as individual points outside the whiskers. In addition to these visual summaries, individual data points are superimposed on the plot, represented by orange circles for the first group, purple squares for the second group, and blue dots for the third group.
Figure 5
Figure 5
The distribution of PI-RADS using both mpMRI and bpMRI using a combination of violin plots, box plots, and individual data points. Each violin plot represents the density of the data within the respective group, with wider sections indicating a higher concentration of values. Overlaid within each violin is a box plot, highlighting the IQR, with a central line denoting the median value and whiskers extending to capture the spread of the data. Outliers are visible as individual points outside the whiskers. In addition to these visual summaries, individual data points are superimposed on the plot, represented by orange circles for the first group, purple squares for the second group, and blue dots for the third group.
Figure 6
Figure 6
The graph illustrates the distribution of PI-RADS scores as assessed by Readers 1 and 2 using bpMRI (biparametric MRI). The y-axis lists the different PI-RADS categories (from 1 to 5), while the x-axis represents the frequency of cases in each category. Each color in the bar represents a specific PI-RADS score: pink for PI-RADS 1, yellow for PI-RADS 2, green for PI-RADS 3, blue for PI-RADS 4, orange for PI-RADS 5.
Figure 7
Figure 7
T2 and DWI sequences, showing an uncircumscribed lesion, with restricted diffusion, localized in the anterior transitional zone (left)—yellow arrow. The lesion was scored PI-RADS 5 by all of the radiologists.
Figure 8
Figure 8
T2 and DWI sequences of a prostate MRI, showing a lenticular lesion, uncircumscribed, with T2 hyposignal and restricted diffusion, localized in the transitional left zone, with peripheric extension—scored PI-RADS 5 (green arrow).

Similar articles

References

    1. Rawla P. Epidemiology of Prostate Cancer. World J. Oncol. 2019;10:63–89. doi: 10.14740/wjon1191. - DOI - PMC - PubMed
    1. Merriel S.W.D., Funston G., Hamilton W. Prostate Cancer in Primary Care. Adv. Ther. 2018;35:1285–1294. doi: 10.1007/s12325-018-0766-1. - DOI - PMC - PubMed
    1. Sekhoacha M., Riet K., Motloung P., Gumenku L., Adegoke A., Mashele S. Prostate Cancer Review: Genetics, Diagnosis, Treatment Options, and Alternative Approaches. Molecules. 2022;27:5730. doi: 10.3390/molecules27175730. - DOI - PMC - PubMed
    1. Ang M., Rajcic B., Foreman D., Moretti K., O’Callaghan M.E. Men Presenting with Prostate-specific Antigen (PSA) Values of over 100 Ng/mL. BJU Int. 2016;117:68–75. doi: 10.1111/bju.13411. - DOI - PubMed
    1. Nepal A., Sharma P., Bhattarai S., Mahajan Z., Sharma A., Sapkota A., Sharma A. Extremely Elevated Prostate-Specific Antigen in Acute Prostatitis: A Case Report. Cureus. 2023;15:e43730. doi: 10.7759/cureus.43730. - DOI - PMC - PubMed

LinkOut - more resources