. 2024 Sep 27;46(10):10896-10912.
doi: 10.3390/cimb46100647.

Microgravity as a Tool to Investigate Cancer Induction in Pleura Mesothelial Cells

Affiliations

Microgravity as a Tool to Investigate Cancer Induction in Pleura Mesothelial Cells

Valentina Bonetto et al. Curr Issues Mol Biol. .

Abstract

The present work shows that the exposure of mesothelial cells to simulated microgravity changes their cytoskeleton and adhesion proteins, leading to a cell switch from normal towards tumoral cells. Immunohistochemical and molecular data were obtained from both MeT-5A exposed to simulated microgravity and BR95 mesothelioma cell lines. Simulated microgravity was found to affect the expression of actin, vinculin, and connexin-43, altering their quantitative and spatial distribution pattern inside the cell. The analysis of the tumoral markers p27, CD44, Fibulin-3, and NANOG and the expression of genes related to cancer transformation such as NANOG, CDH-1, and Zeb-1 showed that the simulated microgravity environment led to expression patterns in MeT-5A cells similar to those observed in BR95 cells. The alteration in both quantitative expression and structural organization of the cytoskeleton and adhesion/communication proteins can thus be considered a pivotal mechanism involved in the cellular shift towards tumoral progression.

Keywords: BR95 cells; Fibulin-3; MeT-5A cells; NANOG; connexin-43; focal contacts; mesothelioma.


Conflict of interest statement

The authors declare no conflicts of interest. The funders had no role in the design of the study; in the collection, analyses, or interpretation of data; in the writing of the manuscript; or in the decision to publish the results.

Figures

Figure 1
Figure 1
Microphotograph panel illustrating the immunofluorescence localization of α-Tubulin in MeT5A cells (A,B) in their agglomerate (CLUMP) disposition (C) and BR95 cells (D), following normogravity (A) or microgravity at 48 h (B,C). The quantitative expression of several proteins analyzed is shown in the bar-graph and western blot panel. Calibration bar = 20 µm. No statistical difference detected. N = 3.
Figure 2
Figure 2
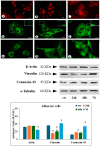
Microphotograph panel illustrating the immunofluorescence localization of Actin (AC), Vinculin (DF), and connexin-43 (GI) in adherent MeT5A cells, following normogravity (A,D,G) or microgravity at 48 h (B,E,H) and 7 days (C,F,I). In (DF), the frame shows the observed focal contacts in high detail. The quantitative expression of several proteins is shown in the bar-graph and western blot panel. Calibration bar = 20 µm. a = p < 0.05 vs. ctr; b = p < 0.05 vs. 24 h; * = p < 0.05 vs. other experimental groups. N = 3.
Figure 3
Figure 3
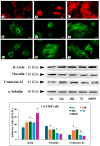
Microphotograph panel illustrating the immunofluorescence localization of Actin (AC), Vinculin (DF), and connexin-43 (GI) in adherent MeT5A cells (A,D,G) in their agglomerate (CLUMP) disposition (B,E,H) and adherent BR95 cells (C,F,I), following normogravity (A,D,G) or microgravity at 7 days (B,E,H). The quantitative expression of several proteins analyzed is shown in the bar-graph and western blot panel. Calibration bar = 20 µm. a = p < 0.05 vs. ctr; b = p < 0.05 vs. 24 h; * = p < 0.05 vs. other experimental groups. N = 3.
Figure 4
Figure 4
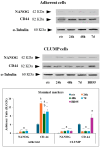
Panel illustrating the expression of several proteins analyzed in adherent MeT5A cells. The quantitative expression of several proteins analyzed is shown in the bar-graph. a = p < 0.05 vs. ctr; b = p < 0.05 vs. 24 h; * = p < 0.05 vs. other experimental groups. N = 3.
Figure 5
Figure 5
Panel illustrating the expression of several proteins analyzed in MeT5A cells in their (CLUMP) disposition. The quantitative expression of several proteins analyzed is shown in the bar-graph. a = p < 0.05 vs. ctr; b = p < 0.05 vs. 24 h; c = p < 0.05 vs. 48 h; * = p < 0.05 vs. other experimental groups. N = 3.
Figure 6
Figure 6
Bar-graph illustrating the expression of several gene analyzed in MeT5A cells in their (CLUMP) disposition, following normogravity or microgravity application and in adherent BR95 cells. a = p < 0.05 vs. ctr; b = p < 0.05 vs. 24 h; c = p < 0.05 vs. 48 h; * = p < 0.05 vs. other experimental groups. N = 3.

References

    1. De Visser K.E., Joyce J.A. The evolving tumor microenvironment: From cancer initiation to metastatic outgrowth. Cancer Cell. 2023;41:374–403. doi: 10.1016/j.ccell.2023.02.016. - DOI - PubMed
    1. Fife C.M., McCarroll J.A., Kavallaris M. Movers and shakers: Cell cytoskeleton in cancer metastasis. Br. J. Pharmacol. 2014;171:5507–5523. doi: 10.1111/bph.12704. Erratum in Br. J. Pharmacol. 2017, 174, 116. - DOI - PMC - PubMed
    1. Guadamillas M.C., Cerezo A., del Pozo M.A. Overcoming anoikis–pathways to anchorage-independent growth in cancer. J. Cell Sci. 2011;124:3189–3197. doi: 10.1242/jcs.072165. - DOI - PubMed
    1. Adeshakin F.O., Adeshakin A.O., Afolabi L.O., Yan D., Zhang G., Wan X. Mechanisms for Modulating Anoikis Resistance in Cancer and the Relevance of Metabolic Reprogramming. Front. Oncol. 2021;11:626577. doi: 10.3389/fonc.2021.626577. - DOI - PMC - PubMed
    1. White S.R., Williams P., Wojcik K.R., Sun S., Hiemstra P.S., Rabe K.F., Dorscheid D.R. Initiation of apoptosis by actin cytoskeletal derangement in human airway epithelial cells. Am. J. Respir. Cell Mol. Biol. 2001;24:282–294. doi: 10.1165/ajrcmb.24.3.3995. - DOI - PubMed

LinkOut - more resources