. 2024 Oct 18;14(20):2322.
doi: 10.3390/diagnostics14202322.

Machine Learning Diagnostic Model for Early Stage NSTEMI: Using hs-cTnI 1/2h Changes and Multiple Cardiovascular Biomarkers

Affiliations

Machine Learning Diagnostic Model for Early Stage NSTEMI: Using hs-cTnI 1/2h Changes and Multiple Cardiovascular Biomarkers

Junyi Wu et al. Diagnostics (Basel). .

Abstract

Background: This study demonstrates differences in the distribution of multiple cardiovascular biomarkers between non-ST-segment elevation myocardial infarction (NSTEMI) and unstable angina (UA) patients. Diagnostic machine learning predictive models measured at the time of admission and 1/2 h post-admission, achieving competitive diagnostic predictive results.

Objective: This study aims to explore the diagnostic value of changes in high-sensitivity cardiac troponin I (hs-cTnI) levels in patients with suspected NSTEMI.

Methods: A total of 267 patients presented with chest pain, requiring confirmation of acute coronary syndrome (ACS) subtypes (NSTEMI vs. UA). Hs-cTnI and other cardiac markers, such as creatine kinase-MB (CK-MB) and Myoglobin (Myo), were analyzed. Machine learning techniques were employed to assess the application of hs-cTnI level changes in the clinical diagnosis of NSTEMI.

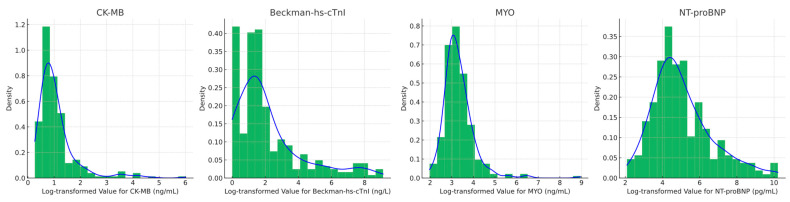
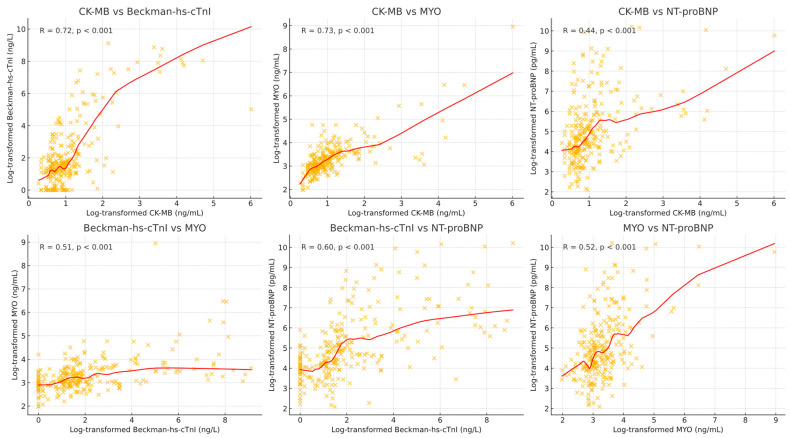
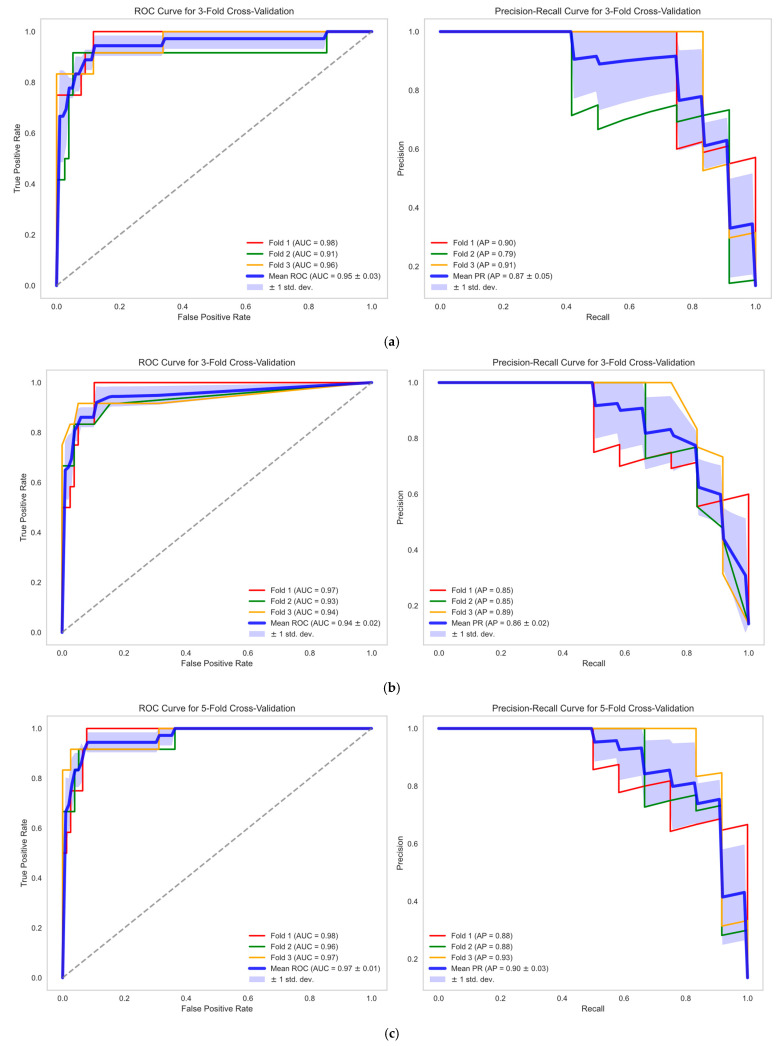
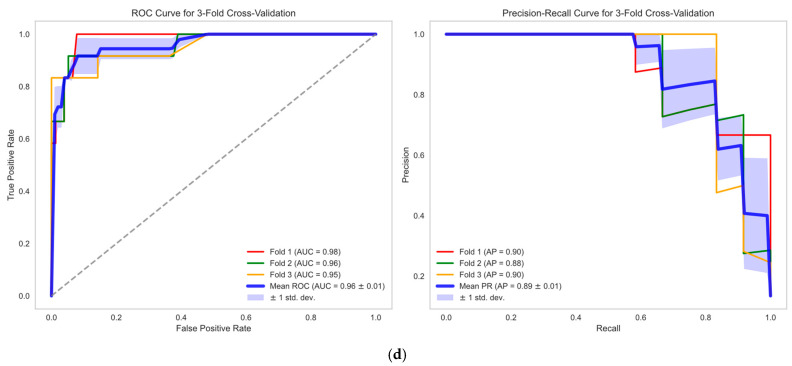
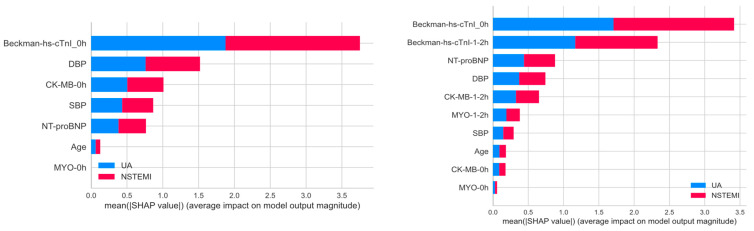
Results: Levels of CK-MB, Myo, hs-cTnI measured at admission, hs-cTnI measured 1-2 h after admission, and NT-proBNP in NSTEMI patients were significantly higher than those in UA patients (p < 0.001). There was a positive correlation between hs-cTnI and CK-MB, as well as Myo (R = 0.72, R = 0.51, R = 0.60). The optimal diagnostic model, Hybiome_1/2h, demonstrated an F1-Score of 0.74, an AUROC of 0.96, and an AP of 0.89.

Conclusions: This study confirms the significant value of hs-cTnI as a sensitive marker of myocardial injury in the diagnosis of NSTEMI. Continuous monitoring of hs-cTnI levels enhances the accuracy of distinguishing NSTEMI from UA. The models indicate that the Hybiome hs-cTnI assays perform comparably well to the Beckman assays in predicting NSTEMI. Moreover, incorporating hs-cTnI measurements taken 1-2 h post-admission significantly enhances the model's effectiveness.

Keywords: NSTEMI; diagnostic model; machine learning.


Conflict of interest statement

The authors declare no conflicts of interest. The funders had no role in the design of the study; in the collection, analyses, or interpretation of data; in the writing of the manuscript; or in the decision to publish the results.

Figures

Figure 1
Figure 1
Distribution of log-transformed biomarker values at admission. Histograms represent the log-transformed values of the cardiac biomarkers CK-MB, Beckman-hs-cTnI, Myoglobin (MYO), and NT-proBNP measured at admission. The blue density line overlays the histogram, illustrating the probability distribution of each biomarker. The x-axis represents the log-transformed values, while the y-axis indicates the density.
Figure 2
Figure 2
Correlation plots between log-transformed cardiac biomarker values at admission. Scatter plots display pairwise correlations between the log-transformed values of CK-MB, Beckman-hs-cTnI, Myoglobin(MYO), and NT-proBNP at admission. The red line represents a locally weighted scatterplot smoothing (LOESS) fit, while the R values and p-values indicate the strength and significance of the correlation. Each plot shows a distinct relationship between two biomarkers, highlighting both linear and non-linear patterns of association across the dataset.
Figure 3
Figure 3
ROC and Precision–Recall curves for 3-fold cross-validation across (a) Beckman_0h, (b) Hybiome_0h, (c) Beckman_1/2h, and (d) Hybiome_1/2h models. ROC Curves (left panels): The blue line represents the mean ROC curve across the three folds, while the shaded area around the mean curve denotes the standard deviation (SD). This highlights the model’s consistency and reliability in distinguishing between classes across different subsets of data. The Area Under the Curve (AUC) values are also provided for each fold, with the overall mean AUC and its SD indicated, demonstrating the model’s discriminative power. Precision–Recall Curves (Right Panels): Like the ROC curves, the mean Precision–Recall curve is illustrated with a blue line, and the shaded region represents the standard deviation (SD). The Average Precision (AP) values for each fold are provided, alongside the mean AP and its SD.
Figure 3
Figure 3
ROC and Precision–Recall curves for 3-fold cross-validation across (a) Beckman_0h, (b) Hybiome_0h, (c) Beckman_1/2h, and (d) Hybiome_1/2h models. ROC Curves (left panels): The blue line represents the mean ROC curve across the three folds, while the shaded area around the mean curve denotes the standard deviation (SD). This highlights the model’s consistency and reliability in distinguishing between classes across different subsets of data. The Area Under the Curve (AUC) values are also provided for each fold, with the overall mean AUC and its SD indicated, demonstrating the model’s discriminative power. Precision–Recall Curves (Right Panels): Like the ROC curves, the mean Precision–Recall curve is illustrated with a blue line, and the shaded region represents the standard deviation (SD). The Average Precision (AP) values for each fold are provided, alongside the mean AP and its SD.
Figure 4
Figure 4
The bar plots display the mean absolute SHAP values of features calculated from models trained using clinical data to predict outcomes of UA and NSTEMI. The left plot represents the feature importance for the Beckman_0h model, while the right plot corresponds to the Beckman_1/2h model. Blue bars indicate the contribution to predicting UA, and red bars show the contribution to predicting NSTEMI.

Similar articles

Cited by

References

    1. Eisen A., Giugliano R.P., Braunwald E. Updates on Acute Coronary Syndrome: A Review. JAMA Cardiol. 2016;1:718–730. doi: 10.1001/jamacardio.2016.2049. - DOI - PubMed
    1. Bob-Manuel T., Ifedili I., Reed G., Ibebuogu U.N., Khouzam R.N. Non-ST Elevation Acute Coronary Syndromes: A Comprehensive Review. Curr. Probl. Cardiol. 2017;42:266–305. doi: 10.1016/j.cpcardiol.2017.04.006. - DOI - PubMed
    1. Bahadir S., Aydın S., Kantarci M., Unver E., Karavas E., Şenbil D.C. Triple Rule-out Computed Tomography Angiography: Evaluation of Acute Chest Pain in COVID-19 Patients in the Emergency Department. World J. Radiol. 2022;14:311–318. doi: 10.4329/wjr.v14.i8.311. - DOI - PMC - PubMed
    1. Bhatt D.L., Lopes R.D., Harrington R.A. Diagnosis and Treatment of Acute Coronary Syndromes. JAMA. 2022;327:662. doi: 10.1001/jama.2022.0358. - DOI - PubMed
    1. Chiang C.H., Chiang C.H., Pickering J.W., Stoyanov K.M., Chew D.P., Neumann J.T., Ojeda F., Sörensen N.A., Su K.Y., Kavsak P., et al. Performance of the European Society of Cardiology 0/1-Hour, 0/2-Hour, and 0/3-Hour Algorithms for Rapid Triage of Acute Myocardial Infarction: An International Collaborative Meta-Analysis. Ann. Intern. Med. 2022;175:101–113. doi: 10.7326/M21-1499. - DOI - PubMed

LinkOut - more resources