Review
. 2024 Oct 6;14(10):480.
doi: 10.3390/bios14100480.

Principles and Applications of ZnO Nanomaterials in Optical Biosensors and ZnO Nanomaterial-Enhanced Biodetection

Affiliations
Review

Principles and Applications of ZnO Nanomaterials in Optical Biosensors and ZnO Nanomaterial-Enhanced Biodetection

Marion Ryan C Sytu et al. Biosensors (Basel). .

Abstract

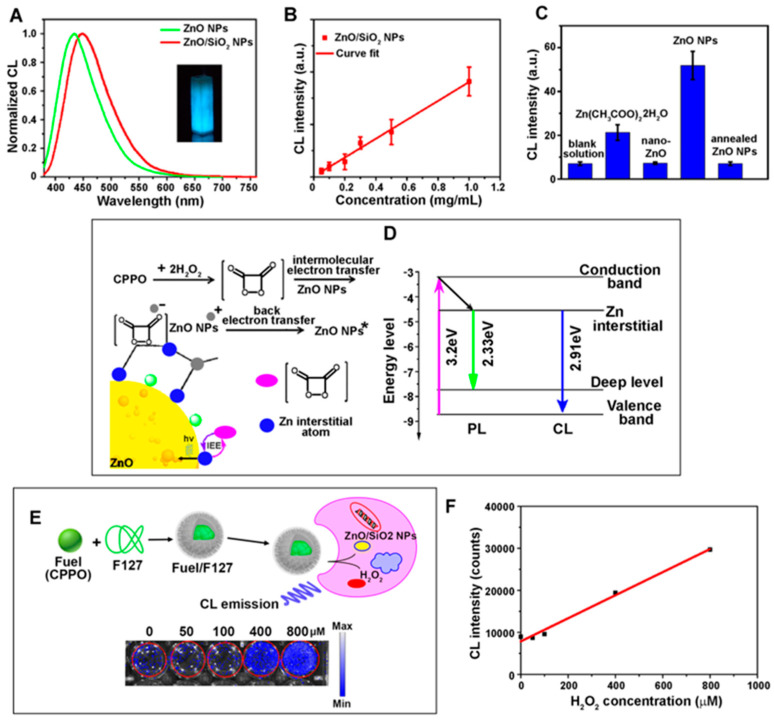
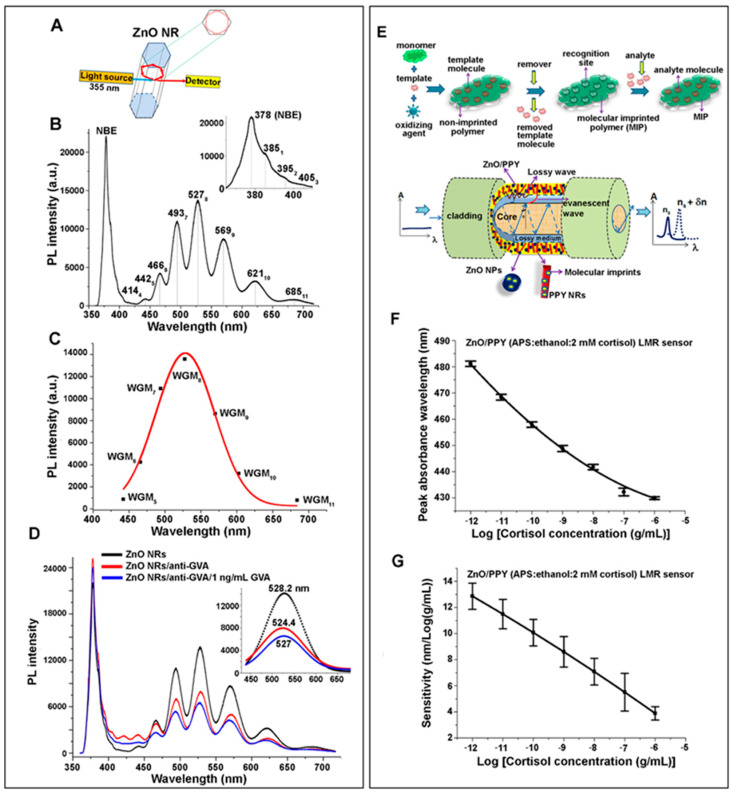
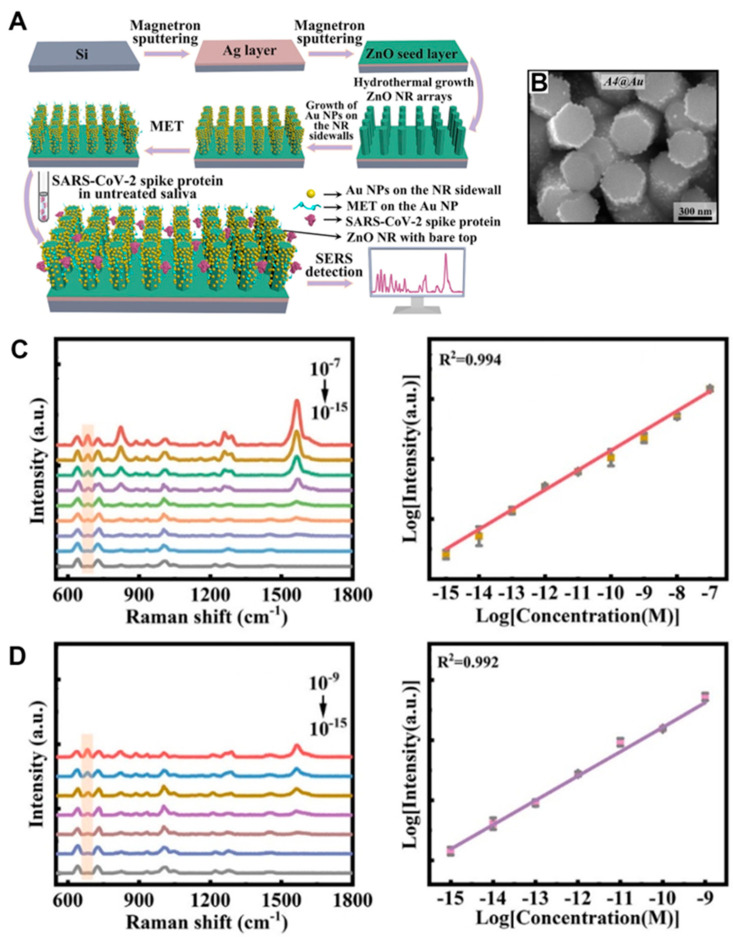
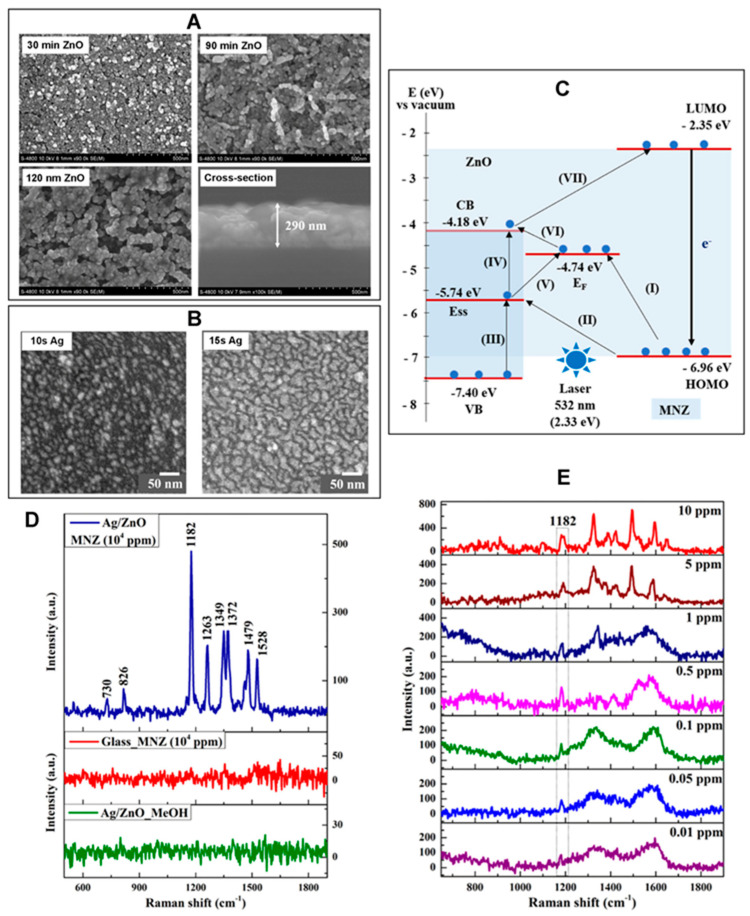
Significant research accomplishments have been made so far for the development and application of ZnO nanomaterials in enhanced optical biodetection. The unparalleled optical properties of ZnO nanomaterials and their reduced dimensionality have been successfully exploited to push the limits of conventional optical biosensors and optical biodetection platforms for a wide range of bioanalytes. ZnO nanomaterial-enabled advancements in optical biosensors have been demonstrated to improve key sensor performance characteristics such as the limit of detection and dynamic range. In addition, all nanomaterial forms of ZnO, ranging from 0-dimensional (0D) and 1D to 2D nanostructures, have been proven to be useful, ensuring their versatile fabrication into functional biosensors. The employment of ZnO as an essential biosensing element has been assessed not only for ensembles but also for individual nanomaterials, which is advantageous for the realization of high miniaturization and minimal invasiveness in biosensors and biodevices. Moreover, the nanomaterials' incorporations into biosensors have been shown to be useful and functional for a variety of optical detection modes, such as absorption, colorimetry, fluorescence, near-band-edge emission, deep-level emission, chemiluminescence, surface evanescent wave, whispering gallery mode, lossy-mode resonance, surface plasmon resonance, and surface-enhanced Raman scattering. The detection capabilities of these ZnO nanomaterial-based optical biosensors demonstrated so far are highly encouraging and, in some cases, permit quantitative analyses of ultra-trace level bioanalytes that cannot be measured by other means. Hence, steady research endeavors are expected in this burgeoning field, whose scientific and technological impacts will grow immensely in the future. This review provides a timely and much needed review of the research efforts made in the field of ZnO nanomaterial-based optical biosensors in a comprehensive and systematic manner. The topical discussions in this review are organized by the different modes of optical detection listed above and further grouped by the dimensionality of the ZnO nanostructures used in biosensors. Following an overview of a given optical detection mode, the unique properties of ZnO nanomaterials critical to enhanced biodetection are presented in detail. Subsequently, specific biosensing applications of ZnO nanomaterials are discussed for ~40 different bioanalytes, and the important roles that the ZnO nanomaterials play in bioanalyte detection are also identified.

Keywords: ZnO biosensors; ZnO nanomaterials; ZnO nanoparticles; ZnO nanorods; ZnO optical sensors; ZnO-enhanced biodetection; nanobiosensors; optical biodetection; optical biosensors.


Conflict of interest statement

The authors declare no conflicts of interest.

Figures

Figure 10
Figure 10
Exemplar uses of ZnO nanomaterials in both prism- and optical fiber-based SPR biosensors are presented. (A) The schematic diagram depicts a typical SPR detection setup involving a Kretschmann-type attenuated total reflection (ATR) attachment. C, H, and T indicate the flow cell, base thermistor, and hemicylinder prism, respectively. Adapted with permission from Ref. [173], copyright (2020) American Chemical Society. (B) The left plot is the SPR reflectance curves obtained from the platforms of air/Au/prism, air/ZnO/Au/prism, and air/ssDNA/ZnO/Au/prism used for the detection of N. meningitidis DNA. The plot on the right is the calibration curve created from the SPR curves of the air/ssDNA/ZnO/Au/prism platform upon ssDNA hybridization with different concentrations of complementary DNA. The interaction between the probe ssDNA with increasing concentrations of target DNA resulted in a continuous shift in SPR angle towards a higher angle. The SPR biosensor exhibited a linear response range of 10–180 ng/μL N. meningitidis DNA and a LOD of 5 ng/μL. Adapted with permission from Ref. [50], copyright (2015) Elsevier B.V. (C) The schematic diagram illustrates an optical fiber SPR setup used for glucose detection. An unclad portion of plastic-clad silica fiber was coated with a Ag layer onto which ZnO NRs were synthesized. The sensing probe was then immobilized with GOx. (D) The SEM images display the hydrothermally grown ZnO NRs in the top panel and the silica fiber surface modified with Ag/ZnO NRs/GOx in the bottom panel. (E) The left plot corresponds to the changes in peak absorbance wavelength as a function of glucose concentration. The shift in the peak absorbance wavelength was ~72 nm in the glucose concentration range of 0–10 mM. The plot on the right shows the sensitivity of the sensor for different glucose concentrations. The sensitivity was calculated from the change in the peak absorbance wavelength per unit change in glucose concentration. (CE) Adapted with permission from Ref. [14], copyright (2016) Elsevier B.V.
Figure 1
Figure 1
An example of a ZnO nanomaterial-based colorimetric biosensor is shown. ZnO NR-modified μPADs were developed as colorimetric biosensors for the detection of glucose and uric acid while employing the chromogenic reagents of AB and AT. (A) The scanning electron microscopy (SEM) panels display the ZnO NRs grown to ~5 μm in length on a Whatman filter paper (WFP). The diameters of the NRs on the μPADs are 500–700 nm for the ZNR-1/WFP, ~200 nm for ZNR-2/WFP, and ~20 nm for ZNR-3/WFP samples. (B) The plot displays the color differences (ΔE) observed from an unmodified WFP, as well as the three ZNR/WFP samples, when 1 mmol/L of uric acid was added to the μPAD sensor containing AB. (C) The colors developed on the ZnO NR-modified μPAD sensors at different incubation times are shown for the detection of both glucose and uric acid. For both analytes, the color images correspond to the case of 1 mmol/L of analyte with AB or AT reacted up to 7 min, as specified for each image. (D) The marked images show the detection layer of a ZNR-3/WFP device when the different concentrations of uric acid and glucose were added to the ZnO NR-modified μPAD biosensor. (E) The graph displays representative calibration curves obtained from the ZnO NR-modified μPAD colorimetric biosensor for the detection of uric acid and glucose. Adapted with permission from Ref. [10], copyright (2021) Elsevier B.V.
Figure 2
Figure 2
An example of ZnO nanomaterials developed as QD fluorophores is displayed. (A) The panel corresponds to a transmission electron microscopy (TEM) image of ~5 nm ZnO QDs used in the detection of TC. The high-resolution image in the inset shows lattice fringes at a distance of 0.28 nm due to the inter-plane distance of the ZnO (100) plane. (B) The excitation and emission spectra of the ZnO QDs are shown in the contour plot. (C) The schematic illustrates how Eu/ZnO nanostructures were constructed for TC detection. Using the chemical reaction schemes, Eu3+ was anchored on the surface of the Eu/ZnO QD fluorescent probe for the rare earth ion’s sensitization by TC. (D) The plot displays the emission spectra of the Eu/ZnO QDs under varying concentrations of TC up to 3 μM. The photographs in the inset were taken from the solution of the Eu/ZnO QDs with no TC (left) and 3 μM TC (right) under a 365 nm UV lamp. (E) The ratiometric calibration curve of the biosensor employing the fluorophores of Eu/ZnO QDs is shown as a function of TC concentration. The basis of the ratiometric analysis was I616/I530, which is the measured fluorescence intensity of Eu3+ at 616 nm divided by that of ZnO QDs at 530 nm. Adapted with permission from Ref. [18], copyright (2021) Elsevier B.V.
Figure 3
Figure 3
Enhanced fluorescence detection of model bioanalytes facilitated by the use of ZnO NRs is exemplified. (A) No significant fluorescence emission was observed from fluorescein isothiocyanate-conjugated anti-immunoglobulin G antibodies (FITC–anti-IgG) when it was adsorbed on the control substrates of Si wafers, Si NRs, and stripe-patterned PMMA substrates, even with protein concentration as high as 2 mg/mL. (B) Markedly strong fluorescence emission was detected from 200 μg/mL FITC–anti-IgG that were deposited on ZnO NRs grown on a Si substrate either to lay flat (left panel) or to form a striped array of vertically aligned NRs (right panel). The fluorescence images in (A,B) are 25 × 25 μm2 in size. The inset of the fluorescence panel in (B) corresponds to the top-down SEM view of the vertically grown ZnO NRs assembled into a striped array. (C) The plot compares the fluorescence intensity from 200 μg/mL FITC–anti-IgG molecules prepared on the different platforms of glass, Si, Si NRs, PMMA, ZnO thin film, and a striped array of ZnO NRs. (D) The plot of fluorescence intensity versus FITC–anti-IgG concentration compares the detection capability of ZnO NRs relative to a conventional platform of PMMA. (AD) Adapted with permission from Ref. [21], copyright (2006) American Chemical Society. (E) Protein–protein interactions were performed on a striped array of ZnO NRs. The NR platform was prepared by placing an elastomeric polymer piece of PDMS that contained two hollow chambers to simultaneously carry out protein reactions on the same platform. Protein pairs examined are fibronectin (Fn) and FITC–anti-IgG, IgG and FITC–anti-IgG, biotinylated bovine serum albumin (BBSA) and dichlorotriazinylamino fluorescein-conjugated streptavidin (DTAF–streptavidin), and IgG and DTAF–streptavidin in the reaction chambers 1 through 4. (F) The SEM image displays the top-down view of a striped array of ZnO NRs equally present inside all reaction chambers. As seen in the fluorescence panels, strong emissions were observable due to the reactions between interacting protein pairs in chambers 2 and 3. No detectable fluorescence signals were seen from chambers 1 and 4 due to the lack of specific protein–protein interactions. (E,F) Adapted with permission from Ref. [26], copyright (2006) WILEY-VCH Verlag GmbH & Co. KGaA, Weinheim.
Figure 4
Figure 4
Examples of ZnO NRs used as a signal-enhancing platform for bioanalyte fluorescence detection are displayed. The bioanalytes assayed in (AC) are the cytokines TNF-α and IL-8 in AKI patient urine samples, and those in (D,E) are the RA autoantibodies in RA patient sera. (A) The SEM panel displays a top-down view of vertically oriented ZnO NRs grown into a square array where the as-synthesized NRs were free from fluorescence emission, as evidenced in the inset. For the simultaneous detection of TNF-α and IL-8, sandwich-type immunoassays were performed on the ZnO NRs. The fluorescence panels of green and red were obtained from the ZnO NRs, where the two colored panels correspond to the detection channels of TNF-α and IL-8, respectively, due to their respective Alexa 488-labeled and Alexa 546-labeled secondary antibodies. (B) The bar graphs display fluorescence readings obtained for both biomarkers from selected patient samples. The fluorescence signals from ∼550 NR square patches per sample were analyzed to obtain the average fluorescence intensity, as well as the associated error bars reported for each patient sample. (C) The data show the results of interassay (data shown under *) and intra-assay (data shown under **) variability for the same patients that were carried out on three different ZnO NR arrays and five times on the same platform, respectively. (AC) Reproduced with permission from Ref. [29], copyright (2016) Royal Society of Chemistry. (D,E) The bar graphs summarize the diagnostic assay results of 10 RA patients and 10 healthy sera using the immunodetection scheme shown in the cartoon. The assays were performed on the platform of (D) ZnO NRs and (E) PS. The red lines inserted in the bar graphs represent the cut-off values (COVs), which were determined from the signals of the negative control samples, i.e., average plus 3 times standard deviation, measured on each platform. On the platform of ZnO NRs, all patient sera showed strong positive signals far above the COV, whereas only a couple of patient sera yielded positive signals that were barely above the COV in the assays using the conventional 96-well PS plate. The net fluorescence measured from each sample was much higher on the ZnO NRs relative to those on the PS. (D,E) Adapted with permission from Ref. [31], copyright (2011) Elsevier B.V.
Figure 5
Figure 5
More examples of ZnO NRs used in fluorescence-based biodetection are presented. (A) The schematic illustration outlines the ATP detection scheme based on the green and red fluorescence signals associated with two split aptamers—a capture aptamer intercalated with green-fluorescent SGI (cAPSGI) and a detection aptamer with an extended DNA sequence required for the formation of red fluorescent AgNCs (dAPAgNC)—while employing vertical ZnO NRs as a signal-enhancing platform. The addition of ATP resulted in a decrease in green fluorescence from cAPSGI and a multi-fold increase in red fluorescence from dAPAgNC. (B,C) The ATP concentration-dependent fluorescence intensity changes, Δf/fo, are plotted for (B) SGI and (C) AgNCs. The insets display the magnified views of the linear regimes. (AC) Adapted with permission from Ref. [32], copyright (2016) Elsevier B.V. (D) The schematic illustration depicts the glucose detection scheme of a FRET transducer made of Con A-conjugating CdSe/ZnS QDs as a donor and MG as an acceptor while employing a platform of ZnO NRs for signal enhancement. (E) The SEM micrographs in the top and bottom panels show a top-down view of the ZnO NRs deposited on a silicone hydrogel and a magnified view of a ZnO NR coated with CdSe/ZnS QDs. (F) The plot displays the linear relationship between the measured fluorescence intensity and the concentration of glucose. (DF) Adapted with permission from Ref. [11], copyright (2016) Elsevier B.V.
Figure 6
Figure 6
Exemplary properties of individual ZnO NRs and their utilities in biodetection are shown. (A) The contour map displays the fluorescence intensity of 200 μg/mL DTAF-anti-IgG deposited on a 25 μm long ZnO NR. The DTAF-anti-IgG fluorescence signals were intense on the NR end relative to the NR side facets. The fluorescence signals on the single ZnO NR also persisted under constant irradiation, reaching a half-life (t1/2, the time point at which there is a 50% reduction of the intensity measured at t = 0) of ~1 min. They were extended much beyond those measured on the conventional substrates of PMMA and PS, whose t1/2 were ~15 and 30 s, respectively. Reprinted with permission from Ref. [22], copyright (2014) Royal Society of Chemistry. (B) The time-lapse fluorescence panels display the spatial and temporal emission behaviors of 1 μg/mL TRITC-anti-IgG deposited on a ZnO NR. (C) The FDTD simulation results in the top, middle, and bottom panels correspond to the radiation patterns from a single 576 nm emitter whose polarization is along the X, Y, and Z directions, respectively. (D) The nanomaterial size effect of a ZnO NR on FINE was evaluated by FDTD simulations. Far-field radiation patterns were obtained from a 517 nm electric dipole and shown for each ZnO NR of the specified length (L) and width (d). The spatial radiation patterns observed from the Z and X directions are displayed in the top and bottom simulation panels, respectively, for the ZnO NRs with the specified dimensions. (E) The plots show the effect of the NR length on FINE and DoF. Different concentrations of DTAF-anti-IgG were coupled to ZnO NRs of various lengths, and the DTAF-anti-IgG fluorescence signals on the ZnO NRs were measured. In all cases, the normalized fluorescence intensity value of ΔI (Iavg,NRef − Iavg,NRsf) indicated that the DoF increased as the NR length became longer. The subscripts of avg, NRef, and NRsf stand for average, NR end facets, and NR side facets, respectively. (BE) Reprinted with permission from Ref. [23], copyright (2015) Royal Society of Chemistry. (F) The scheme illustrates the overall fabrication process of the TNF-α sandwich immunoassay based on individual ZnO NRs. The NR immunoassay platform was integrated into a PDMS elastomer for the application of uniaxial tensile (blue) and compressive (red) strain with a microvice during fluorescence measurements. (G) The plots display % FINE versus % strain in NR length for TNF-α concentrations of 100, 1, and 0.1 fg/mL. Squared data points in blue correspond to the NRs undergoing tension, while circled data points in red refer to the NRs undergoing compression. The solid black lines represent the linear fits for the data points, while the black dashes show the 95% confidence ellipses. Positive values on the x-axis of % strain in NR length denote tension, while negative values indicate compression. (F,G) Reprinted with permission from Ref. [30], copyright (2024) MDPI.
Figure 7
Figure 7
The presented examples of biodetection exploit the PL of ZnO nanomaterials as a signal transduction means, where the changes in their emissions, such as NBE and DLE, are monitored to quantify the bioanalytes of OTA and glucose. (A) The schematic displays the fabrication processes for an OTA detection platform using ZnO NRs. The immunodetection layers of Protein A and anti-OTA were attained on the ZnO NRs through a series of reactions such as silanization, introduction of amino groups by treatment with APTES, introduction of aldehyde groups by modification with glutaraldehyde, covalent immobilization of Protein A, complexation with anti-OTA, and finally, BSA blocking. (B) The graph shows the PL spectra from steady-state conditions after the sensor platform was introduced with OTA of varying concentrations up to 20 ng/mL. (C) The plot displays the change in the normalized PL intensity measured at 379 nm when different concentrations of OTA were added over time. (D) The plot provides the ZnO NR-based immunosensor response to different OTA concentrations. The normalized sensor response plotted was determined by subtracting the normalized intensity from 1. (AD) Adapted with permission from Ref. [43], copyright (2017) Elsevier B.V. (E) The SEM micrographs show the ZnO NRs and ZnO/ZnS core/shell NRs in the left and right panels, respectively. (F) The diagram depicts the electron injection from the flavine moiety to the ZnO/ZnS NRs and the subsequent increase in the UV emission from the ZnO/ZnS-MAA-GOx bioconjugates. (G) Upon modification of the NR surfaces with MAA-GOx, the PL spectra were obtained from the platforms of ZnO NRs (blue) and ZnO/ZnS NRs (red). (H) The plot displays the increased PL intensity versus glucose concentration for ZnO-MAA-GOx (blue) and ZnO/ZnS-MAA-GOx (red). The glucose LODs determined for ZnO-MAA-GOx and ZnO/ZnS-MAA-GOx were 0.23 and 0.14 mM, respectively. (EH) Adapted with permission from Ref. [13], copyright (2011) Elsevier B.V.
Figure 8
Figure 8
ZnO NPs coated with SiO2 were used as a CL probe in HeLa cell imaging. (A) The graph shows the CL spectra of the ZnO NPs and ZnO/SiO2 NPs in CPPO/H2O2 solution. The photograph of the CPPO/H2O2 solution taken in the dark after adding the ZnO/SiO2 NPs is shown in the inset. (B) The plot displays the CL intensity versus the concentration of the ZnO/SiO2 NPs. (C) The PL spectrum of the blank, Zn(Ac)2·2H2O, nano-ZnO NPs, ZnO NPs, and annealed ZnO NPs in the CL analysis system. The CL intensity induced in the CPPO/H2O2 solution is displayed in the bar graphs for the ZnO NPs as well as other controls such as the blank solution, Zn(CH3COO)2·2H2O, nano-ZnO, and annealed ZnO NPs. The ZnO NPs and Zn(CH3COO)2·2H2O exhibit CL enhancement, whereas no impact on CL is observed from the nano-ZnO and annealed ZnO NPs. From this, the interstitial Zn atoms were deduced to be engaged in the CL process. (D) The schematics illustrate the CL process of the ZnO NPs. CPPO reacts with H2O2, producing 1, 2-dioxetanedione. With the injection of the ZnO NPs, a chemically initiated electron exchange luminescence (CIEEL) occurs between the intermediate and surface interstitial Zn atoms of the NPs. The interstitial Zn defects are then excited and transited to the VB, emitting blue light. The ZnO NPs exhibit yellow PL emission due to DLE associated with the electron transition from the energy level of the interstitial Zn atom to that of Zn vacancy. The CL process affects the ZnO PL, causing a red-shift in PL. (E) The schematic illustration represents the use of the biocompatible ZnO/SiO2 NPs in CL-based cell imaging. The CL images were taken from HeLa cells cultured with the ZnO/SiO2 NPs for 6 h and then added to the CPPO mixture of different H2O2 concentrations, as specified in the bottom panel. (F) The CL intensities measured from the CL images in (E) are displayed. The CL intensity was directly proportional to the H2O2 concentration. Adapted with permission from Ref. [143], copyright (2020) Elsevier B.V.
Figure 9
Figure 9
Examples of WGM and LMR biosensors fabricated from ZnO nanomaterials are shown. (A) The schematic illustrates a ZnO NR-based WGM biosensor and the WGM optical paths generated inside the NRs. (B) The plot corresponds to the PL spectrum of the Mn-doped ZnO NRs vertically oriented on a Si substrate. The PL spectrum shows the NBE emission at 378 nm, as well as multiple broad DLE peaks between 450–650 nm. WGMs of the DLEs were formed inside the optical resonators of the ZnO NRs, as annotated for each WGM peak. (C) The Gaussian fitting result of the WGM data in (B) is displayed in the plot. The WGM emission maximum occurred at 528.2 nm for the ZnO NRs, whose peak was blue-shifted to 524.4 nm upon anti-GVA immobilization to the NRs and subsequently red-shifted to 527 nm after further incubation with GVA. (D) The PL spectra of the ZnO NRs, as well as those treated with anti-GVA and subsequently with 1 ng/mL GVA, are presented. The inset belongs to the Gaussian-fitted WGM peaks. (AD) Adapted with permission from Ref. [44], copyright (2020) Elsevier B.V. (E) The pictorial representation shows a lossy-mode resonance (LMR) biosensor fabricated from a ZnO thin film with polypyrrole (PPY) prepared with a molecular imprinting polymer technique. The LMR sensor was subsequently used in cortisol detection. (F) The plot displays the absorbance wavelength of the LMR peak as a function of cortisol concentration. A blue shift of 51.23 nm in the LMR absorbance wavelength was observed for the cortisol concentration range of 10−12–10−6 g/mL. (G) The sensitivity for the different cortisol concentrations is shown for the LMR sensor prepared with 20% ZnO/PPY. The sensitivity was evaluated from the sensor calibration curve by taking the derivative of the curve fit equation with respect to cortisol concentration. A maximum sensitivity of 12.86 nm/Log (g/mL) was yielded for 10−12 g/mL of cortisol. This rate of change in the absorbance wavelength decreased with increasing cortisol concentration. (EG) Adapted with permission from Ref. [48], copyright (2016) Elsevier B.V.
Figure 11
Figure 11
(A) The schematic diagram depicts the fabrication process for an SERS biosensor to detect the SARS-CoV-2 spike protein. The SERS sensor platform was constructed by synthesizing vertical ZnO NRs on a Ag layer and decorating the NR side walls with Au NPs. The Au NPs on the sensor platform were then modified with MET to promote the capture of the spike protein. (B) The top-view SEM image displays Au NPs decorating the side walls of the ZnO NRs. Five different SERS substrates of Au NP/ZnO NRs (A1 to A5) were used in the study by varying the average diameters of the ZnO NRs: ∼155, 205, 240, 349, and 435 nm. The substrate shown in the SEM panel corresponds to A4 with an NR diameter of ~349 nm, which was reported to yield the best SERS signals. (C) The plots display the Raman spectrum of the SARS-CoV-2 spike protein in PBS using the SERS substrate in (B). The Raman signals measured at 680 cm−1 were then used to create the Log–Log plot of Raman intensity versus protein concentration. Each error bar indicates the standard deviation of five different measurements from a single SERS substrate. (D) The detection of the SARS-CoV-2 spike protein in untreated saliva was carried out on the SERS substrate. The Raman intensity and Log–Log plots are provided for the saliva samples. Adapted with permission from Ref. [52], copyright (2023) Elsevier B.V.
Figure 12
Figure 12
ZnO thin film was used as an SERS biosensor for the detection of MNZ. (A) The field emission SEM (FESEM) image corresponds to the 6-layer ZnO thin films prepared by sol-gel dip coating and annealed at 500 °C for 30, 90, and 120 min. The last SEM micrograph is a cross-sectional view of the ZnO thin film annealed for 120 min. (B) The FESEM images show the Ag NPs deposited on glass substrates by the DC magnetron sputtering method for 10 and 15 s. (C) The schematic diagram depicts the CT processes between the MNZ molecules and the Ag NP-ZnO thin film. When excited by a 532 nm laser, electron movements can occur via multiple pathways between the various energy levels, such as the Fermi energy (EF) level of Ag NPs, the VB/CB of ZnO, the surface state energy (Ess) level of ZnO, and the HOMO/LUMO of MNZ. The Ess comes from the surface defects of ZnO. The narrowed optical band gap of the ZnO thin film after annealing can additionally support the CT. The rough and porous thin-film surface also promotes the CT by providing low reflection and high scattering of the incident light. The increased CT processes facilitate SERS through the CE mechanism. (D) The plots display the Raman signal of 104 ppm MNZ absorbed on the substrates of (top) the Ag NP-ZnO thin film and (middle) bare glass. The plot in the bottom panel corresponds to the blank solution of methanol (MeOH) deposited on a substrate of Ag NP-ZnO thin film. MeOH was the solvent used to prepare the MNZ solution. The Ag-ZnO substrates were prepared by 10 s sputtering of Ag NPs onto a ZnO thin film annealed for 120 min. (E) The plots display the SERS spectra obtained from varying MNZ concentrations absorbed on the Ag NP-ZnO thin film. The Ag/ZnO SERS substrate could detect MNZ at a concentration as low as 0.01 ppm with an SERS EF of ~106. Adapted with permission from Ref. [55], copyright (2023) American Chemical Society.

Similar articles

Cited by

References

    1. Hahm J.-I. Fundamental Properties of One-Dimensional Zinc Oxide Nanomaterials and Implementations in Various Detection Modes of Enhanced Biosensing. Annu. Rev. Phys. Chem. 2016;67:691–717. doi: 10.1146/annurev-physchem-031215-010949. - DOI - PMC - PubMed
    1. Krishna M.S., Singh S., Batool M., Fahmy H.M., Seku K., Shalan A.E., Lanceros-Mendez S., Zafar M.N. A Review on 2D-ZnO Nanostructure Based Biosensors: From Materials to Devices. Mater. Adv. 2023;4:320–354. doi: 10.1039/D2MA00878E. - DOI
    1. Beitollahi H., Tajik S., Garkani Nejad F., Safaei M. Recent Advances in ZnO Nanostructure-Based Electrochemical Sensors and Biosensors. J. Mater. Chem. B. 2020;8:5826–5844. doi: 10.1039/D0TB00569J. - DOI - PubMed
    1. Zhu P., Weng Z., Li X., Liu X., Wu S., Yeung K.W.K., Wang X., Cui Z., Yang X., Chu P.K. Biomedical Applications of Functionalized ZnO Nanomaterials: From Biosensors to Bioimaging. Adv. Mater. Interfaces. 2016;3:1500494. doi: 10.1002/admi.201500494. - DOI
    1. Escalona-Villalpando R.A., Viveros-Palma K., Espinosa-Lagunes F.I., Rodríguez-Morales J.A., Arriaga L.G., Macazo F.C., Minteer S.D., Ledesma-García J. Comparative Colorimetric Sensor Based on Bi-Phase γ-/α-Fe2O3 and γ-/α-Fe2O3/ZnO Nanoparticles for Lactate Detection. Biosensors. 2022;12:1025. doi: 10.3390/bios12111025. - DOI - PMC - PubMed

LinkOut - more resources