A Low-Cost, Portable, Multi-Cancer Screening Device Based on a Ratio Fluorometry and Signal Correlation Technique
- PMID: 39451695
- PMCID: PMC11506725
- DOI: 10.3390/bios14100482
A Low-Cost, Portable, Multi-Cancer Screening Device Based on a Ratio Fluorometry and Signal Correlation Technique
Abstract
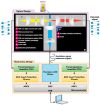
The autofluorescence of erythrocyte porphyrins has emerged as a potential method for multi-cancer early detection (MCED). With this method's dependence on research-grade spectrofluorometers, significant improvements in instrumentation are necessary to translate its potential into clinical practice, as with any promising medical technology. To fill this gap, in this paper, we present an automated ratio porphyrin analyzer for cancer screening (ARPA-CS), a low-cost, portable, and automated instrument for MCED via the ratio fluorometry of porphyrins. The ARPA-CS aims to facilitate cancer screening in an inexpensive, rapid, non-invasive, and reasonably accurate manner for use in primary clinics or at point of care. To accomplish this, the ARPA-CS uses an ultraviolet-excited optical apparatus for ratio fluorometry that features two photodetectors for detection at 590 and 630 nm. Additionally, it incorporates a synchronous detector for the precision measurement of signals based on the Walsh-ordered Walsh-Hadamard transform (WHT)w and circular shift. To estimate its single-photodetector capability, we established a linear calibration curve for the ARBA-CS exceeding four orders of magnitude with a linearity of up to 0.992 and a low detection limit of 0.296 µg/mL for riboflavin. The ARPA-CS also exhibited excellent repeatability (0.21%) and stability (0.60%). Moreover, the ratio fluorometry of three serially diluted standard solutions of riboflavin yielded a ratio of 0.4, which agrees with that expected based on the known emission spectra of riboflavin. Additionally, the ratio fluorometry of the porphyrin solution yielded a ratio of 49.82, which was ascribed to the predominant concentration of protoporphyrin IX in the brown eggshells, as confirmed in several studies. This study validates this instrument for the ratio fluorometry of porphyrins as a biomarker for MCED. Nevertheless, large and well-designed clinical trials are necessary to further elaborate more on this matter.
Keywords: Walsh–Hadamard transform; cancer screening; lock-in amplifier; porphyrins; ratio fluorometry.
Conflict of interest statement
The authors declare no conflicts of interest.
Figures


References
-
- Pan American Health Organization (PAHO) [(accessed on 28 July 2024)]. Available online: https://www.paho.org/en/campaigns/world-cancer-day-2023-close-care-gap.
-
- Chen S., Cao Z., Prettner K., Kuhn M., Yang J., Jiao L., Wang Z., Li W., Geldsetzer P., Bärnighausen T., et al. Estimates and Projections of the Global Economic Cost of 29 Cancers in 204 Countries and Territories From 2020 to 2050. JAMA Oncol. 2023;9:465–472. doi: 10.1001/jamaoncol.2022.7826. - DOI - PMC - PubMed
MeSH terms
Substances
LinkOut - more resources
Full Text Sources
Miscellaneous

