. 2024 Oct 9;14(10):489.
doi: 10.3390/bios14100489.

Non-Invasive On-Off Fluorescent Biosensor for Endothelial Cell Detection

Affiliations

Non-Invasive On-Off Fluorescent Biosensor for Endothelial Cell Detection

Qingyun Jiang et al. Biosensors (Basel). .

Abstract

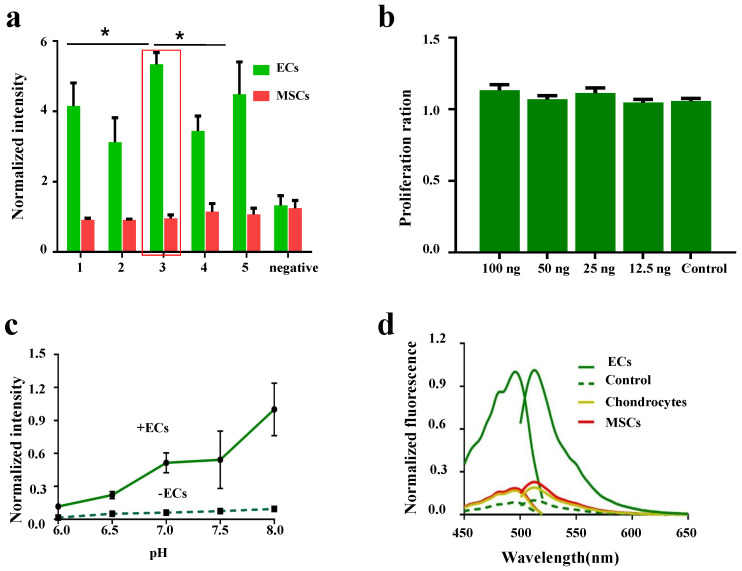
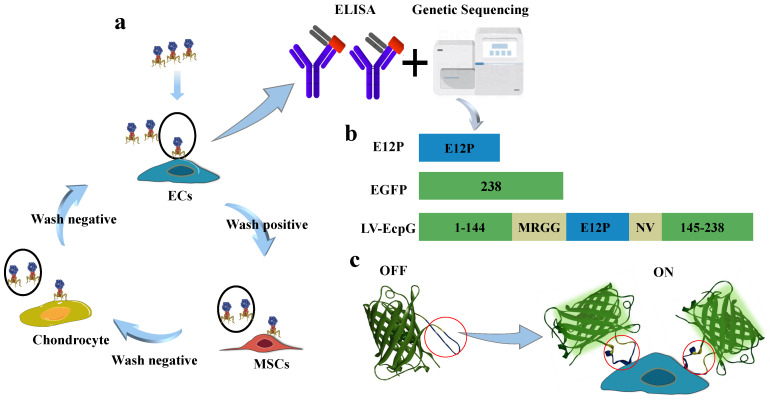
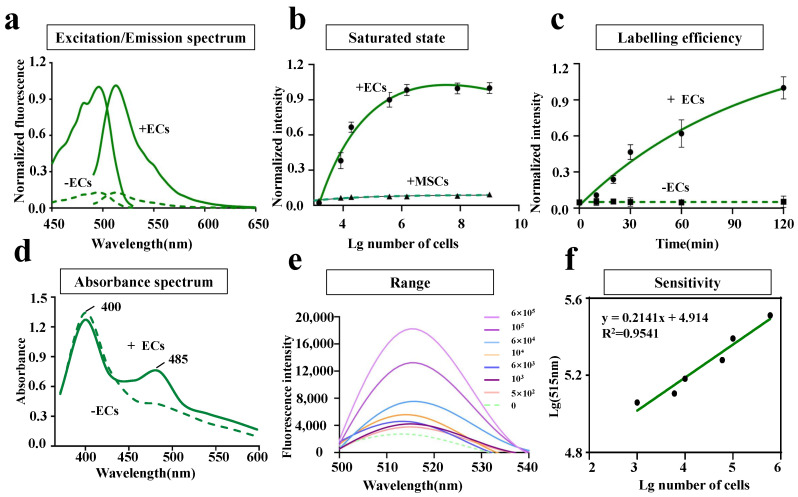
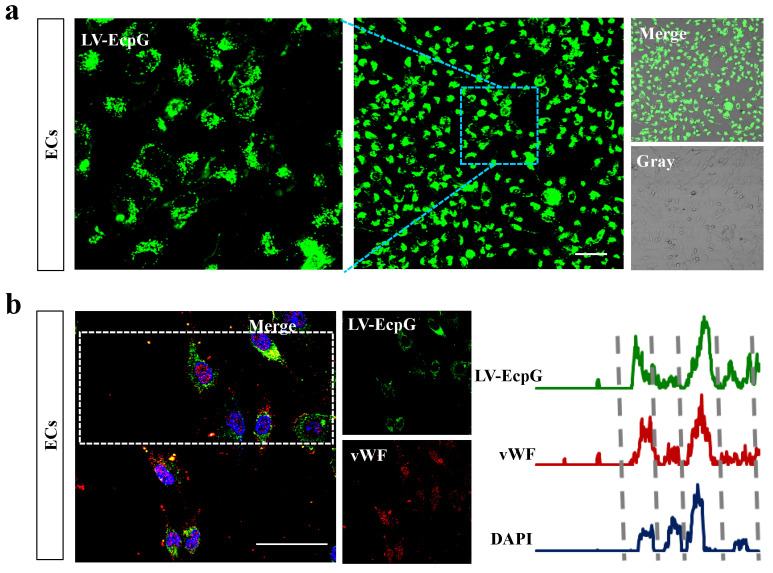
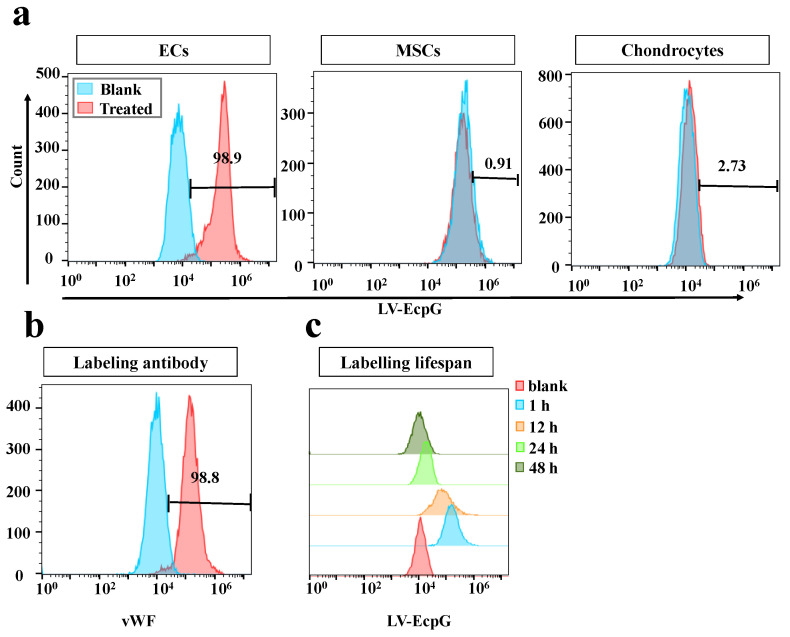
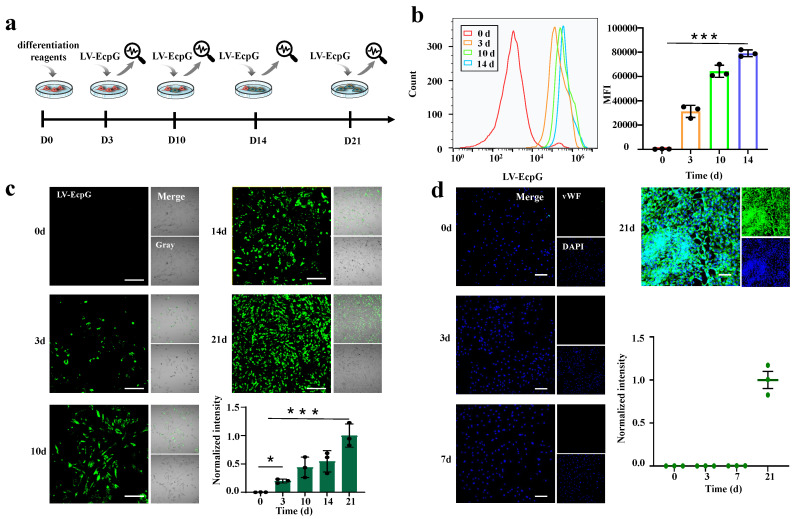
For rapid and convenient detection of living endothelial cells (ECs) specifically without immunostaining, we developed a biosensor based on turn-on fluorescent protein, named LV-EcpG. It includes a high-affinity peptide E12P obtained through phage display technology for specifically recognizing ECs and a turn-on EGFP fused with two linker peptides. The "on-off" switching mechanism of this genetically encoded fluorescent protein-based biosensor (FPB) ensured that fluorescence signals were activated only when binding with ECs, thus enabling these FPB characters for direct, visual, and non-invasive detection of ECs. Its specificity and multicolor imaging capability established LV-EcpG as a powerful tool for live EC research, with significant potential for diagnosing and treating cardiovascular diseases and tumor angiogenesis.

Keywords: affinity peptide; endothelial cells (ECs); genetically encoded fluorescent protein-based biosensors (FPBs); non-invasive; phage display.


Conflict of interest statement

The authors declare no conflicts of interest.

Figures

Figure A1
Figure A1
(a) ELISA for affinity peptides to ECs. (b) Effect of LV-EcpG biosensor on proliferation of ECs. (c) Fluorescence intensities of LV-EcpG at the indicated pH. (d) The excitation and emission spectra of LV-EcpG biosensor were characterized, delineating trajectories in the presence (solid lines) and absence (dashed lines) of cells. Specifically, the cells examined comprised MSCs, ECs, and chondrocytes. Each data point represents a visual field, * p<0.05, n = 3 technical repeats. Data are plotted as mean ± s.e.m.
Figure 1
Figure 1
Schematic drawing of LV-EcpG biosensor. (a) Subtractive phage display schematic, where positive cells were identified as ECs, while MSCs and chondrocytes served as negative controls, and underwent three rounds of selection. Subsequently, the affinity peptide E12P was obtained through ELISA and gene sequencing. (b) Drawings for EGFP and E12P resultant LV-EcpG. (c) The simulation display of the LV-EcpG testing agency shows that the lock represents LV-EcpG, ECs represent the key, and ECs are displayed as the specific key for LV-EcpG to open (left). A schematic diagram of the real application of LV-EcpG, wherein the biosensor is introduced into target cells for detection. The process of fluorescence display from “off” to “on”. Conformational change domain (red circle). 3D utilizing EGFP (PDB: 6YLQ).
Figure 2
Figure 2
Characterization of LV-EcpG biosensor performance. (a) The excitation and emission spectra of 5μM LV-EcpG biosensor in the presence (solid line) and absence (dashed line) of 106 ECs. The FI was normalized to the maximum without target cells. (b) Dose-response curve of LV-EcpG biosensor combined with different numbers of ECs and MSCs. Lines were best fits of the data to the one-site binding equation, and all data are normalized to the initial value. ECs quantity/100 μL. (c) Fluorescent labeling efficiency of LV-EcpG biosensor. Fluorescence was activated in EC manner with half-times 0.36 h. Lines were best fits of the data to a single exponential function, and all data are normalized to the maximum FI in the absence of ECs. (d) Absorbance spectra of 5μM LV-EcpG in the presence (solid line) or absence (dashed line) of 106 ECs. (e) Fluorescence spectra of LV-EcpG in different numbers of ECs. EC quantity/100 μL. (f) Linear relationship between lg 515 nm and lg numbers of ECs. Data are plotted as mean ± s.e.m and, in some cases, are smaller than the symbols used for the mean. (n = 3 technical repeats, defined as data obtained from the same stock of purified protein).
Figure 3
Figure 3
Confocal image of LV-EcpG biosensor. (a) Representative fluorescence image following the incubation ECs with LV-EcpG. (b) Co-localization of LV-EcpG and vWF in ECs were depicted through representative fluorescence images (left), with statistical analysis of fluorescent co-localization traces (right), delineated by dashed lines for each cell. n = 3 technical repeats, Scale bars, 40μm.
Figure 4
Figure 4
Flow cytometry detection of LV-EcpG biosensor performance. (a) Histogram of flow cytometry fluorescence distribution of LV-EcpG with ECs (left), MSCs (middle), and chondrocytes (right). (b) Flow cytometry histogram of vWF expression in ECs. (c) LV-EcpG biosensor fluorescence lifetime histogram. Histograms of fluorescence intensity distribution for flow cytometric analysis of LV-EcpG labeled ECs at different culture times. Data are plotted as mean ± s.e.m and, in some cases, are smaller than the symbols used for the mean. (n = 3 technical repeats, defined as data obtained from the same stock of purified protein).
Figure 5
Figure 5
Visualization of the directed differentiation of MSCs into ECs. (a) Schematic of biosensor usage. (b) Flow cytograms (left) and the MFI histogram (right) of MSCs differentiated into ECs using LV-EcpG real-time detection. (c) Fluorescent representative images of MSCs differentiated into ECs using LV-EcpG real-time detection and histograms of the proportion of LV-EcpG. (d) vWF immunofluorescence images of MSC–EC differentiation at different time points and its statistical graph. Scale bars, 40μm. Each data point represents a visual field, * p < 0.05, *** p < 0.001, n = 3 technical repeats. Data were plotted as mean ± s.e.m.

Similar articles

References

    1. Xing L., Huang G., Chen R., Huang L., Liu J., Ren X., Wang S., Kuang H., Kumar A., Kim J.K., et al. Critical role of mitogen-inducible gene 6 in restraining endothelial cell permeability to maintain vascular homeostasis. J. Cell Commun. Signal. 2023;17:151–165. doi: 10.1007/s12079-022-00704-z. - DOI - PMC - PubMed
    1. Amersfoort J., Eelen G., Carmeliet P. Immunomodulation by endothelial cells—Partnering up with the immune system? Nat. Rev. Immunol. 2022;22:576–588. doi: 10.1038/s41577-022-00694-4. - DOI - PMC - PubMed
    1. Xu S., Ilyas I., Little P.J., Li H., Kamato D., Zheng X., Luo S., Li Z., Liu P., Han J., et al. Endothelial dysfunction in atherosclerotic cardiovascular diseases and beyond: From mechanism to pharmacotherapies. Pharmacol. Rev. 2021;73:924–967. doi: 10.1124/pharmrev.120.000096. - DOI - PubMed
    1. Li Y., Zhu X., Kong M., Chen S., Bao J., Ji Y. Three-dimensional microtumor formation of infantile hemangioma-derived endothelial cells for mechanistic exploration and drug screening. Pharmaceuticals. 2022;15:1393. doi: 10.3390/ph15111393. - DOI - PMC - PubMed
    1. Zakharova I., Saaya S., Shevchenko A., Stupnikova A., Zhiven’ M., Laktionov P., Stepanova A., Romashchenko A., Yanshole L., Chernonosov A., et al. Mitomycin-treated endothelial and smooth muscle cells suitable for safe tissue engineering approaches. Front. Bioeng. Biotechnol. 2022;10:772981. doi: 10.3389/fbioe.2022.772981. - DOI - PMC - PubMed

Substances

LinkOut - more resources