

Post-Movement Beta Synchrony Inhibits Cortical Excitability
- PMID: 39451984
- PMCID: PMC11505688
- DOI: 10.3390/brainsci14100970
Post-Movement Beta Synchrony Inhibits Cortical Excitability
Abstract
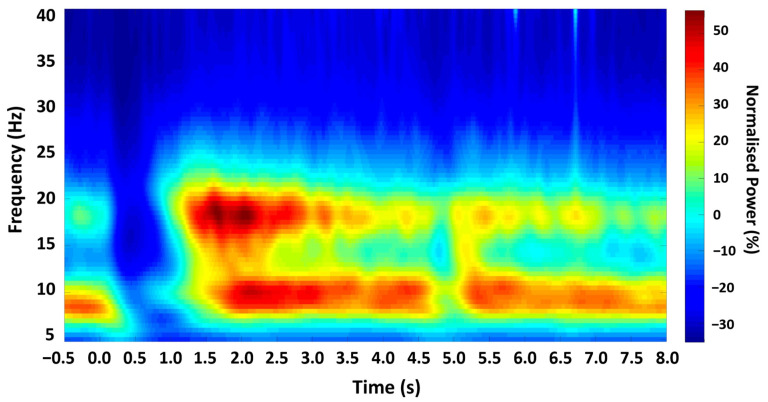
Background/objectives: This study investigates the relationship between movement-related beta synchrony and primary motor cortex (M1) excitability, focusing on the time-dependent inhibition of movement. Voluntary movement induces beta frequency (13-30 Hz) event-related desynchronisation (B-ERD) in M1, followed by post-movement beta rebound (PMBR). Although PMBR is linked to cortical inhibition, its temporal relationship with motor cortical excitability is unclear. This study aims to determine whether PMBR acts as a marker for post-movement inhibition by assessing motor-evoked potentials (MEPs) during distinct phases of the beta synchrony profile.
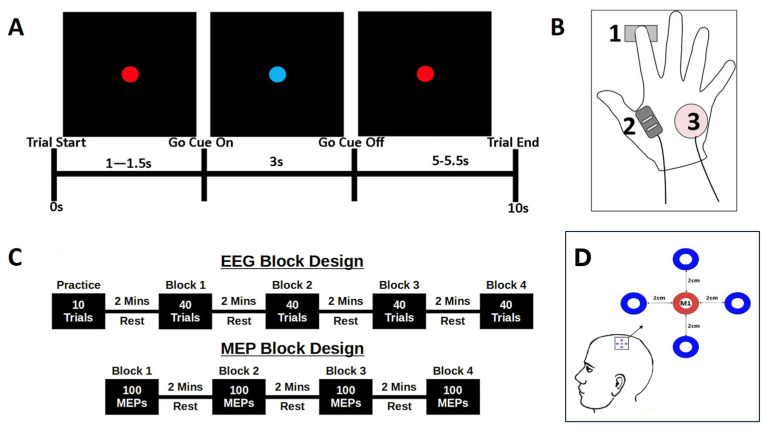
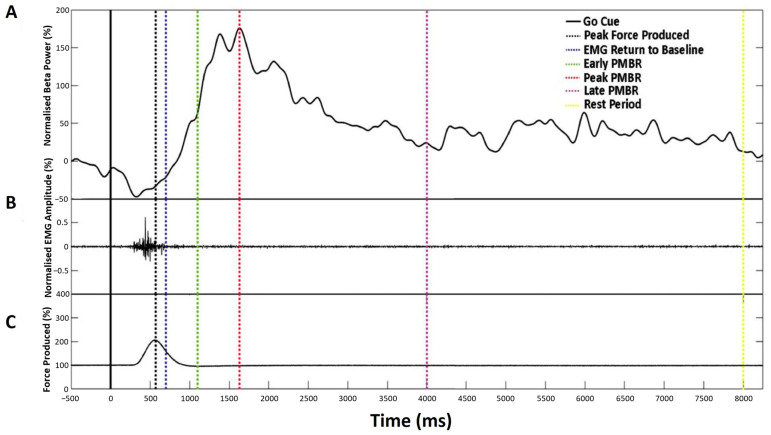
Methods: Twenty-five right-handed participants (mean age: 24 years) were recruited. EMG data were recorded from the first dorsal interosseous muscle, and TMS was applied to the M1 motor hotspot to evoke MEPs. A reaction time task was used to elicit beta oscillations, with TMS delivered at participant-specific time points based on EEG-derived beta power envelopes. MEP amplitudes were compared across four phases: B-ERD, early PMBR, peak PMBR, and late PMBR.
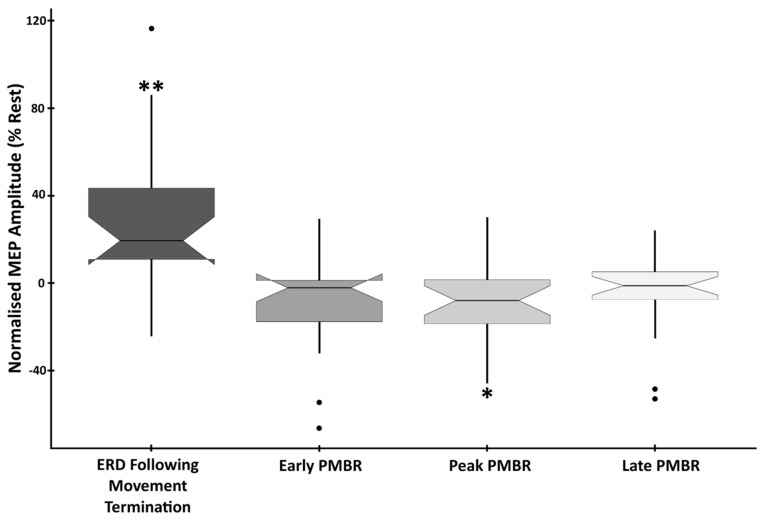
Results: Our findings demonstrate that MEP amplitude significantly increased during B-ERD compared to rest, indicating heightened cortical excitability. In contrast, MEPs recorded during peak PMBR were significantly reduced, suggesting cortical inhibition. While all three PMBR phases exhibited reduced cortical excitability, a trend toward amplitude-dependent inhibition was observed.
Conclusions: This study confirms that PMBR is linked to reduced cortical excitability, validating its role as a marker of motor cortical inhibition. These results enhance the understanding of beta oscillations in motor control and suggest that further research on altered PMBR could be crucial for understanding neurological and psychiatric disorders.
Keywords: B-ERD; PMBR; beta synchrony; cortical excitability; motor control; movement; oscillations.
Conflict of interest statement
The authors have no conflicts of interest to declare.
Figures
References
-
- Leocani L., Toro C., Manganotti P., Zhuang P., Hallett M. Event-related coherence and event-related desynchronization/synchronization in the 10 Hz and 20 Hz EEG during self-paced movements. Electroencephalogr. Clin. Neurophysiol. Potentials Sect. 1997;104:199–206. doi: 10.1016/S0168-5597(96)96051-7. - DOI - PubMed
LinkOut - more resources
Full Text Sources
