

Visual Perceptual Learning of Form-Motion Integration: Exploring the Involved Mechanisms with Transfer Effects and the Equivalent Noise Approach
- PMID: 39452011
- PMCID: PMC11506814
- DOI: 10.3390/brainsci14100997
Visual Perceptual Learning of Form-Motion Integration: Exploring the Involved Mechanisms with Transfer Effects and the Equivalent Noise Approach
Abstract
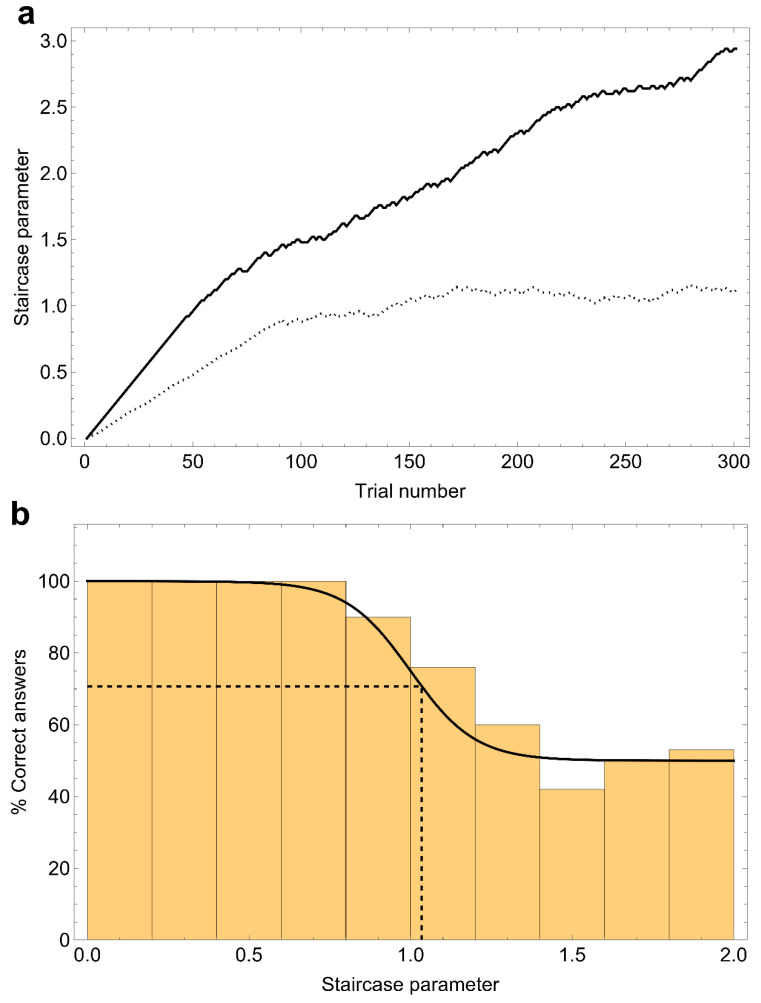
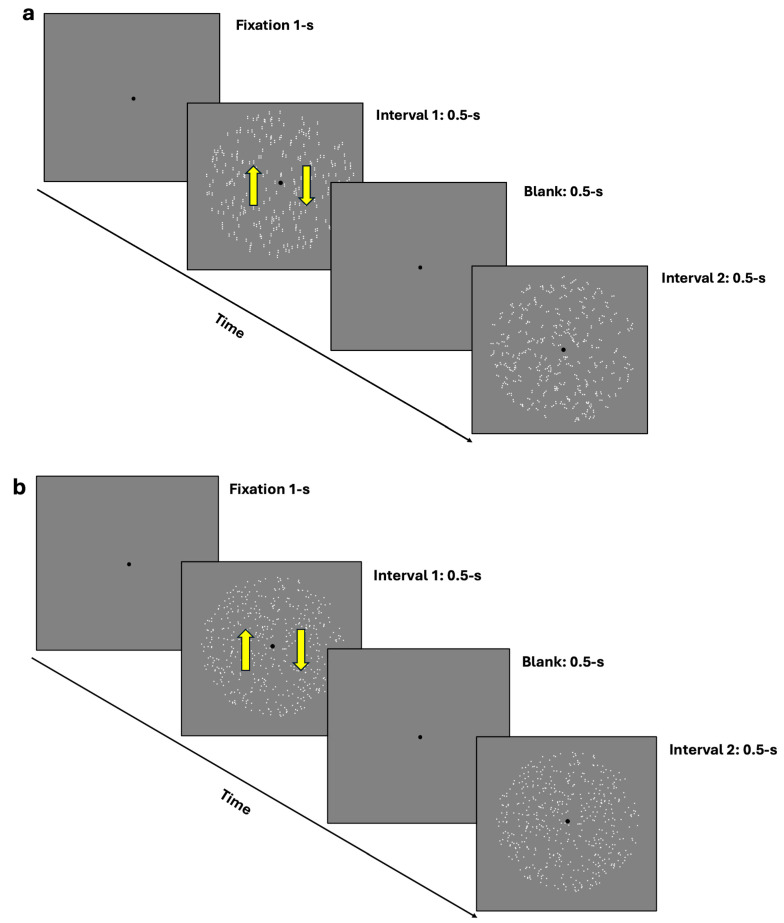
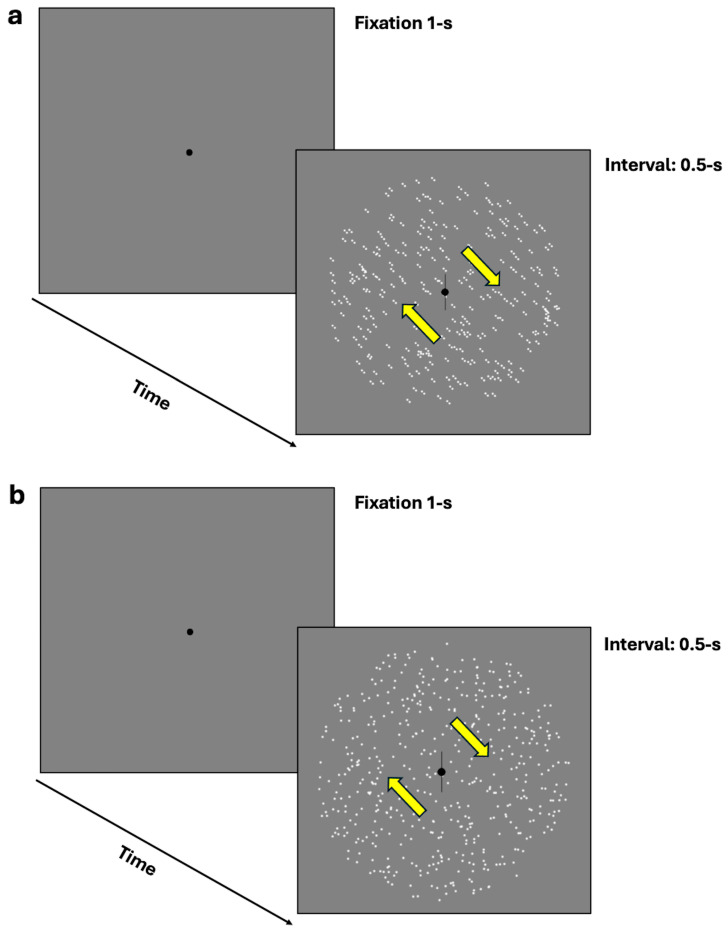
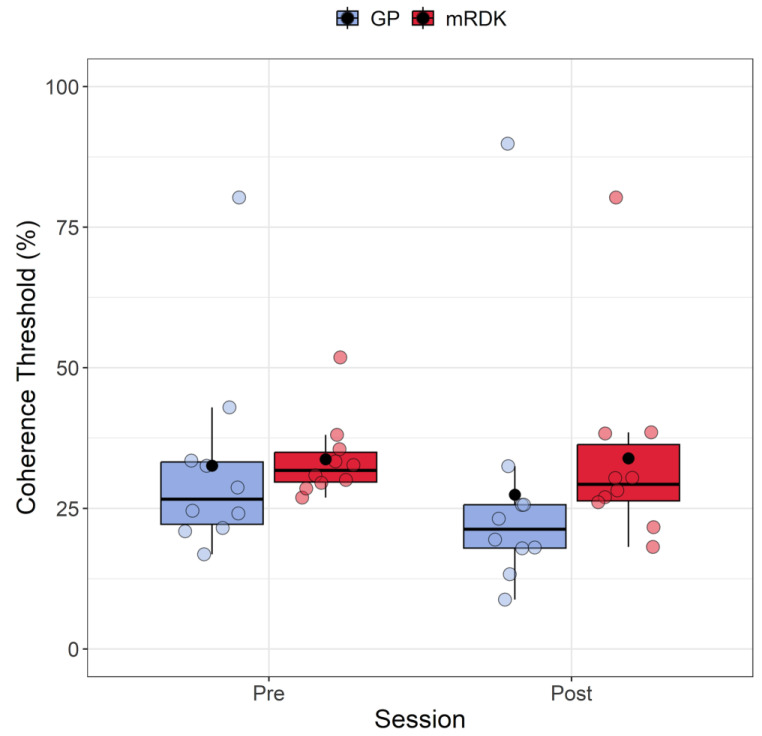
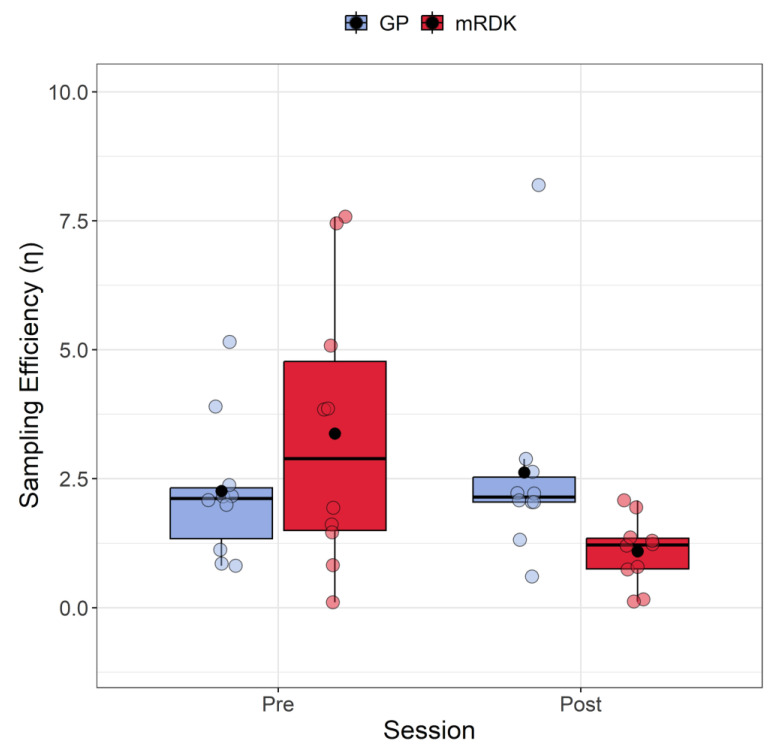
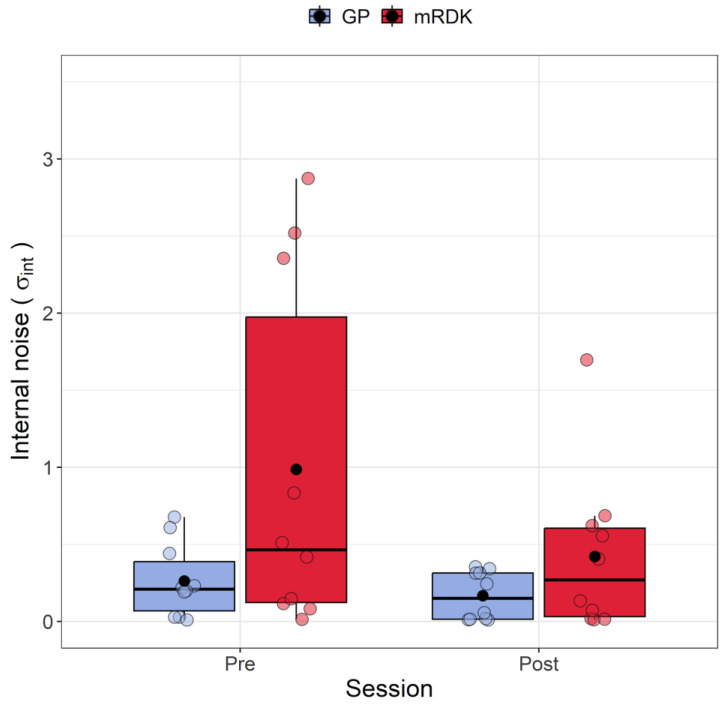
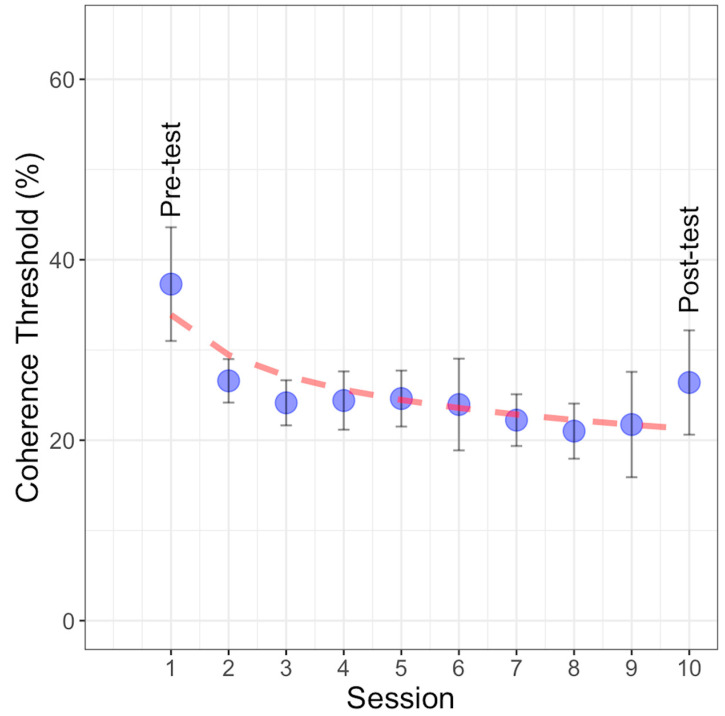
Background: Visual perceptual learning plays a crucial role in shaping our understanding of how the human brain integrates visual cues to construct coherent perceptual experiences. The visual system is continually challenged to integrate a multitude of visual cues, including form and motion, to create a unified representation of the surrounding visual scene. This process involves both the processing of local signals and their integration into a coherent global percept. Over the past several decades, researchers have explored the mechanisms underlying this integration, focusing on concepts such as internal noise and sampling efficiency, which pertain to local and global processing, respectively. Objectives and Methods: In this study, we investigated the influence of visual perceptual learning on non-directional motion processing using dynamic Glass patterns (GPs) and modified Random-Dot Kinematograms (mRDKs). We also explored the mechanisms of learning transfer to different stimuli and tasks. Specifically, we aimed to assess whether visual perceptual learning based on illusory directional motion, triggered by form and motion cues (dynamic GPs), transfers to stimuli that elicit comparable illusory motion, such as mRDKs. Additionally, we examined whether training on form and motion coherence thresholds improves internal noise filtering and sampling efficiency. Results: Our results revealed significant learning effects on the trained task, enhancing the perception of dynamic GPs. Furthermore, there was a substantial learning transfer to the non-trained stimulus (mRDKs) and partial transfer to a different task. The data also showed differences in coherence thresholds between dynamic GPs and mRDKs, with GPs showing lower coherence thresholds than mRDKs. Finally, an interaction between visual stimulus type and session for sampling efficiency revealed that the effect of training session on participants' performance varied depending on the type of visual stimulus, with dynamic GPs being influenced differently than mRDKs. Conclusion: These findings highlight the complexity of perceptual learning and suggest that the transfer of learning effects may be influenced by the specific characteristics of both the training stimuli and tasks, providing valuable insights for future research in visual processing.
Keywords: equivalent noise analysis; glass patterns; internal noise; modified random-dot kinematograms; non-directional motion; sampling efficiency; visual perceptual learning.
Conflict of interest statement
The authors declare no competing financial interests.
Figures
Similar articles
-
Mechanisms Underlying Directional Motion Processing and Form-Motion Integration Assessed with Visual Perceptual Learning.Vision (Basel). 2022 May 31;6(2):29. doi: 10.3390/vision6020029. Vision (Basel). 2022. PMID: 35737415 Free PMC article.
-
The interaction of global motion and global form processing on the perception of implied motion: An equivalent noise approach.Vision Res. 2021 Sep;186:34-40. doi: 10.1016/j.visres.2021.04.006. Epub 2021 May 21. Vision Res. 2021. PMID: 34030023
-
The neural basis of form and form-motion integration from static and dynamic translational Glass patterns: A rTMS investigation.Neuroimage. 2017 Aug 15;157:555-560. doi: 10.1016/j.neuroimage.2017.06.036. Epub 2017 Jun 17. Neuroimage. 2017. PMID: 28633972
-
Temporal summation of global form signals in dynamic Glass patterns.Vision Res. 2015 Feb;107:30-5. doi: 10.1016/j.visres.2014.10.033. Epub 2014 Nov 20. Vision Res. 2015. PMID: 25451242
-
Perception of complex Glass patterns through spatial summation across unique frames.Vision Res. 2024 Mar;216:108364. doi: 10.1016/j.visres.2024.108364. Epub 2024 Feb 19. Vision Res. 2024. PMID: 38377786
References
-
- Azulai O., Shalev L., Mevorach C. Feature discrimination learning transfers to noisy displays in complex stimuli. Front. Cogn. 2024;3:1349505. doi: 10.3389/fcogn.2024.1349505. - DOI
Grants and funding
LinkOut - more resources
Full Text Sources
Miscellaneous
