. 2024 Oct 19;14(10):1039.
doi: 10.3390/brainsci14101039.

Heterogeneous Nuclear Ribonucleoprotein A1 Knockdown Alters Constituents of Nucleocytoplasmic Transport

Affiliations

Heterogeneous Nuclear Ribonucleoprotein A1 Knockdown Alters Constituents of Nucleocytoplasmic Transport

Todd E Stang et al. Brain Sci. .

Abstract

Background/objectives: Changes in nuclear morphology, alterations to the nuclear pore complex (NPC), including loss, aggregation, and dysfunction of nucleoporins (Nups), and nucleocytoplasmic transport (NCT) abnormalities have become hallmarks of neurodegenerative diseases. Previous RNA sequencing data utilizing knockdown of heterogeneous nuclear ribonucleoprotein A1 (hnRNP A1) identified enrichment for pathways and changes in RNAs related to nuclear morphology and showed differential expression of key nuclear targets. This suggests that dysfunction of hnRNP A1, which is observed in neurodegenerative diseases, may contribute to abnormalities in nuclear morphology, NPC, and NCT.

Methods: We performed knockdown of hnRNP A1 in Neuro-2A cells, a neuronal cell line, to examine nuclear morphology, NPC, and NCT.

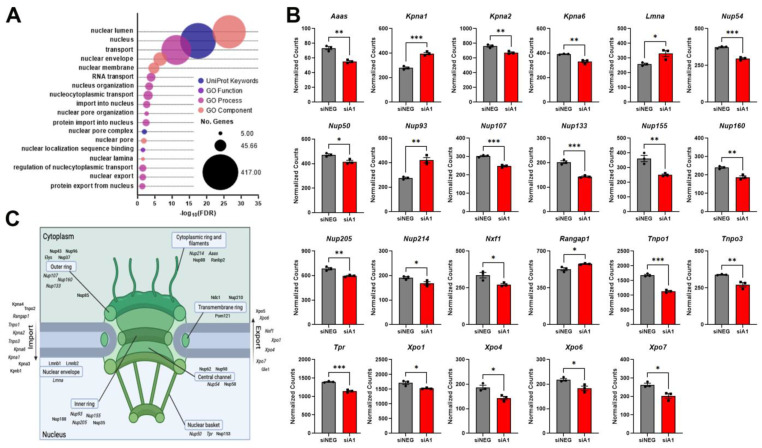
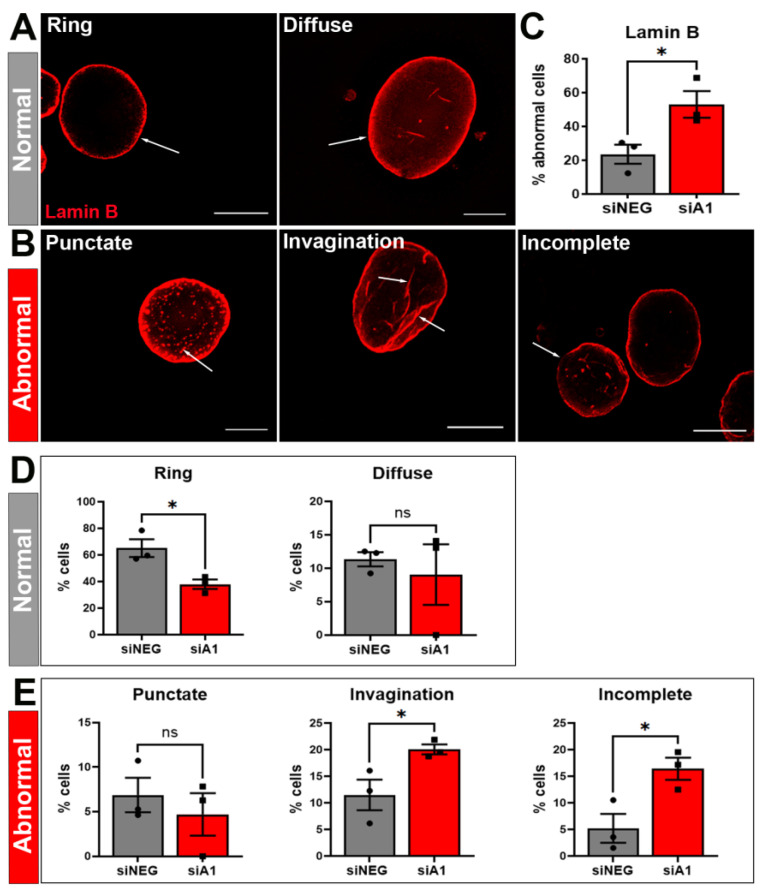
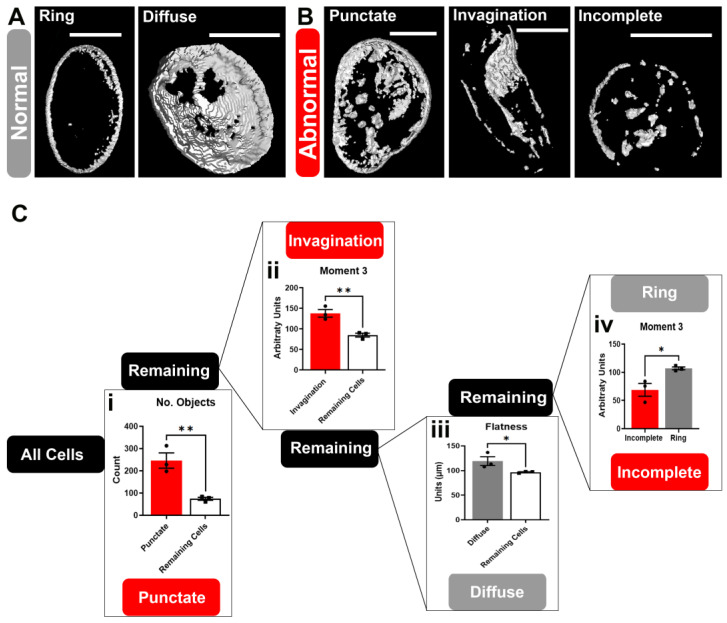
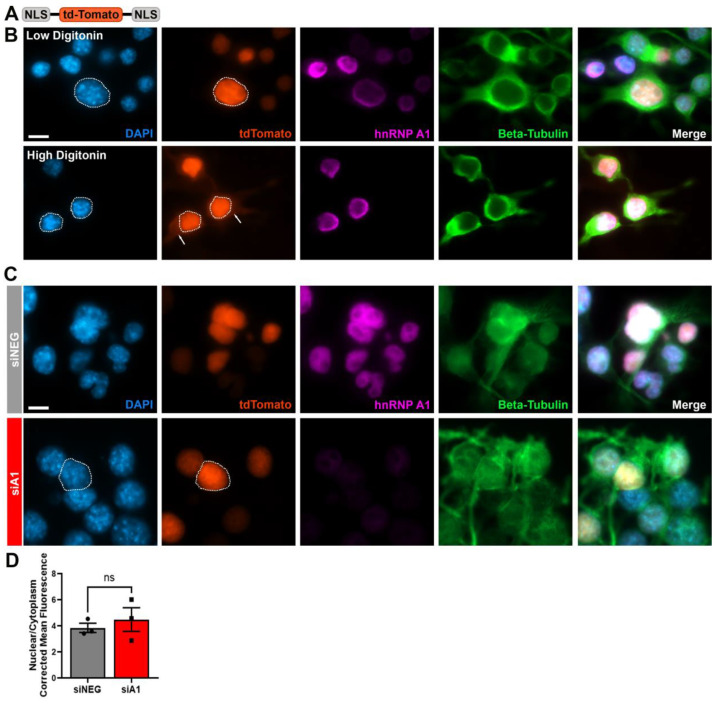
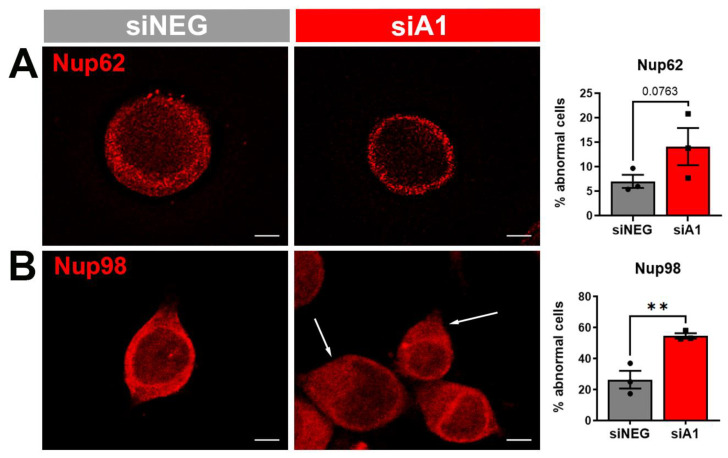
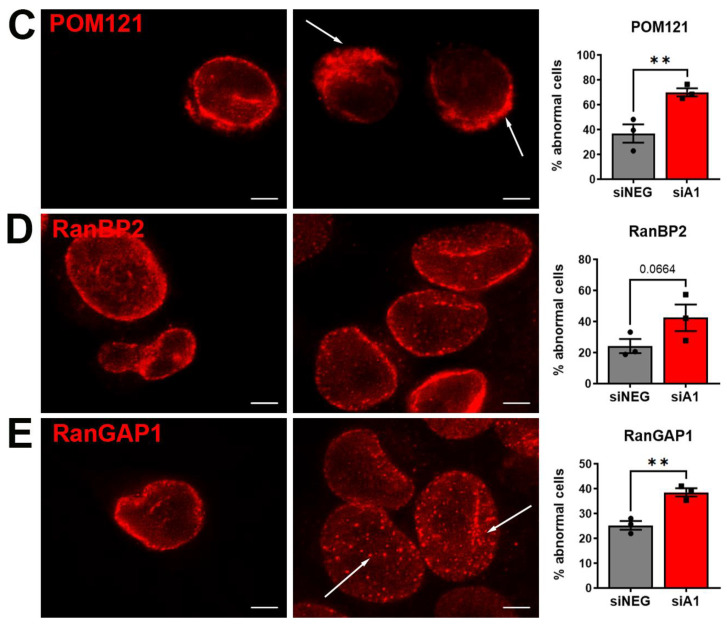
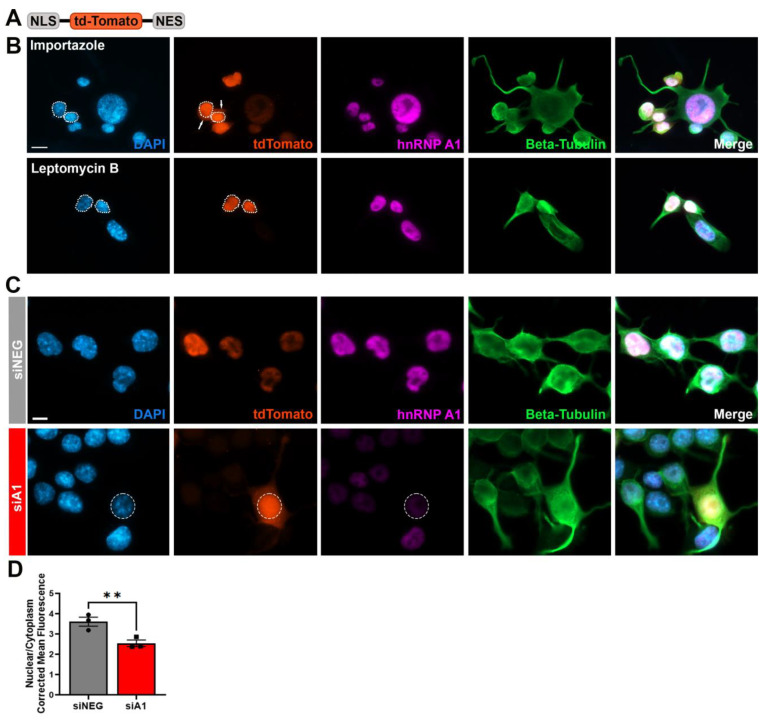
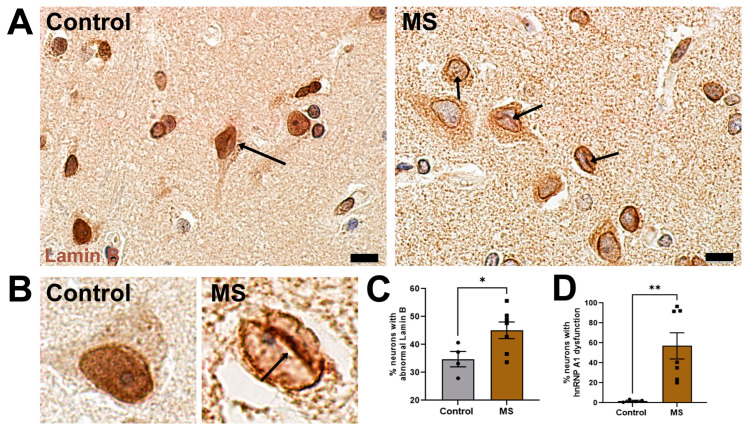
Results: First, we examined nuclear morphology using Lamin B, wherein we observed increased nuclear envelope abnormalities in cells with hnRNP A1 knockdown as compared to control. To quantify changes in Lamin B, we designed and validated an automated computer-based model, which quantitatively confirmed our observations. Next, we investigated the impact of hnRNP A1 knockdown on components of the NPC and NCT. In line with the previous literature, we found changes in Nups, including altered distribution and reduced protein expression, as well as disrupted NCT. Finally, we validated our findings in multiple sclerosis (MS) brains, a disease with a significant neurodegenerative component caused by hnRNP A1 dysfunction, where neuronal nuclear envelope alterations were significantly increased as compared to controls.

Conclusions: Together, these data implicate hnRNP A1 as an important contributor to nuclear morphology, Nup expression and distribution, and NCT and suggest that hnRNP A1 dysfunction may lead to defects in these processes in neurodegenerative diseases.

Keywords: RNA binding protein; hnRNP A1; nuclear pore complex; nucleocytoplasmic transport.


Conflict of interest statement

The authors declare no conflicts of interest.

Figures

Figure 1
Figure 1
hnRNP A1 knockdown alters mRNA transcripts related to pathways and components of NCT. (A) Bubble plot of significantly altered pathways related to the nuclear structure, NPC and NCT identified from GO analyses. The x-axis denotes the -log10 false discovery rate (FDR) value for each term while the y-axis is indicative of each individual GO term. Bubble size corresponds to the number of differentially expressed genes within the GO term and colors correspond to the different GO pathways. (B) Individually analyzed genes from the pathways in (A) comparing normalized RNAseq count values from siNEG- and siA1-treated cells. (C) Summary figure illustrating components of NCT, emphasizing where proteins encoded by genes from (B) are located (italicized targets). Created with BioRender.com. Data are graphed as mean ± SEM with n = 3 replicates. As siA1 was expected to produce a specific directional effect, a one-tailed independent t-test was used to compare means between siNEG and siA1 in (B), * p < 0.05 ** p < 0.01, *** p < 0.001.
Figure 2
Figure 2
hnRNP A1 knockdown increases the prevalence of abnormal Lamin B phenotypes. Cells were separated into distinct phenotypic categories based on the Lamin B staining pattern. Representative images for each phenotype were generated by deconvolving 40X Z-stack images. (A) Ring and diffuse phenotypes were considered normal based on the literature and their prevalence in siNEG-treated cells (B) Punctate, invagination, and incomplete phenotypes were considered abnormal, with arrows pointing to the phenotype-defining characteristic. (C) Quantification of the number of cells exhibiting normal and abnormal Lamin B phenotypes in siNEG- and siA1-treated cells, with a significant increase in the number of abnormal phenotypes with hnRNP A1 knockdown. (D) Assessment of individual normal Lamin B phenotypes demonstrated a significant decrease in ring, but not diffuse, phenotypes between siNEG- and siA1-treated cells. (E) Assessment of individual abnormal Lamin B phenotypes identified a significant increase in the invagination and incomplete phenotypes, but not the punctate phenotype, between groups. Data are graphed as mean ± SEM. Scale bars = 10 µm, n = 3 replicates. As siA1 was expected to produce a specific directional effect based on the RNA sequencing data, a one-tailed independent t-test was used to compare means between siNEG and siA1 in (CE), * p < 0.05, ns = not significant.
Figure 3
Figure 3
Establishing a method of automatic Lamin B phenotyping using 3D measurements. Three-dimensional renderings of Lamin B staining (white) were generated from a Z-stack of images. (A) The normal phenotypes, ring and diffuse, are visually distinct from the (B) abnormal phenotypes: punctate, invagination, and incomplete. Three-dimensional renderings were used to quantify each of the Lamin B phenotypes. (C) Schematic demonstrating how the five different phenotypes were separated and assigned to generate a novel automated phenotyping script. Cells were examined based on different 3D measurements (graphs) to separate normal (grey) and abnormal (red) phenotypes. After separating out an individual phenotype, the remaining cells (white) were assessed, based on another measurement, until all phenotypes could be mathematically grouped. Initially, the number of objects, which is the count of distinct, disconnected Lamin B objects in the cell, was used to define the punctate phenotype (i). Next, moment 3, a quantification of the 3D shape of Lamin B staining, was used to identify the invagination phenotype (ii). The remaining population was examined based on flatness, which is the depth of the staining in the third (z) dimension, and which defined the diffuse phenotype (iii). The last two phenotypes, ring and incomplete, could be separated based on their moment-3 measurement (iv). Scale bars = 10 µm, n = 3 replicates. Data are normalized to the values in the previous step (connecting node in C) within replicates and plotted as the mean ± SEM. Two-tailed independent t-tests were used to compare means between groups, as the expected effect was unknown, * p < 0.05, ** p < 0.01.
Figure 4
Figure 4
Nuclear envelope integrity is not compromised by hnRNP A1 knockdown. (A) Schematic of the 2xNLS-tdTomato plasmid used for the nuclear envelope integrity assay. (B) Cells were treated with a low concentration of digitonin (low digitonin; 20 µg for 4 min) or a high concentration of digitonin (high digitonin; 40 µg for 10 min) as controls, to visualize tdTomato localization patterns. In the low-digitonin condition, only plasma membrane is permeabilized and therefore, the tdTomato signal was predominantly nuclear. High concentrations of digitonin permeabilized the nuclear envelope and induced tdTomato leakage into the cytoplasm, indicated by tdTomato signal within the cytoplasm (arrows). (C) Comparison of tdTomato localization signal in siNEG- and siA1-treated cells. Dotted lines outline the nucleus, which were created using the corresponding DAPI image. There were no changes in cellular distribution of tdTomato signal in siNEG- compared to siA1-treated cells. (D) Quantification of the nuclear-to-cytoplasmic ratio of tdTomato signal showing no quantitative difference between siNEG- and siA1-treated cells. Data are graphed as mean ± SEM. Scale bars = 10 µm, n = 3 replicates. As siA1 was expected to produce a specific directional effect, a one-tailed independent t-test was used to compare means between siNEG and siA1 in (D), ns = not significant.
Figure 5
Figure 5
hnRNP A1 knockdown induces phenotypic changes in several components of NCT, including Nups. Cells treated with siNEG or siA1 were evaluated for phenotype abnormalities in several components of NCT, including (A) Nup62 and (B) Nup98, both part of the central channel of the NPC, (C) POM121, a component of the NPC transmembrane ring, (D) RanBP2 within the cytoplasmic ring and filaments, and (E) RanGAP1, which is involved in transport. Cells treated with siA1 showed an increase in the number of cells with Nup98, POM121, and RanGAP1 phenotype abnormalities as compared to siNEG. Arrows point to different features defined as abnormal for each marker. No significant differences in the number of cells with alterations were found for Nup62 or RanBP2 between the groups. Representative images for each marker were generated by deconvolving 40X Z-stack images. Data are graphed as the mean ± SEM. Scale bars = 5 µm, n = 3 replicates. As siA1 was expected to produce a specific directional effect, a one-tailed independent t-test was used to compare means between siNEG and siA1, ** p < 0.01.
Figure 5
Figure 5
hnRNP A1 knockdown induces phenotypic changes in several components of NCT, including Nups. Cells treated with siNEG or siA1 were evaluated for phenotype abnormalities in several components of NCT, including (A) Nup62 and (B) Nup98, both part of the central channel of the NPC, (C) POM121, a component of the NPC transmembrane ring, (D) RanBP2 within the cytoplasmic ring and filaments, and (E) RanGAP1, which is involved in transport. Cells treated with siA1 showed an increase in the number of cells with Nup98, POM121, and RanGAP1 phenotype abnormalities as compared to siNEG. Arrows point to different features defined as abnormal for each marker. No significant differences in the number of cells with alterations were found for Nup62 or RanBP2 between the groups. Representative images for each marker were generated by deconvolving 40X Z-stack images. Data are graphed as the mean ± SEM. Scale bars = 5 µm, n = 3 replicates. As siA1 was expected to produce a specific directional effect, a one-tailed independent t-test was used to compare means between siNEG and siA1, ** p < 0.01.
Figure 6
Figure 6
hnRNP A1 knockdown leads to deficits in active NCT. (A) Schematic of the S-tdTomato plasmid used to evaluate active NCT. (B) Cells were treated with Importazole, a nuclear import inhibitor or Leptomycin B, a nuclear export inhibitor to visualize localization of tdTomato signal. As a nuclear import inhibitor, Importazole induced cytoplasmic accumulation of tdTomato signal (arrows) while Leptomycin, a nuclear export inhibitor, led to nuclear localization of tdTomato. Dotted lines outline the nucleus, which were created using the corresponding DAPI image. Scale bar = 20 µm. (C) Representative images of cells co-transfected with S-tdTomato and siNEG or siA1. siNEG cells showed nuclear localization of tdTomato signal, while cells treated with siA1 demonstrated cytoplasmic localization of tdTomato signal. Dotted lines outline the nucleus, which were created using the corresponding DAPI image. (D) Quantification of the nuclear-to-cytoplasmic ratio of tdTomato signal, showing a significant decrease in the nuclear/cytoplasmic ratio in cells treated with siA1. Scale bar = 10 µm, n = 3 replicates. Data are plotted as mean ± SEM. As siA1 was expected to produce a specific directional effect, a one-tailed independent t-test was used to compare means between siNEG and siA1 in (D), ** p < 0.01.
Figure 7
Figure 7
Lamin B phenotype abnormalities are prevalent in MS tissues. (A) Control and MS grey matter stained for Lamin B (brown) and hematoxylin (blue). Arrows point to normal (control) and abnormal (MS) phenotypes. (B) Higher magnification of neurons from control and MS grey matter illustrating phenotypes from the respective groups. Neurons from MS samples demonstrate Lamin B invagination phenotypes (arrow) among other abnormal phenotypes. (C) Quantification of the percent of neurons exhibiting abnormal Lamin B phenotypes and (D) hnRNP A1 dysfunction in cortex from control and MS samples. Data are plotted as mean ± SEM. Scale bars = 10 µm, n = 4 control and n = 7 MS cases. The percent of abnormal phenotypes in human samples was normally distributed (Shapiro–Wilk W: Control W = 0.9232, p = 0.5505; MS W = 0.9811, p = 0.9877) and the variance between the two samples was statistically equal (F-test: F11,4 = 1.863, p = 0.5761). Therefore, an independent t-test was used to analyze the samples, * p < 0.05.

Similar articles

References

    1. De Conti L., Baralle M., Buratti E. Neurodegeneration and RNA-binding proteins. Wiley Interdiscip. Rev. RNA. 2017;8:e1394. doi: 10.1002/wrna.1394. - DOI - PubMed
    1. Hentze M.W., Castello A., Schwarzl T., Preiss T. A brave new world of RNA-binding proteins. Nat. Rev. Mol. Cell Biol. 2018;19:327–341. doi: 10.1038/nrm.2017.130. - DOI - PubMed
    1. Clarke J.P., Thibault P.A., Salapa H.E., Levin M.C. A Comprehensive Analysis of the Role of hnRNP A1 Function and Dysfunction in the Pathogenesis of Neurodegenerative Disease. Front. Mol. Biosci. 2021;8:659610. doi: 10.3389/fmolb.2021.659610. - DOI - PMC - PubMed
    1. Janssens J., Van Broeckhoven C. Pathological mechanisms underlying TDP-43 driven neurodegeneration in FTLD-ALS spectrum disorders. Hum. Mol. Genet. 2013;22:R77–R87. doi: 10.1093/hmg/ddt349. - DOI - PMC - PubMed
    1. Salapa H.E., Johnson C., Hutchinson C., Popescu B.F., Levin M.C. Dysfunctional RNA binding proteins and stress granules in multiple sclerosis. J. Neuroimmunol. 2018;324:149–156. doi: 10.1016/j.jneuroim.2018.08.015. - DOI - PubMed

LinkOut - more resources