. 2024 Oct 9;14(10):539.
doi: 10.3390/metabo14100539.

Untargeted Metabolite Profiling Reveals Acute Toxicity of Pentosidine on Adipose Tissue of Rats

Affiliations

Untargeted Metabolite Profiling Reveals Acute Toxicity of Pentosidine on Adipose Tissue of Rats

Chuanqin Hu et al. Metabolites. .

Abstract

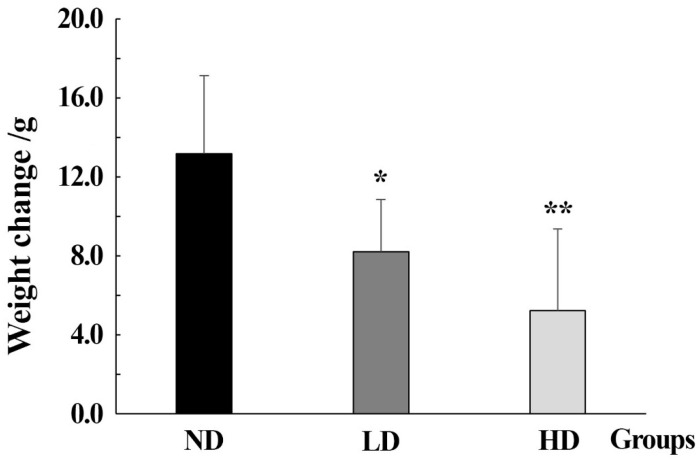
Background: Pentosidine is an advanced glycation end product that is commonly found in heat-processed foods. Pentosidine has been involved in the occurrence and development of some chronic diseases. It was reported that pentosidine exposure can impair the function of the liver and kidneys. Adipose tissue, as an active endocrine organ, plays an important role in maintaining the normal physiological function of cells. However, the metabolic mechanism that causes pentosidine to induce toxicity in adipose tissue remains unclear. Methods: In the study, thirty male Sprague-Dawley rats were divided into a normal diet group, low dose group, and high dose group. A non-targeted metabolomics approach was used to compare the metabolic profiles of adipose tissue between the pentosidine and normal diet groups. Furthermore, histopathological observation and body weight change analysis were performed to test the results of the metabolomics analysis. Results: A total of forty-two differential metabolites were identified. Pentosidine mainly disturbed twelve metabolic pathways, such as ascorbate and aldarate metabolism, glycine, serine, and threonine metabolism, sulfur metabolism, pyruvate metabolism, etc. Additionally, pyruvic acid was identified as a possible key upregulated metabolite involved in thirty-four metabolic pathways. α-Ketoglutaric acid was named as a probable key downregulated metabolite involved in nineteen metabolic pathways based on enrichment network analysis. In addition, histopathological analysis and body weight changes confirmed the results of the metabolomics analysis. Conclusions: These results provided a new perspective for the molecular mechanisms of adipose tissue toxicity induced by pentosidine.

Keywords: food safety; mass spectrometry; metabolomics; pentosidine; untargeted metabolite profiling.


Conflict of interest statement

The authors declare no conflicts of interest.

Figures

Figure 1
Figure 1
Weight changes in rats in ND, LD, and HD groups. Data were expressed as mean ± standard deviation (SD). Differences in different groups were evaluated by t-test, “*” represents p < 0.05, “**” represents p < 0.01. ND group: normal diet group, n = 10; LD group: low dose group, n = 10; HD group: high dose group, n = 10.
Figure 2
Figure 2
H&E staining images of adipose tissue from ND, LD, and HD groups (original magnification: 400×). Black arrows: damaged cell membranes; barred arrows: distorted cell contours; doubleheaded arrows: blurred cell contours; dashed arrows: inflammatory cell. ND: normal diet group; LD: low dose group; HD: high dose group.
Figure 3
Figure 3
Multivariate statistical analysis of results from GC−MS analysis. (A) PCA score plot analysis (R2X =74.2%, Q2 = 49.9%); (B) PLS−DA score plot analysis (R2X = 81.9%, R2Y = 99.4%, Q2 = 92.8%); (C) permutation plot for PLS−DA model (n = 999), R2 = (0.0, 0.253), Q2 = (0.0, − 0.177). PCA: principal component analysis; PLS−DA: partial least squares discriminant analysis; ND: normal diet group, n = 10; LD: low dose group, n = 10; HD: high dose group, n = 10; QC: quality control.
Figure 4
Figure 4
Boxplots of differential metabolites in adipose tissue of rats in ND, LD, and HD groups. Differences in different groups were evaluated by Mann–Whitney U test. “*” means p < 0.05, “**” means p < 0.01, “***” means p < 0.001. ND group: normal diet group, n = 10; LD group: low dose group, n = 10; HD group: high dose group, n = 10.
Figure 5
Figure 5
Disturbed pathways in adipose tissue of rats from ND, LD, and HD groups. Node color in pathway analysis represented its p-value; node radius reflected their pathway impact values. (1) Ascorbate and aldarate metabolism, (2) glycine, serine, and threonine metabolism, (3) sulfur metabolism, (4) pyruvate metabolism, (5) aminoacyl−tRNA biosynthesis, (6) alanine, aspartate, and glutamate metabolism, (7) glyoxylate and dicarboxylate metabolism, (8) citrate cycle (TCA cycle), (9) glycolysis/gluconeogenesis, (10) inositol phosphate metabolism, (11) cysteine and methionine metabolism, (12) pentose and glucuronate interconversions. ND group: normal diet group, n = 10; LD group: low dose group, n = 10; HD group: high dose group, n = 10.
Figure 6
Figure 6
Pathway mapping of differential metabolites detected in HD group compared to ND group. Metabolic pathway generated through MetaMapp and drawn by Cytoscape. The depicted network reveals that red nodes represent significantly upregulated metabolites, blue nodes show remarkably downregulated metabolites, and gray nodes reveal no significant changes in metabolites. Size of node is positively correlated with fold change between HD group and ND group. ND group: normal diet group, n = 10; LD group: low dose group, n = 10; HD group: high dose group.
Figure 7
Figure 7
Network analysis of differential metabolites and metabolic pathways in pentosidine-exposed groups shows that there are forty-two differential metabolites. “*” represents p < 0.05, “**” represents p < 0.01, “***” represents p < 0.001. The red circles and black circles show upregulated and downregulated metabolites, respectively. Intensity of colors indicates fold changes in metabolites. A total of seventy-two metabolic pathways are classified as eight metabolic pathways (Table S3) and connected to different metabolites by the red line (upregulated) and black line (downregulated).
Figure 8
Figure 8
Interplay between differential metabolites in HD group compared to ND group. Metabolic pathways are illustrated based on information obtained from KEGG database. Red boxes represent increased metabolites, blue boxes show decreased metabolites, blank boxes reveal no significant changes in metabolites. Numbers 1 to 12 represent metabolic pathways with impact value larger than 0.1 (Figure 5). ND group: normal diet group, n = 10; LD group: low dose group, n = 10; HD group: high dose group, n = 10.

Similar articles

References

    1. Li H., Yu S.J. Review of pentosidine and pyrraline in food and chemical models: Formation, potential risks and determination. J. Sci. Food Agr. 2018;98:3225–3233. doi: 10.1002/jsfa.8853. - DOI - PubMed
    1. Deramon E.A., Sabbasani V.R., Streeter M.D., Liu Y.N., Newhouse T.R., Mcdonald D.M., Spiegel D.A. Pentosinane, a post-translational modification of human proteins with underappreciated stability. J. Am. Chem. Soc. 2022;144:21843–21847. doi: 10.1021/jacs.2c09626. - DOI - PMC - PubMed
    1. Cui H.P., Yu J.H., Zhai Y., Feng L.H., Chen P.S., Hayat K., Xu Y., Zhang X.M., Ho C.T. Formation and fate of Amadori rearrangement products in Maillard reaction. Trends Food Sci. Tech. 2021;115:391–408. doi: 10.1016/j.tifs.2021.06.055. - DOI
    1. Qu W., Nie C., Zhao J., Ou X., Zhang Y., Yang S., Bai X., Wang Y., Wang J., Li J. Microbionne-metabolomics analysis of the impacts of long-term dietary advanced-glycation-end-product consumption on C57BL/6 mouse fecal microbiota and metabolites. J. Agric. Food Chem. 2018;66:8864–8875. doi: 10.1021/acs.jafc.8b01466. - DOI - PubMed
    1. Chao P.C., Hsu C.C., Yin M.C. Analysis of glycative products in sauces and sauce-treated foods. Food Chem. 2009;113:262–266. doi: 10.1016/j.foodchem.2008.06.076. - DOI

LinkOut - more resources