. 2024 Oct 17;14(10):557.
doi: 10.3390/metabo14100557.

Causal Metabolomic and Lipidomic Analysis of Circulating Plasma Metabolites in Autism: A Comprehensive Mendelian Randomization Study with Independent Cohort Validation

Affiliations

Causal Metabolomic and Lipidomic Analysis of Circulating Plasma Metabolites in Autism: A Comprehensive Mendelian Randomization Study with Independent Cohort Validation

Zhifan Li et al. Metabolites. .

Abstract

Background: The increasing prevalence of autism spectrum disorder (ASD) highlights the need for objective diagnostic markers and a better understanding of its pathogenesis. Metabolic differences have been observed between individuals with and without ASD, but their causal relevance remains unclear.

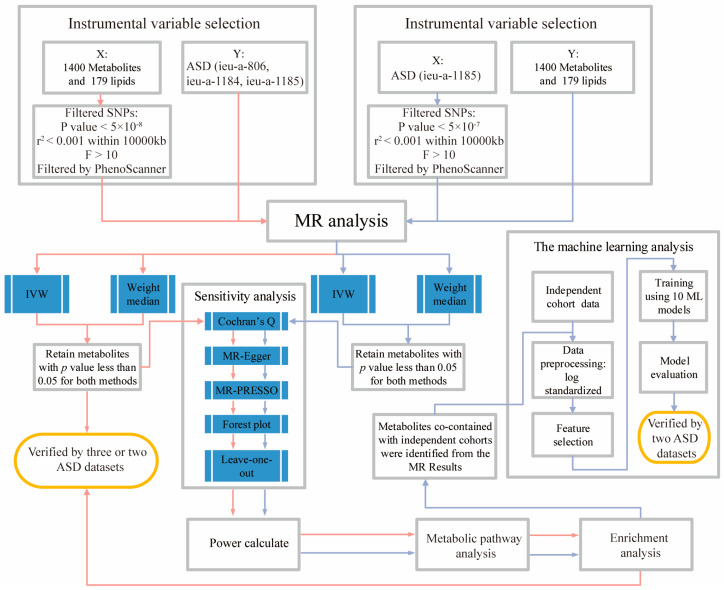
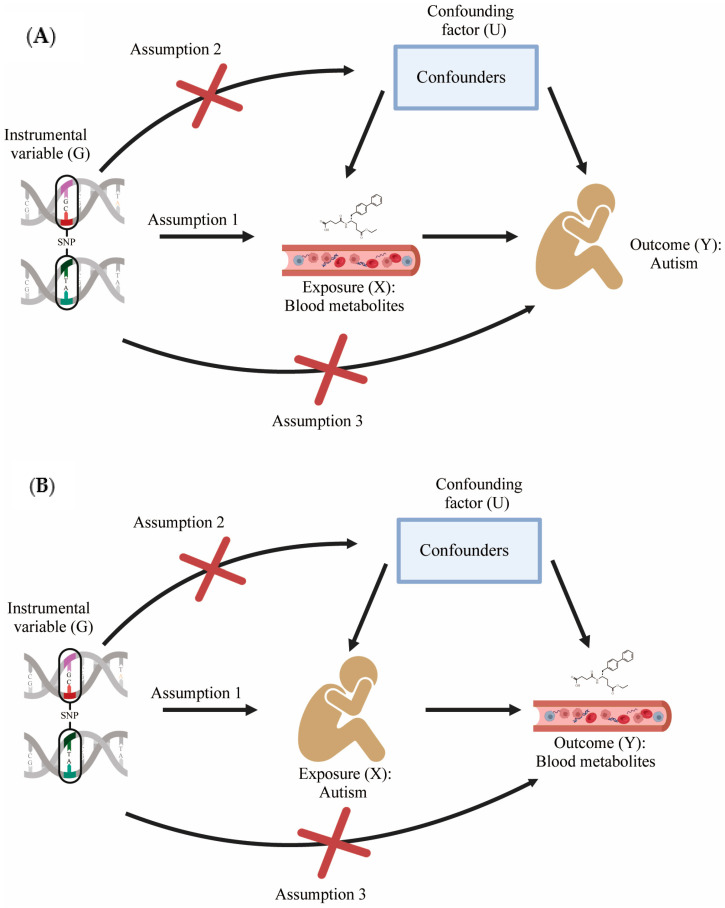
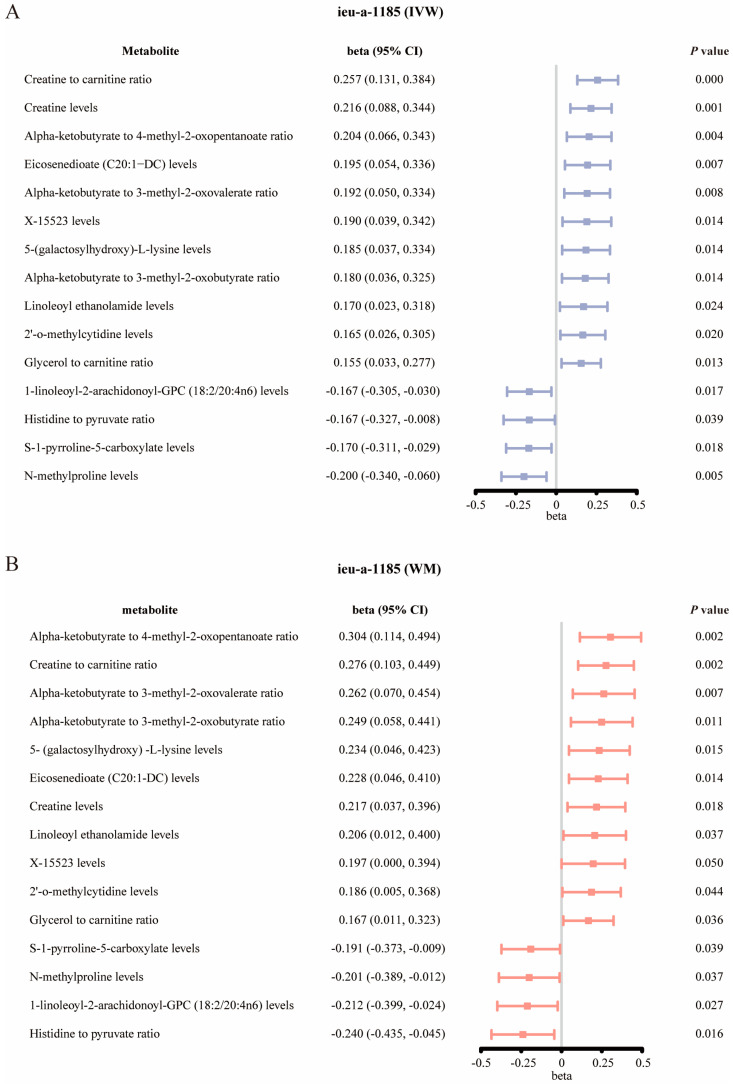
Methods: Bidirectional two-sample Mendelian randomization (MR) was used to assess causal associations between circulating plasma metabolites and ASD using large-scale genome-wide association study (GWAS) datasets-comprising 1091 metabolites, 309 ratios, and 179 lipids-and three European autism datasets (PGC 2015: n = 10,610 and 10,263; 2017: n = 46,351). Inverse-variance weighted (IVW) and weighted median methods were employed, along with robust sensitivity and power analyses followed by independent cohort validation.

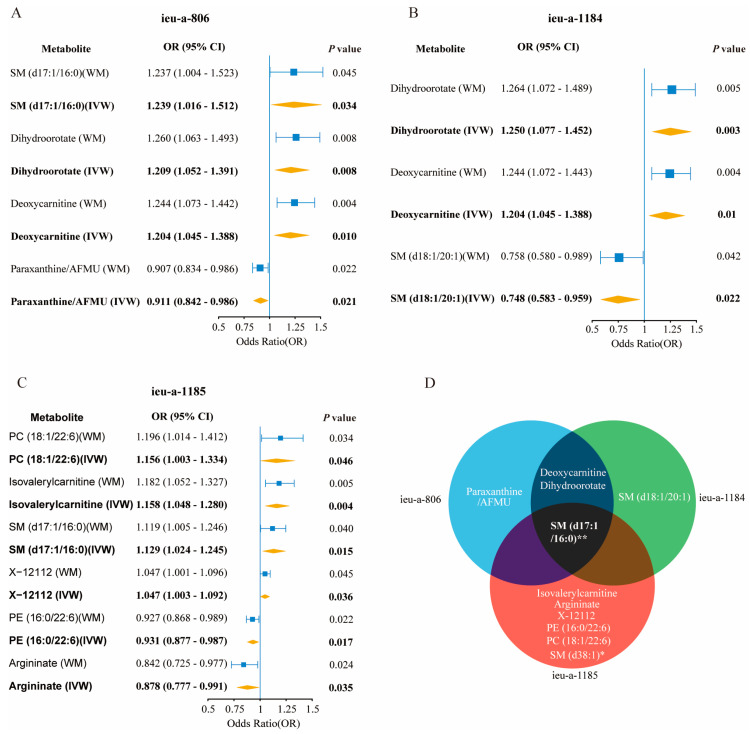
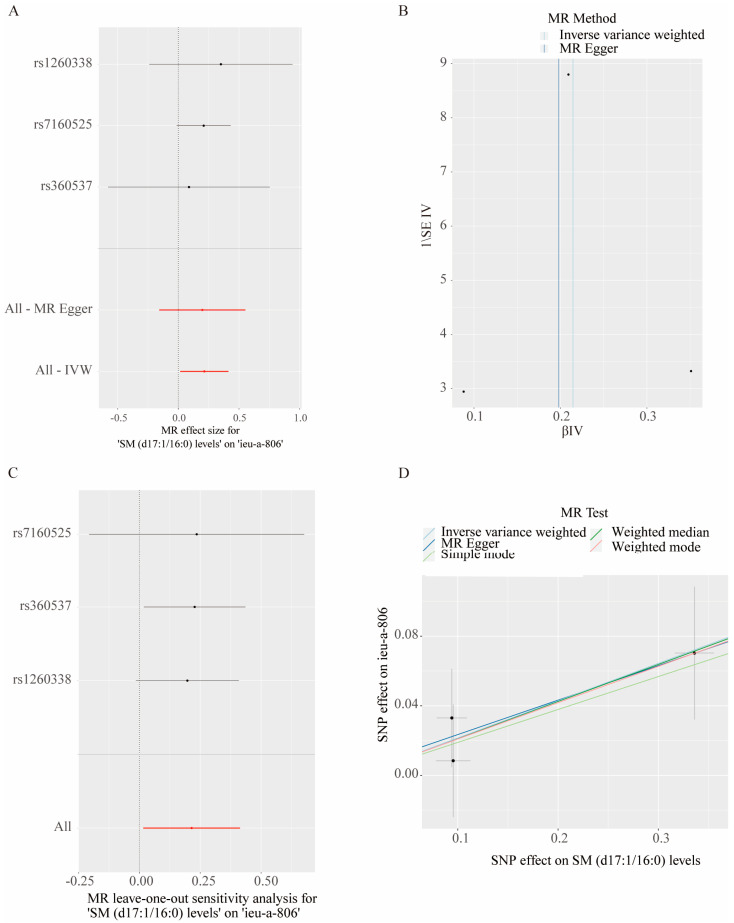
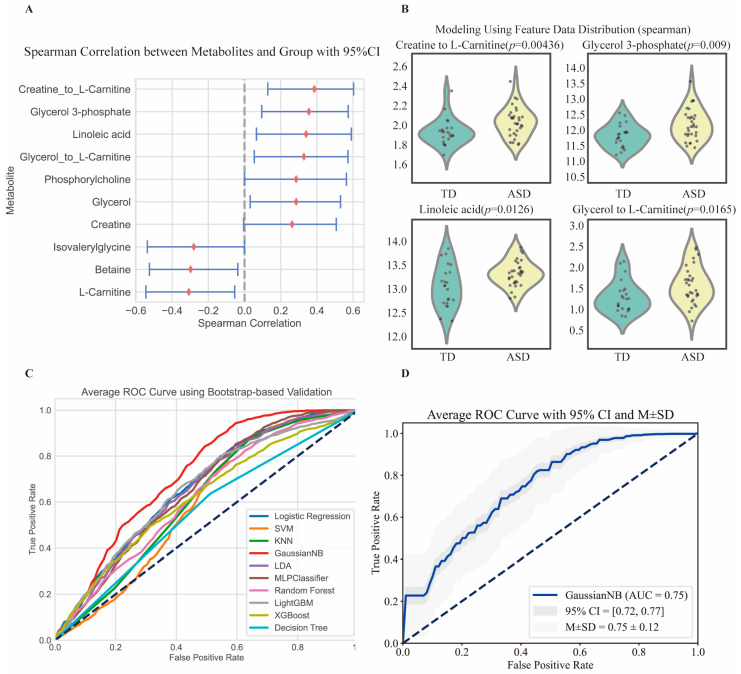
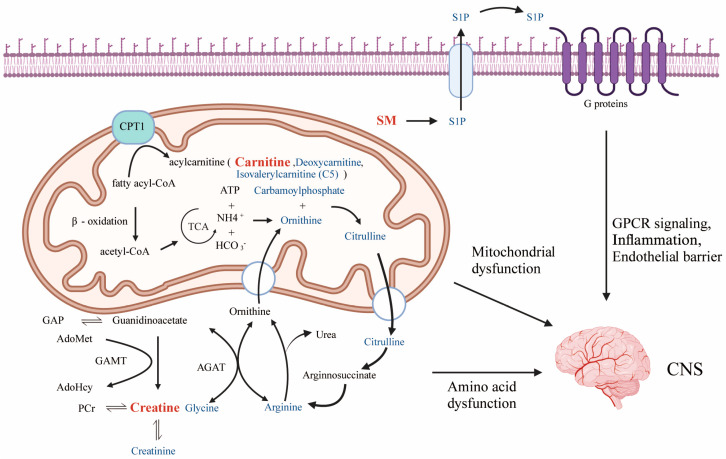
Results: Higher genetically predicted levels of sphingomyelin (SM) (d17:1/16:0) (OR, 1.129; 95% CI, 1.024-1.245; p = 0.015) were causally linked to increased ASD risk. Additionally, ASD children had higher plasma creatine/carnitine ratios. These MR findings were validated in an independent US autism cohort using machine learning analysis.

Conclusion: Utilizing large datasets, two MR approaches, robust sensitivity analyses, and independent validation, our novel findings provide evidence for the potential roles of metabolomics and circulating metabolites in ASD diagnosis and etiology.

Keywords: Mendelian randomization; autism spectrum disorder; causal inference; cohort validation; machine learning; metabolites.


Conflict of interest statement

The authors declare no conflicts of interest.

Figures

Figure 3
Figure 3
The genetically predicted changes in the plasma metabolite levels causally linked to autism. (AC) The significant associations between plasma circulating metabolites and autism in the GWAS ieu-a-806 (A), ieu-a-1184 (B), and ieu-a-1185 (C) datasets, identified with two Mendelian randomization (MR) methods. The odds ratios represent the risk of developing autism compared to controls. Only metabolites with significant associations (p < 0.05) in both the inverse-variance weighted (IVW) and weighted median (WM) methods are shown. (D) A shared metabolite across three autism datasets, for which its genetically predicted concentration changes in plasma were associated with the occurrence of autism. *: 179 lipid group data for exposure, and the p-values of WM and IVW in the ieu-a-1185 dataset were both less than 0.05. **: The p-values of SM (d17:1/16:0) were <0.05 for both WM and IVW in the ieu-a-806 and ieu-a-1185 datasets, and they were significant only for the IVW method in the ieu-a-1184 dataset. The GWAS data for plasma metabolites were used as the exposure, and the ASD GWAS data were used as the outcomes. Abbreviations: WM: weighted median; IVW: inverse-variance weighted; SM: Sphingomyelin; AFMU: 5-acetylamino-6-formylamino-3-methyluracil; PC: phosphatidylcholine; X-12112: unidentified metabolite; PE: phosphatidylethanolamine.
Figure 1
Figure 1
The entire flowchart of the experiment. Bidirectional two-sample MR analysis was used to explore the causal relationships between metabolites and ASD. Causal estimates in the MR analysis were considered statistically significant if the inverse-variance weighted (IVW) results yielded a p < 0.05, accompanied by weighted median results with a p < 0.05. In order to ensure the reliability of the study results, we performed a series of sensitivity analyses and calculated the power. In our reverse MR analysis, in order to prevent the unreliable results of a single ASD dataset, we also used a separate queue of another ASD dataset and added machine learning methods for validation. The results of forward MR were corroborated by at least two ASD datasets among ieu-a-806, ieu-a-1184, and ieu-a-1185. The reverse MR findings were validated using the ieu-a-1185 dataset and an independent cohort. Abbreviations: IVW: Inverse-variance weighted; r2: R-squared. The extent to which genetic variation explains the variation in exposure factors (risk factors); F: F statistic. Red line: The forward MR analysis process. Blue line: The reverse MR analysis process.
Figure 2
Figure 2
Three hypotheses of MR and rules for data sources and SNP screening. (A) Forward MR process. (B) Reverse MR process; SNPs: single-nucleotide polymorphisms. Assumption 1: Instrumental variables must be strongly correlated with exposure factor X. Assumption 2: Instrumental variables cannot be associated with any possible confounders. Assumption 3: Instrumental variables cannot be directly related to the outcome.
Figure 4
Figure 4
Various sensitivity analyses showed the robustness of the causal associations between metabolites and autism. (A) The forest plot shows no heterogeneity in causal effects amongst the instruments. Each black point represents the effect size for ASD per the standard deviation (SD) increase in the SM (d17:1/16:0), produced using each SNP as a separate instrument, and red points show the combined causal estimate using all SNPs together in a single instrument—using two different methods, including the inverse-variance weighted (IVW) and MR-Egger methods. Horizontal lines denote 95% confidence intervals. (B) The funnel plot shows the relationship between the causal effect of SM (d17:1/16:0) and ASD estimated using each individual SNP as a separate instrument against the inverse of the SE of the causal estimate. The vertical lines show the causal estimates using all the SNPs combined into a single instrument for each of the two different methods. Asymmetry in the funnel plot may be indicative of violations of the instrumental variable (IV) through horizontal pleiotropy. (C) The leave-one-out sensitivity analysis indicated that there are no instances in which the exclusion of one particular SNP leads to dramatic changes in the overall result. Each black point represents the IVW MR method applied to estimate the causal effect of SM (d17:1/16:0) on ASD, excluding that particular variant from the analysis. The red point depicts the IVW estimate using all the SNPs. (D) The scatter plot summarizes the MR estimates using the 5 methods of statistics. The β-value with the standard error (SE) is plotted to demonstrate the effect estimate of each single nucleotide polymorphism (SNP) for the causal association of SM (d17:1/16:0) (x-axis) with ASD (y-axis). The slope of each line represents the two-sample MR estimate (β-value) for the individual SNP. The error bar represents the SE of the effect size. SM (d17:1/16:0) was used as a representative exposure, and the autism GWAS ieu-a-806 dataset was used as a representative outcome.
Figure 5
Figure 5
The changes in circulating plasma metabolites causally associated with genetically predicted autism. (A,B) The significant associations between genetically predicted autism (ieu-a-1185) and circulating plasma metabolites, identified using the inverse-variance weighted (IVW) random-effect method (A) and the weighted median method (B). Beta values (effect sizes) and 95% confidence intervals (CIs) indicate the magnitude of metabolite concentration changes in autism patients versus controls. A beta value < 0 denotes a decreased metabolite concentration. Abbreviation: GPC: glycerylphosphorylcholine.
Figure 6
Figure 6
The validation of autism with the associated plasma circulating metabolites identified via MR analysis using an independent cohort. (A) Autism exhibited a robust correlation with specific plasma metabolites and their respective ratios. A Spearman rank correlation analysis was conducted to quantify these relationships, with the resulting correlation coefficients (r) and their corresponding 95% CI graphically represented. (B) The violin plots show the distribution of the four metabolites used in our final modeling between the ASD patients and controls, as well as the p-values. (C) The ROC comparison among ten ML models is shown, where the Gaussian naive Bayes (GaussianNB) ROC value is the highest. (D) The ROC curve analysis demonstrates good performance in differentiating autism from the control group using the plasma metabolites identified via MR analysis. The GaussianNB method was used for model construction. The raw metabolomics data were contributed by et al. [15]. The dataset includes 31 autistic children and 22 typically developing controls. Please refer to the previous publication for details on patient enrollment and mass spectrometry data collection.
Figure 7
Figure 7
Enrichment analysis and pathway analysis of MR results. (A) Carnitine synthesis, glycine and serine metabolism, caffeine metabolism, and ammonia recycling exhibit significance in ASD. (B) Pathway analysis identified caffeine metabolism, glycerolipid metabolism, histidine metabolism, and valine, leucine, and isoleucine biosynthesis as significantly altered metabolic pathways in patients with ASD.
Figure 8
Figure 8
We identified in our study the primary metabolic pathways exhibiting alterations in autism, specifically noting changes in mitochondrial function, fatty acid metabolism, amino acid metabolism, creatine metabolism, and sphingolipid metabolism. Carnitine plays a pivotal role in facilitating the translocation of fatty acids into the mitochondrial matrix via the CPT1 system, where these substrates undergo β-oxidation for energy production. Perturbations in this process can lead to impaired mitochondrial function and compromised energy homeostasis. Creatine synthesis is catalyzed by the sequential actions of AGAT and GAMT. Disturbance of amino acid metabolism and related physiological processes in ASD patients may lead to deviations in creatine levels in the body. SM is an integral component of the S1P signaling pathway, which plays a pivotal role in regulating inflammation, GPCR signaling, and endothelial barrier integrity. Dysregulated SM levels can lead to inflammatory diseases, abnormal GPCR signaling cascades, and neuroinflammation. Abbreviations: SM: Sphingomyelin; CPT1: carnitine palmitoyltransferase; GAMT: guanidinoacetate N-methyltransferase; AGAT: arginine:glycine amidinotransferase; S1P: sphingosine-1-phosphate; GPCR: G protein-coupled receptor; CNS: central nervous system.

Similar articles

References

    1. Myers S.M., Voigt R.G., Colligan R.C., Weaver A.L., Storlie C.B., Stoeckel R.E., Port J.D., Katusic S.K. Autism Spectrum Disorder: Incidence and Time Trends Over Two Decades in a Population-Based Birth Cohort. J. Autism Dev. Disord. 2019;49:1455–1474. doi: 10.1007/s10803-018-3834-0. - DOI - PMC - PubMed
    1. Galal A., Talal M., Moustafa A. Applications of machine learning in metabolomics: Disease modeling and classification. Front. Genet. 2022;13:1017340. doi: 10.3389/fgene.2022.1017340. - DOI - PMC - PubMed
    1. Hyman S.L., Levy S.E., Myers S.M., Council on Children with Disabilities, Section on Developmental and Behavioral Pediatrics. Kuo D.Z., Apkon S., Davidson L.F., Ellerbeck K.A., Foster J.E., Noritz G.H., et al. Identification, Evaluation, and Management of Children with Autism Spectrum Disorder. Pediatrics. 2020;145:e20193447. doi: 10.1542/peds.2019-3447. - DOI - PubMed
    1. Lyall K., Croen L., Daniels J., Fallin M.D., Ladd-Acosta C., Lee B.K., Park B.Y., Snyder N.W., Schendel D., Volk H., et al. The Changing Epidemiology of Autism Spectrum Disorders. Annu. Rev. Public Health. 2017;38:81–102. doi: 10.1146/annurev-publhealth-031816-044318. - DOI - PMC - PubMed
    1. Hodges H., Fealko C., Soares N. Autism spectrum disorder: Definition, epidemiology, causes, and clinical evaluation. Transl. Pediatr. 2020;9((Suppl. S1)):S55–S65. doi: 10.21037/tp.2019.09.09. - DOI - PMC - PubMed

LinkOut - more resources