. 2024 Oct 15;12(10):750.
doi: 10.3390/toxics12100750.

Prediction of Dynamic Toxicity of Nanoparticles Using Machine Learning

Affiliations

Prediction of Dynamic Toxicity of Nanoparticles Using Machine Learning

Ivan Khokhlov et al. Toxics. .

Abstract

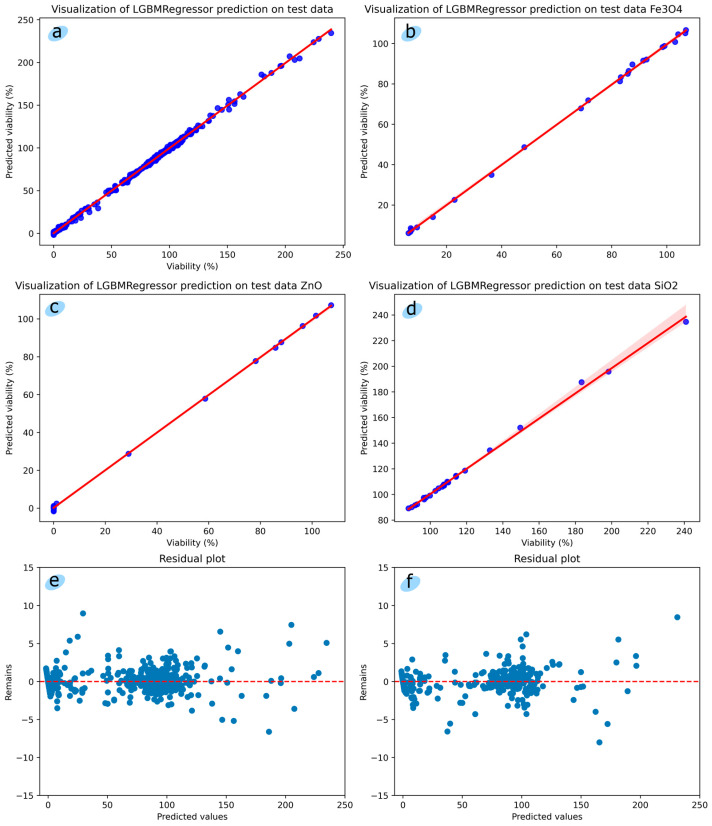
Predicting the toxicity of nanoparticles plays an important role in biomedical nanotechnologies, in particular in the creation of new drugs. Safety analysis of nanoparticles can identify potentially harmful effects on living organisms and the environment. Advanced machine learning models are used to predict the toxicity of nanoparticles in a nutrient solution. In this article, we performed a comparative analysis of the current state of research in the field of nanoparticle toxicity analysis using machine learning methods; we trained a regression model for predicting the quantitative toxicity of nanoparticles depending on their concentration in the nutrient solution at a fixed point in time with the achieved metrics values of MSE = 2.19 and RMSE = 1.48; we trained a multi-class classification model for predicting the toxicity class of nanoparticles depending on their concentration in the nutrient solution at a fixed point in time with the achieved metrics values of Accuracy = 0.9756, Recall = 0.9623, F1-Score = 0.9640, and Log Loss = 0.1855. As a result of the analysis, we concluded the good predictive ability of the trained models. The optimal dosages for the nanoparticles under study were determined as follows: ZnO = 9.5 × 10⁻⁵ mg/mL; Fe3O4 = 0.1 mg/mL; SiO2 = 1 mg/mL. The most significant features of predictive models are the diameter of the nanoparticle and the nanoparticle concentration in the nutrient solution.

Keywords: artificial intelligence; nanoparticles; prediction; toxicity.


Conflict of interest statement

The authors declare no conflicts of interest.

Figures

Figure 1
Figure 1
Fragment of the obtained LumenTox dataset.
Figure 2
Figure 2
(a) SHAP model of each feature contribution to the model outcome (b) radar chart comparing seven physicochemical attributes of three nanoparticles and the full LumenTox dataset.
Figure 3
Figure 3
(ad) scatter plots with regression line, (e) residual plot without cross-validation, (f) residual plot with cross-validation. The horizontal line y = 0 is a line representing zero error. The blue dots represent data points, each data point has one residual, i.e. vertical distance between a data point and the regression line.
Figure 4
Figure 4
Scatter plot difference between the two maximum probabilities of the object class.
Figure 5
Figure 5
(a) Cook’s Distance vs. predicted values; (b) DFITS vs. predicted values; and (c) Leverage vs. predicted values. For the Cook’s Distance the horizontal line is a line representing threshold below which objects are considered to have little influence on the model. Each blue dot displays the Cook’s Distance value for a specific observation. For the DFITS the horizontal line is a line representing threshold, the point where DFITS values close to 0 indicate that the observation has little influence on the model. Each blue dot displays the DFITS value for a specific observation. For the Leverage the horizontal line is a line representing the baseline, Leverage determines how “far” the observation is from the rest of the predictors. Each blue dot displays the Leverage value for a specific observation.
Figure 6
Figure 6
(ac) graphs of cell viability depending on the concentration of nanoparticles in the nutrient solution; (d) dynamics of toxicity for nanoparticles SiO2, Fe3O4, and и ZnO.
Figure 7
Figure 7
Normalized confusion matrix of trained LightGBMClassifier to predict toxicity class.
Figure 8
Figure 8
(a) ROC curves and (b) Precision-Recall curves of seven classes of toxicity. Dashed line represents the ROC curve for a random guess.
Figure 9
Figure 9
Visualization of one of the decision trees for the trained LGBMClassifier model.
Figure 10
Figure 10
Normalized confusion matrix of trained LightGBMClassifier to predict toxicity class of new Mn2O3 nanoparticle.
Figure 11
Figure 11
Normalized confusion matrix of trained LightGBMClassifier to predict toxicity class of new Co3O4 nanoparticle.

Similar articles

Cited by

References

    1. Ramos A.P., Cruz M.A., Tovani C.B., Ciancaglini P. Biomedical applications of nanotechnology. Biophys. Rev. 2017;9:79–89. doi: 10.1007/s12551-016-0246-2. - DOI - PMC - PubMed
    1. Servin A.D., White J.C. Nanotechnology in agriculture: Next steps for understanding engineered nanoparticle exposure and risk. NanoImpact. 2016;1:9–12. doi: 10.1016/j.impact.2015.12.002. - DOI
    1. Ghobashy M.M., Alkhursani S.A., Alqahtani H.A., El-damhougy T.K., Madani M. Gold nanoparticles in microelectronics advancements and biomedical applications. Mater. Sci. Eng. B. 2024;301:117191. doi: 10.1016/j.mseb.2024.117191. - DOI
    1. Góral D., Marczuk A., Góral-Kowalczyk M., Koval I., Andrejko D. Application of iron nanoparticle-based materials in the food industry. Materials. 2023;16:780. doi: 10.3390/ma16020780. - DOI - PMC - PubMed
    1. Liu Y., Yang G., Hui Y., Ranaweera S., Zhao C.X. Microfluidic nanoparticles for drug delivery. Small. 2022;18:2106580. doi: 10.1002/smll.202106580. - DOI - PubMed

LinkOut - more resources