. 2025 Feb;24(2):e14393.
doi: 10.1111/acel.14393. Epub 2024 Oct 25.

Neuronal cathepsin S increases neuroinflammation and causes cognitive decline via CX3CL1-CX3CR1 axis and JAK2-STAT3 pathway in aging and Alzheimer's disease

Affiliations

Neuronal cathepsin S increases neuroinflammation and causes cognitive decline via CX3CL1-CX3CR1 axis and JAK2-STAT3 pathway in aging and Alzheimer's disease

Pei-Pei Liu et al. Aging Cell. 2025 Feb.

Abstract

Aging is an intricate process involving interactions among multiple factors, which is one of the main risks for chronic diseases, including Alzheimer's disease (AD). As a member of cysteine protease, cathepsin S (CTSS) has been implicated in inflammation across various diseases. Here, we investigated the role of neuronal CTSS in aging and AD started by examining CTSS expression in hippocampus neurons of aging mice and identified a significant increase, which was negatively correlated with recognition abilities. Concurrently, we observed an elevation of CTSS concentration in the serum of elderly people. Transcriptome and fluorescence-activated cell sorting (FACS) results revealed that CTSS overexpression in neurons aggravated brain inflammatory milieu with microglia activation to M1 pro-inflammatory phenotype, activation of chemokine C-X3-C-motif ligand 1 (CX3CL1)-chemokine C-X3-C-motif receptor 1 (CX3CR1) axis and janus kinase 2 (JAK2)-signal transducer and activator of transcription 3 (STAT3) pathway. As CX3CL1 is secreted by neurons and acts on the CX3CR1 in microglia, our results revealed for the first time the role of neuron CTSS in neuron-microglia "crosstalk." Besides, we observed elevated CTSS expression in multiple brain regions of AD patients, including the hippocampus. Utilizing CTSS selective inhibitor, LY3000328, rescued AD-related pathological features in APP/PS1 mice. We further noticed that neuronal CTSS overexpression increased cathepsin B (CTSB) activity, but decreased cathepsin L (CTSL) activity in microglia. Overall, we provide evidence that CTSS can be used as an aging biomarker and plays regulatory roles through modulating neuroinflammation and recognition in aging and AD process.

Keywords: Alzheimer's disease; aging; cathepsin S; neurodegenerative disease; neuroinflammation; recognition.


Conflict of interest statement

The authors have declared that no conflicts of interest exist.

Figures
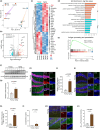
FIGURE 1
FIGURE 1
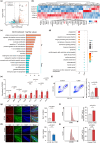
CTSS expression was upregulated in aging individuals and related to immune process and Aβ1‐42 accumulation. (a) PCA of RNA‐Seq on the brains of young and aging mice (n = 3 per group). (b) Volcano plots of RNA‐Seq demonstrating up‐and down‐regulated genes in aging mice using fold change and p‐value cutoffs of 1.0 and 0.05, respectively. (c) Heatmap displaying the top 30 DEGs and CTSS was included in the gene list. (d) GO enrichment analysis on DEGs identified the upregulated and downregulated processes. (e) DEGs were significantly enriched for the pathway of “antigen processing and presentation,” as established by GSEA analysis. (f) Immunoblot of CTSS in the two groups. (g) Immunoblot analysis of the protein levels of CTSS in other 12 mice in two groups (n = 6 per group). (h) IF showing that CTSS is colocalized with NeuN, and the IF intensity of CTSS in NeuN positive cells in aging mice was significantly higher than that in young mice. Scale bar: 20 μm. (i) Analysis of the relative CTSS intensity in NeuN positive cells in two groups (young: N = 6, aging: N = 5). (j) IF showing that CTSS is colocalized with Iba1, and the IF intensity of CTSS in Iba1 positive cells in aging mice was significantly higher than that in young mice. Scale bar: 20 μm. (k) Analysis of the relative CTSS intensity in Iba1 positive cells in two groups (young: N = 6, aging: N = 5). (l) ELISA assay showed that CTSS concentration in the serum of aging people is significantly higher than that in young people (n = 20 per group). (m) IF showed that the fluorescence intensity of Aβ1‐42 was significantly increased in the hippocampus of aging mice than that in the young mice, which was partially colocalized with CTSS. Scale bar: 20 μm. (n) Analysis of the Aβ1‐42 fluorescence intensity per slice (young: N = 4, aging: N = 5). T‐test was used for (g, i, k, l, and n) Data are expressed as mean ± SEM. *p < 0.05.
FIGURE 2
FIGURE 2
CTSS overexpression in hippocampus neurons impaired the spatial learning and memory behavior in young mice. (a) Schematic representation of AAV‐hSyn‐Ctss‐3xFlag‐P2A‐EGFP‐WPRE construct. (b) Quantitative RT‐PCR analysis of the gene expression level of CTSS in two groups (control: N = 5, CTSS: N = 8). (c, d) IF images injected with AAV‐hSyn‐Ctss‐3xFlag‐P2A‐EGFP‐WPRE reveal that CTSS expression is increased in multiple subregions of the hippocampus, including the CA1, CA3, and DG. Scale bar: 20 μm. (e) Escape latencies measured as meantime (s) during five consecutive training days. (f) Heat plots of search intensity during probe trials conducted on day 6. A high dwell time across the MWM pool area is indicated by colors close to red, whereas colors close to blue indicate a lower dwell time. (g) The percentage of time spent in the target quadrant during the probe trials on day 6 (control: N = 6, CTSS: N = 9). (h) The latency of the first target‐site crossover (probe time) during the probe trials on day 6 (control: N = 6, CTSS: N = 9). (i) The average crossing number over the platform site during the probe trials on day 6 (control: N = 6, CTSS: N = 9). Two‐way RM ANOVA test was used for (e) T‐test was used for (b, g–i). Data are presented as mean ± SEM. *: p < 0.05, **: p < 0.01, ***: p < 0.001.
FIGURE 3
FIGURE 3
CTSS knockdown in hippocampus neurons rescued the spatial learning and memory deficits in aging mice. (a) Schematic representation of AAV‐hSyn‐ EGFP‐3xFlag‐shRNA‐WPRE construct. (b) Quantitative RT‐PCR analysis of the gene expression level of CTSS in two groups (sh‐NC: N = 3, sh‐CTSS: N = 5). (c, d) IF images injected with AAV‐hSyn‐Ctss‐3xFlag‐P2A‐EGFP‐WPRE reveal that CTSS expression is reduced in multiple subregions of the hippocampus, including the CA1, CA3, and DG. Scale bar: 20 μm. (e) Escape latencies measured as meantime (s) during five consecutive training days. (sh‐NC: N = 9, sh‐CTSS: N = 9). (f) Heat plots of search intensity during probe trials conducted on day 6. (g) The percentage of time spent in the target quadrant during the probe trials on day 6 (sh‐NC: N = 9, sh‐CTSS: N = 9). (h) The latency of the first target‐site crossover (probe time) during the probe trials on day 6 (sh‐NC: N = 9, sh‐CTSS: N = 9). (i) The average crossing number over the platform site during the probe trials on day 6 (sh‐NC: N = 9, sh‐CTSS: N = 9). Two‐way RM ANOVA test was used for (e) T‐test was used for (b, g–i) Data are presented as mean ± SEM. *: p < 0.05, **: p < 0.01, ***: p < 0.001.
FIGURE 4
FIGURE 4
CTSS overexpression in hippocampus neurons leads to inflammatory milieu with microglia activation to M1 phenotype. (a) Volcano plots of RNA‐Seq displaying up‐and down‐regulated genes in CTSS overexpressed mice using fold change and p‐value cutoffs of 1 and 0.05, respectively (n = 3 per group). (b) Heatmap displaying the top 30 DEGs in CTSS overexpression mice and CTSS was included in the gene list. (c) GO enrichment analysis on DEGs identified the upregulated processes and the down‐regulated processes in CTSS overexpression mice. (d) KEGG pathway enrichment analysis of DEGs in CTSS overexpression mice. (e) Quantitative RT‐PCR analysis of the expression level of multiple DEGs responsible for neuroinflammation pathway in two groups (Control: N = 5, CTSS: N = 8). (f) FACS analysis of the CD11b+ CD45int microglia in two groups (n = 5 per group). (g) (left) Immunostaining of Iba1 (red), GFP (green), and DAPI (blue) in the hippocampus of mice injected with control and CTSS overexpressed virus. Scale bar: 20 μm; (right) quantification of Iba1 numbers in two groups (Control: N = 7, CTSS: N = 10). (h) (left) Immunostaining of Iba1 (red), GFP (green), and DAPI (blue) in the hippocampus of mice injected with negative control (sh‐NC) and CTSS knockdown (sh‐CTSS) virus. Scale bar: 20 μm; (right) quantification of Iba1 numbers in two groups (n = 9 per group). (i) FACS analysis of the expression of CD86 in CD11b+ CD45int microglia in two groups (n = 3 per group). (j) FACS analysis of the expression of CD206 in CD11b+ CD45int in two groups (n = 3 per group). T‐test was used for (e–j) Data are presented as mean ± SEM. *: p < 0.05, **: p < 0.01, ***: p < 0.001.
FIGURE 5
FIGURE 5
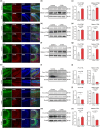
CTSS modulates neuroinflammation and cognition behavior via the CX3CL1‐CX3CR1 axis and JAK2‐STAT3 signaling pathway. (a) Quantitative RT‐PCR analysis of the expression level of cx3cr1 in two groups (Control: N = 5, CTSS: N = 8). (b) Quantitative RT‐PCR analysis of the expression level of cx3cl1 in two groups (Control: N = 5, CTSS: N = 8). (c) FACS analysis of the expression of CX3CR1 in CD11b+ CD45int microglia in two groups (n = 5 per group). (d) Illustration of the in vitro coculture system. (e) ELISA assay showed that CX3CL1 concentration in the medium of CTSS group is significantly higher than that in control group (n = 5 per group). (f) Immunoblot of CX3CR1 and JAK2‐STAT3 pathway in two groups. (g) Immunoblot analysis of the protein levels of CX3CR1 in two groups (control: N = 6, CTSS: N = 9). (h, i) Immunoblot analysis of JAK2‐STAT3 pathway in control and CTSS overexpressed groups (Control: N = 6, CTSS: N = 6). (j) Immunostaining of CX3CL1 (red), GFP (green), and DAPI (blue) in the DG subregions in control and CTSS overexpressed groups. Scale bar: 20 μm. (K) Immunostaining of CX3CR1 (red), Iba1 (cyan), GFP (green), and DAPI (blue) in the DG subregions in control and CTSS overexpressed groups. Scale bar: 20 μm. (l) Immunostaining of CX3CL1 (red), GFP (green), and DAPI (blue) in the DG, CA1, and CA3 subregions in NC and CTSS knockdown groups. Scale bar: 20 μm. (m) Immunostaining of CX3CR1 (red), Iba1 (cyan), GFP (green), and DAPI (blue) in the DG, CA1, and CA3 subregions in NC and CTSS knockdown groups. Scale bar: 20 μm. (n‐p) Immunoblot analysis of JAK2‐STAT3 pathway in control and CTSS overexpressed groups (Control: N = 4, CTSS: N = 5). (q–s) Immunoblot analysis of JAK2‐STAT3 pathway in NC and CTSS knockdown groups (sh‐NC: N = 5, sh‐CTSS: N = 4). T‐test was used for (a–c, e, g–i, o, p, r, and s) Data are expressed as mean ± SEM, *: p < 0.05, **: p < 0.01, ***: p < 0.001.
FIGURE 6
FIGURE 6
CTSS Inhibition by LY3000328 rescued AD‐related pathological features in APP/PS1 mice. (a) The CTSS Transcripts Per Million (TPM) in the hippocampus of AD patients was significantly higher than those in healthy controls (Healthy: N = 66, AD: N = 74). (b) Time schedule of the experiments. (c) Coronal section depicting cannula implantation in the hippocampus. Scale bar: 1 mm. (d) Immunostaining of 6E10 (red), CTSS (green) and DAPI (blue) in the hippocampus of mice in two groups. Scale bar: 20 μm. (e) Quantification of the Aβ plaque area in two groups (vehicle: N = 9, LY3000328: N = 12). (f) Immunostaining of Iba1 (red) and DAPI (blue) in the hippocampus of mice in two groups. Scale bar: 20 μm. (g) Quantification of Iba1 numbers in the hippocampus of mice in two groups (vehicle: N = 8, LY3000328: N = 6). (h) Immunostaining of CX3CL1 (red) and DAPI (blue) in the DG, CA1, and CA3 subregions in two groups. Scale bar: 20 μm. (i) Immunostaining of CX3CR1 (red) and DAPI (blue) in the DG, CA1, and CA3 subregions in two groups. Scale bar: 20 μm. (j–l) Immunoblot analysis of JAK2‐STAT3 pathway in two groups (n = 3 per group). (m) Illustration of the in vitro coculture system. (n) ELISA assay showed that CX3CL1 concentration in the medium of LY 3000328 group is significantly lower than that in Vehicle group (n = 5 per group). (o) Immunoblot of CX3CR1 and JAK2‐STAT3 pathway in two groups. (p) Immunoblot analysis of the protein levels of CX3CR1 in two groups (Vehicle: N = 6, LY 3000328: N = 5). (q, r) Immunoblot analysis of JAK2‐STAT3 pathway in control and CTSS overexpressed groups (Vehicle: N = 6, LY 3000328: N = 5). (s) Escape latencies measured as meantime (s) during five consecutive training days. (n = 7 per group). (t) Heat plots of search intensity during probe trials conducted on day 6. High dwell time across the MWM pool area is indicated by colors close to red, whereas colors close to blue indicate lower dwell time. (u) The percentage of time spent in the target quadrant during the probe trials on day 6 (vehicle: N = 7, LY3000328: N = 6). (v) The latency of the first target‐site crossover (probe time) during the probe trials on day 6 (vehicle: N = 7, LY3000328: N = 6). (w) The average crossing number over the platform site during the probe trials on day 6 (vehicle: N = 7, LY3000328: N = 6). A two‐way RM ANOVA test was used for (s) T‐test was used for (a, e, g, k, l, n, p–r, u–w) Data are presented as mean ± SEM. *: p < 0.05, **: p < 0.01, ***: p < 0.001.
FIGURE 7
FIGURE 7
Neuronal CTSS overexpression increased cathepsin B (CTSB) activity, but decreased cathepsin L (CTSL) activity in microglia. (a) Immunostaining of CTSB (red), GFP (green), and DAPI (blue) in the DG, CA1, and CA3 subregions in control and CTSS overexpressed groups. Scale bar: 20 μm. (b) Immunoblot of pro‐CTSB and mature CTSB in the hippocampus of two groups. (c) Immunoblot analysis of the protein levels of pro‐CTSB (left) and mature CTSB (right) in the hippocampus of two groups (Control: N = 4, CTSS: N = 4). (d) Immunoblot of pro‐CTSB and mature CTSB in HT‐22 cells of two groups. (e) Immunoblot analysis of the protein levels of pro‐CTSB (left) and mature CTSB (right) in HT‐22 cells of two groups (Control: N = 5, CTSS: N = 5). (f) Immunoblot of pro‐CTSB and mature CTSB in BV2 cells of two groups. (g) Immunoblot analysis of the protein levels of pro‐CTSB (left) and mature CTSB (right) in BV2 cells of two groups (Control: N = 5, CTSS: N = 5). (h) Immunostaining of CTSL (red), GFP (green), and DAPI (blue) in the DG, CA1, and CA3 subregions in control and CTSS overexpressed groups. Scale bar: 20 μm. (i) Immunoblot of pro‐CTSL and mature CTSL in the hippocampus of two groups. (j) Immunoblot analysis of the protein levels of pro‐CTSL (left) and mature CTSL (right) in the hippocampus of two groups (Control: N = 3, CTSS: N = 3). (k) Immunoblot of pro‐CTSL and mature CTSL in HT‐22 cells of two groups. (l) Immunoblot analysis of the protein levels of pro‐CTSL (left) and mature CTSL (right) in HT‐22 cells of two groups (Control: N = 5, CTSS: N = 5). (m) Immunoblot of pro‐CTSL and mature CTSL in BV2 cells of two groups. (n) Immunoblot analysis of the protein levels of pro‐CTSL (left) and mature CTSL (right) in BV2 cells of two groups (Control: N = 5, CTSS: N = 5). T‐test was used for (c, e, g, j, l, and n) Data are presented as mean ± SEM. *: p < 0.05, **: p < 0.01.
FIGURE 8
FIGURE 8
A schematic image shows the role of neuronal CTSS in the process of aging and Alzheimer's disease (AD). Left: In young and healthy mice, neuronal CTSS can induce the secretion of CX3CL1 by neurons and acts on CX3CR1 receptors in microglia, which degrades proteins along the endocytic pathway; Right: In aging and AD model mice, the expression level of neuronal CTSS was significantly elevated in neurons, which increases neuroinflammation and causes cognitive decline via CX3CL1‐CX3CR1 axis and JAK2‐STAT3 pathway. LY 3000328, the selective inhibitor of CTSS, LY3000328, significantly rescues AD‐related pathological features in APP/PS1 mice.

References

    1. Agrawal, S. , Baulch, J. E. , Madan, S. , Salah, S. , Cheeks, S. N. , Krattli, R. P. , Subramanian, V. S. , Acharya, M. M. , & Agrawal, A. (2022). Impact of IL‐21‐associated peripheral and brain crosstalk on the Alzheimer's disease neuropathology. Cellular and Molecular Life Sciences, 79, 331. - PMC - PubMed
    1. Akiyama, H. , Arai, T. , Kondo, H. , Tanno, E. , Haga, C. , & Ikeda, K. (2000). Cell mediators of inflammation in the Alzheimer disease brain. Alzheimer Disease and Associated Disorders, 14(1), 47–53. - PubMed
    1. Akiyama, H. , Barger, S. , Barnum, S. , Bradt, B. , Bauer, J. , Cole, G. M. , Cooper, N. R. , Eikelenboom, P. , Emmerling, M. , Fiebich, B. L. , Finch, C. E. , Frautschy, S. , Griffin, W. S. , Hampel, H. , Hull, M. , Landreth, G. , Lue, L. , Mrak, R. , Mackenzie, I. R. , … Wyss‐Coray, T. (2000). Inflammation and Alzheimer's disease. Neurobiology of Aging, 21, 383–421. - PMC - PubMed
    1. Aunan, J. R. , Watson, M. M. , Hagland, H. R. , & Søreide, K. (2016). Molecular and biological hallmarks of ageing. The British Journal of Surgery, 103, e29–e46. - PubMed
    1. Biswas, K. (2023). Microglia mediated neuroinflammation in neurodegenerative diseases: A review on the cell signaling pathways involved in microglial activation. Journal of Neuroimmunology, 383, 578180. - PubMed

MeSH terms