. 2024 Dec 2;223(12):e202310153.
doi: 10.1083/jcb.202310153. Epub 2024 Oct 25.

CYRI controls epidermal wound closure and cohesion of invasive border cell cluster in Drosophila

Affiliations

CYRI controls epidermal wound closure and cohesion of invasive border cell cluster in Drosophila

Marvin Rötte et al. J Cell Biol. .

Abstract

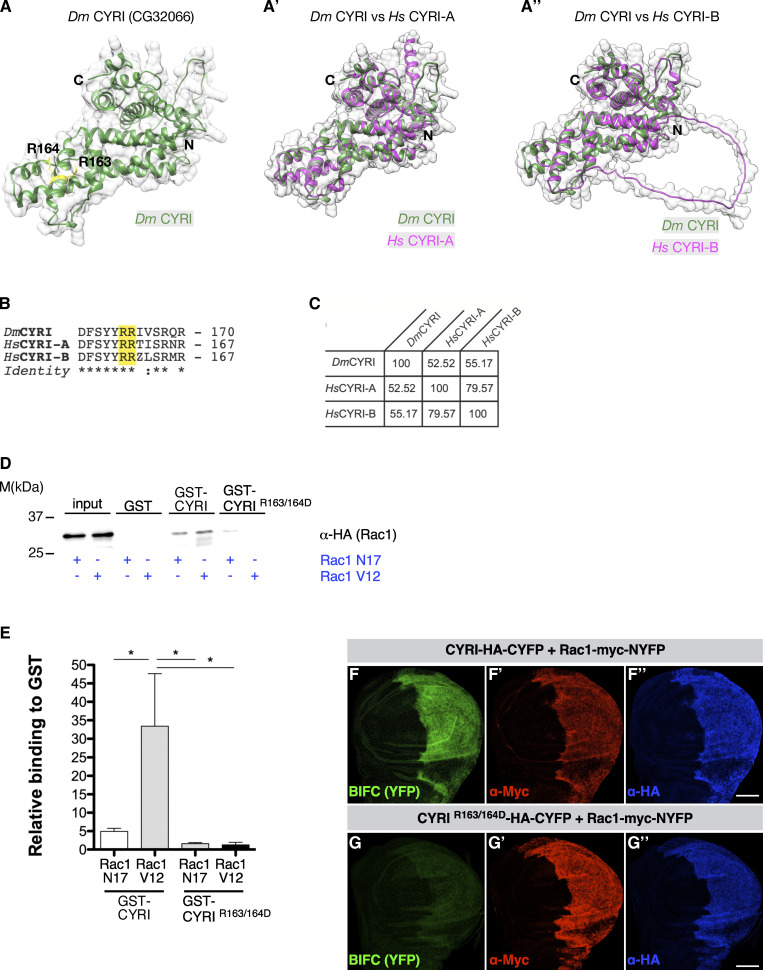
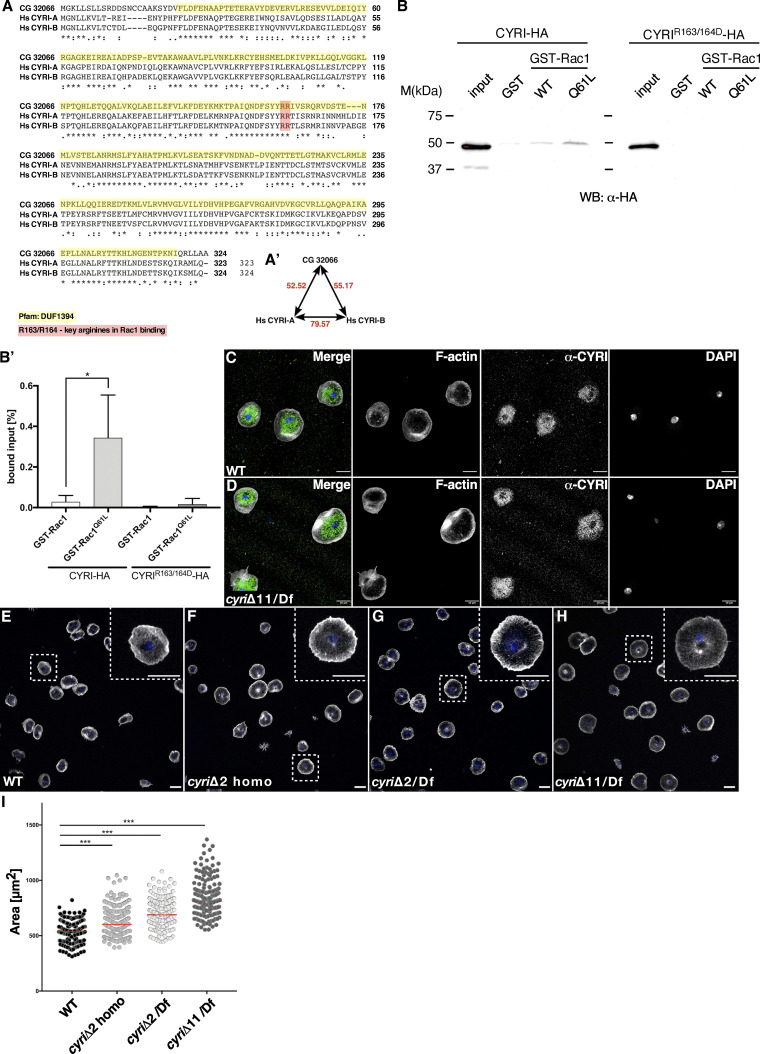
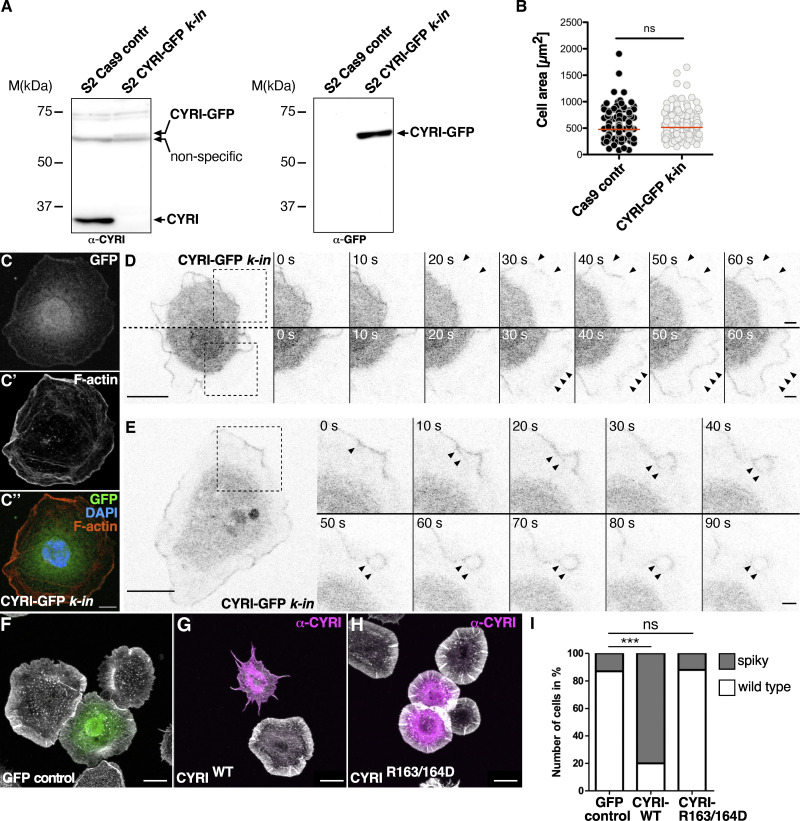
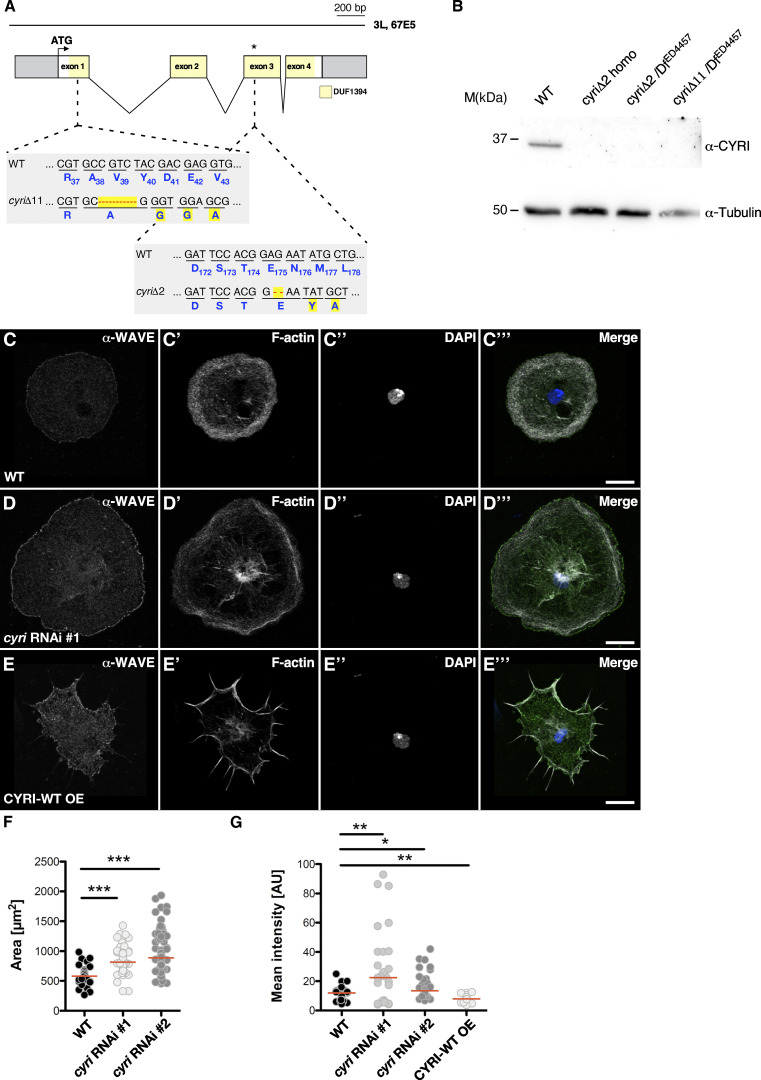
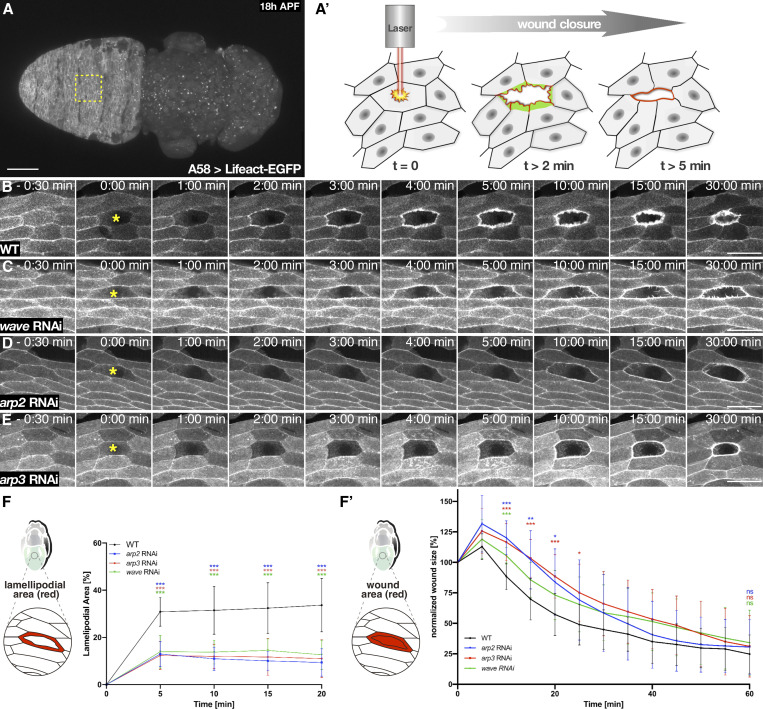
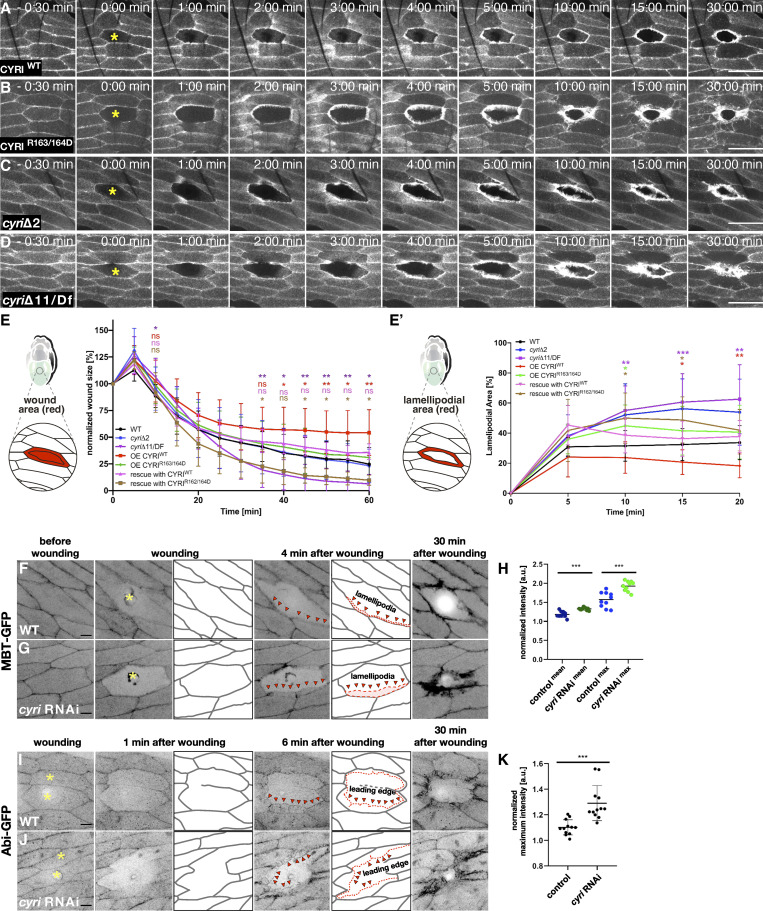
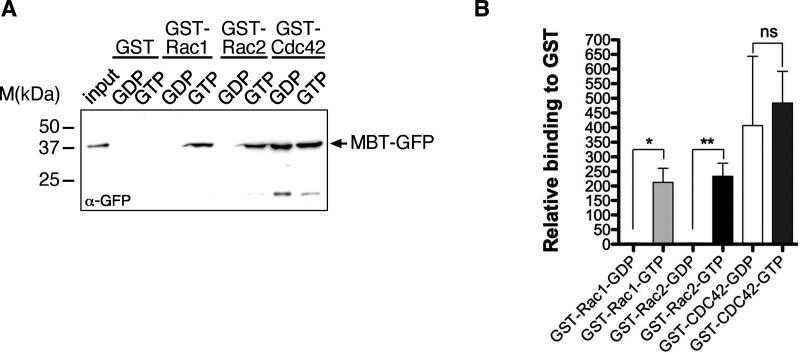
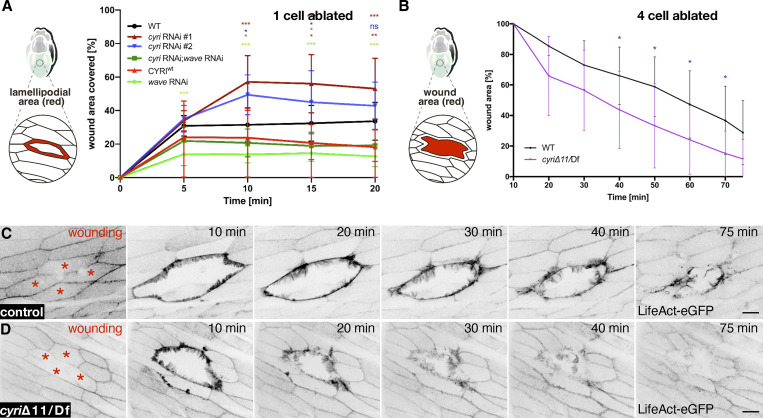
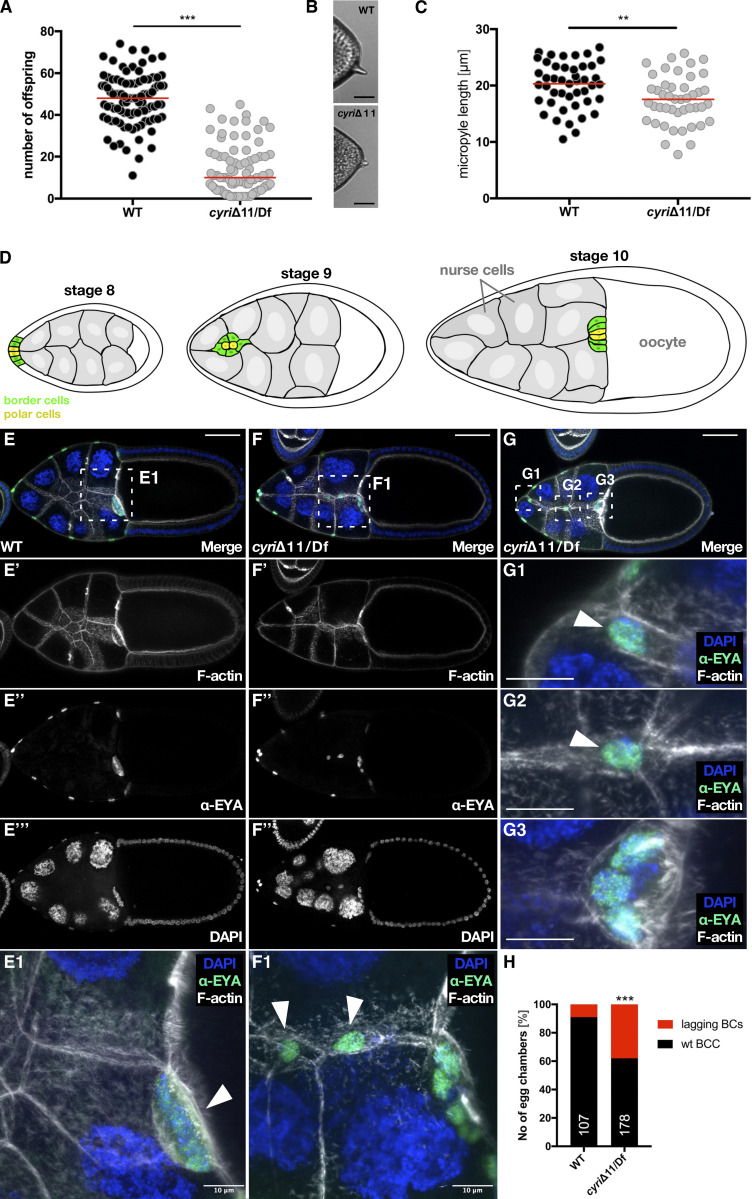
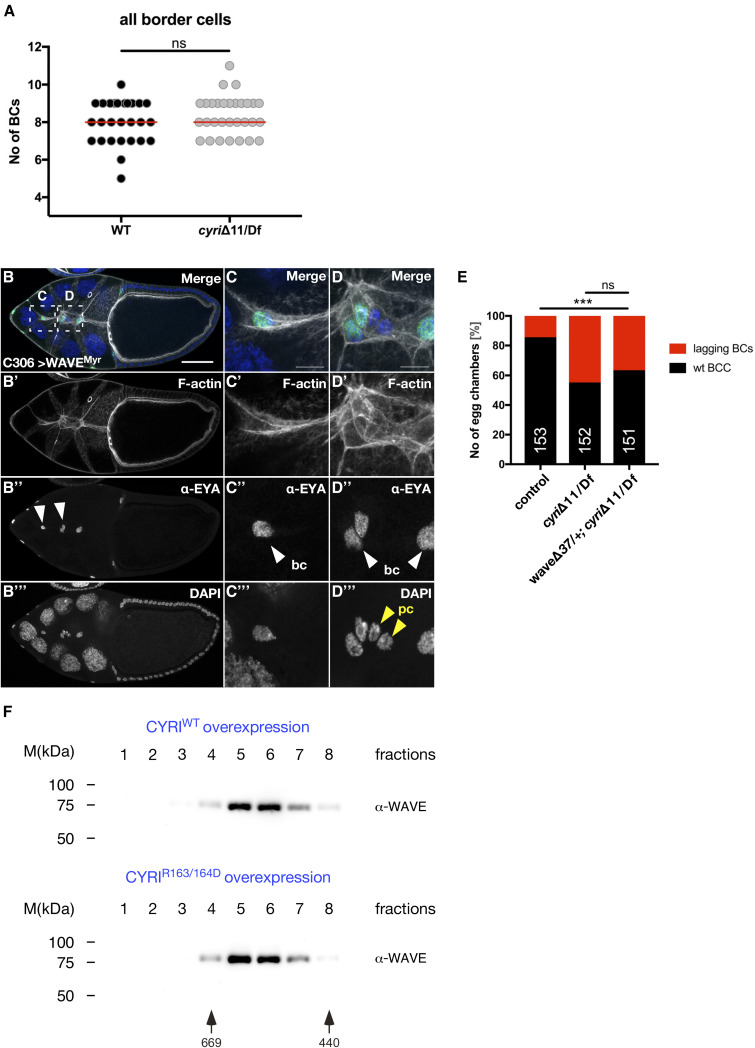
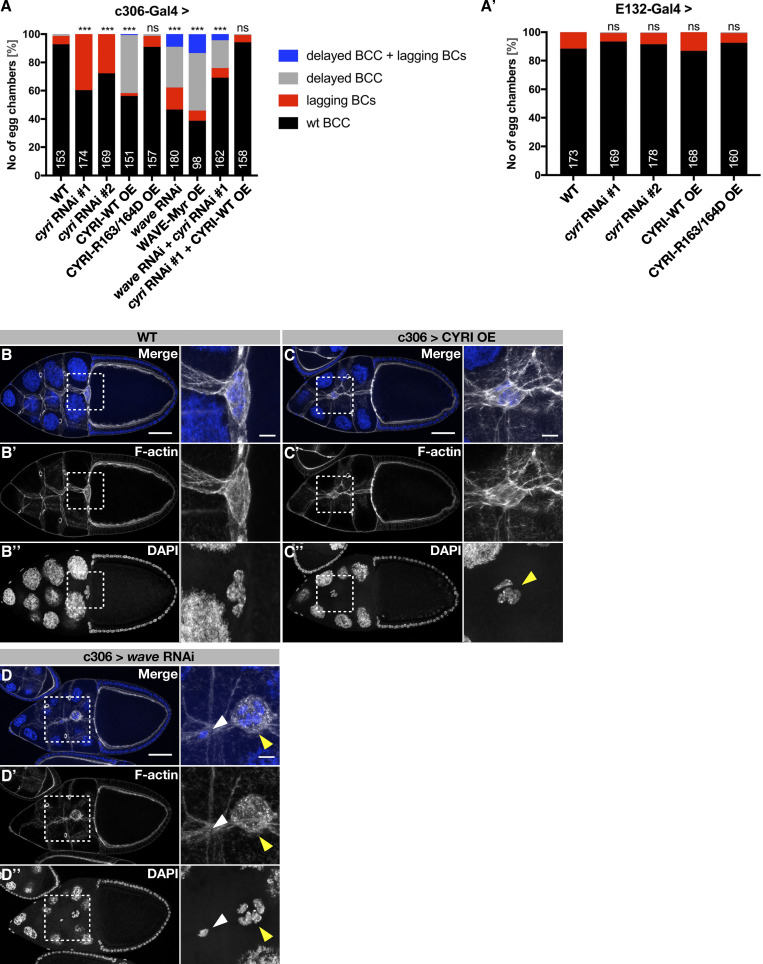
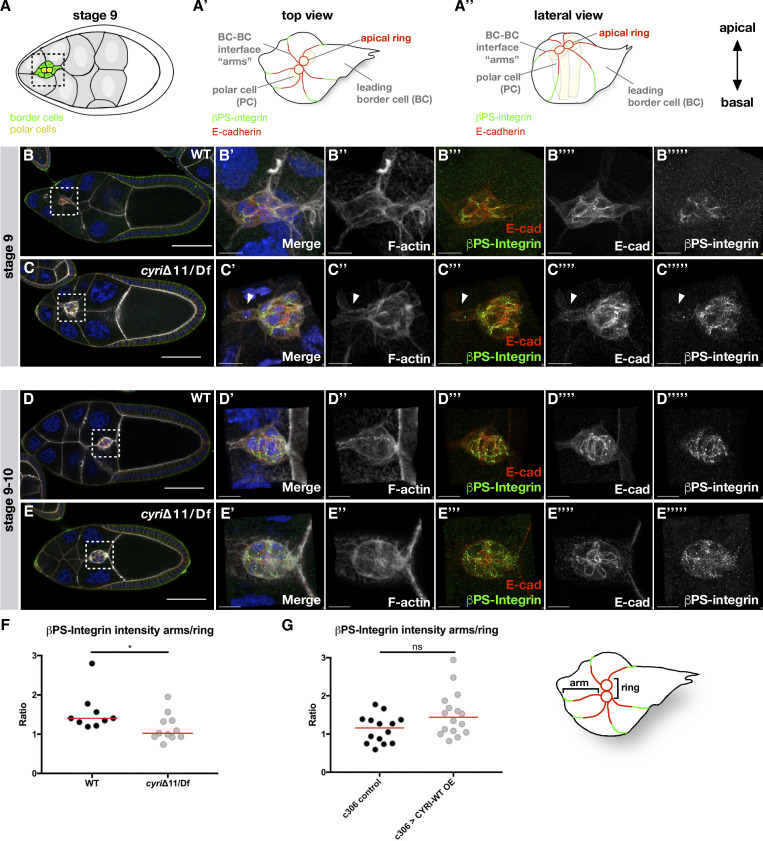
Cell motility is crucial for many biological processes including morphogenesis, wound healing, and cancer invasion. The WAVE regulatory complex (WRC) is a central Arp2/3 regulator driving cell motility downstream of activation by Rac GTPase. CYFIP-related Rac1 interactor (CYRI) proteins are thought to compete with WRC for interaction with Rac1 in a feedback loop regulating lamellipodia dynamics. However, the physiological role of CYRI proteins in vivo in healthy tissues is unclear. Here, we used Drosophila as a model system to study CYRI function at the cellular and organismal levels. We found that CYRI is not only a potent WRC regulator in single macrophages that controls lamellipodial spreading but also identified CYRI as a molecular brake on the Rac-WRC-Arp2/3 pathway to slow down epidermal wound healing. In addition, we found that CYRI limits invasive border cell migration by controlling cluster cohesion and migration. Thus, our data highlight CYRI as an important regulator of cellular and epithelial tissue dynamics conserved across species.


Conflict of interest statement

Disclosures: The authors declare no competing interests exist.

Figures

Figure 1.
Figure 1.
Drosophila CYRI binds activated Rac1 and controls lamellipodial protrusions. (A–A″) Comparisons of the highly similar structures and topologies of (A) CG32066 with human (A′) CYRI-A and (A″) CYRI-B based on AlphaFold2 protein structure predictions (Jumper et al., 2021). As recently shown by crystal structure analysis CYRI proteins comprised solely of α-helices (Kaplan et al., 2020; Yelland et al., 2021). Note the model contains the two highly conserved arginines at positions 163 and 164 (marked in yellow) in the fly protein corresponding to R161 and R162 in human CYRI-B. (B) Sequence alignment of Drosophila CG32066, human CYRI-A, and CYRI-B shows conservation of the arginines at positions 163 and 164. (C) Comparative sequence analysis between CG32066 and human CYRI-A and CYRI-B proteins. The numbers refer to Clustal W sequence alignment score (Thompson et al., 1994). (D) Pull-down experiments with GST-CYRI proteins. GSH-sepharose-bound GST-CYRI (wild type or R163/164D mutant) were preloaded with GDP or GTPγS and incubated with lysate from S2R+ cells transfected with either constitutively activated Rac1-V12 or dominant-negative Rac1-N17 construct. (E) Quantification of (D) from three independent experiments. Signals were normalized to GST. Mean ± SD. Statistical analysis using one-way ANOVA with Tukey’s multiple comparisons. * P <0.05. (F) Visualization of CYRI and Rac1 BIFC interaction in wing imaginal discs. Maximum intensity projection images of wing imaginal discs expressing the indicated Split-YFP construct combinations in the en-Gal4 pattern. Expression of transgenes is verified by antibody staining as indicated. Anterior is to the left. (G) Co-expression of Rac1-myc-NYFP and wild type CYRI-HA-CYFP leads to reconstitution of YFP, whereas (G) co-expression of Rac1-myc-NYFP and mutant CYRI-R163/164D-HA-CYFP does not show YFP fluorescence. Three independent experiments for each genotype were performed. Scale bars represent 50 µm. Source data are available for this figure: SourceData F1.
Figure S1.
Figure S1.
Drosophila CG32066 is the ortholog of human CYRI. (A) Sequence alignment of human CYRI-A, CYRI-B and Drosophila CG32066. Conserved amino acid residues are marked by asterisks. Colons indicate conserved positions containing residues with strongly similar properties. Gaps are indicated by dashes. The conserved two arginine residues, R163 and R164 are highlighted in red. The highest conservation is found within the DUF1394 domain (highlighted in yellow). (A′) The Drosophila CYRI protein shares 52.52% identity with the human (Hs) CYRI-B protein and 55.17% identity with the human (Hs) CYRI-A protein. The human proteins share 79.57% identity. (B) Western blot from pull-down of GST control, GST-Rac1WT, or GST-Rac1Q61L beads, with cell lysate expressing either HA-tagged wild type CYRI or HA-tagged mutant CYRI-R163/164D variant. (B′) Quantification of (B) from three independent experiments. Signals were normalized to loaded input (1% of the starting lysate material). Mean ± SD. Statistical analysis using one-way ANOVA with Tukey’s multiple comparisons. * P < 0.05. (C and D) Confocal images of macrophages isolated from (C) wild type and (D) trans-heterozygous cyri mutant pupae (cyriΔ11/Df[ED4457]), stained with phalloidin-Alexa488 (grey), DAPI (blue), and an anti-CYRI antibody (green). Note: no differences in immunofluorescent anti-CYRI intensity were detected. (E–H) Confocal images of (E) wild type and (F) homozygous cyriΔ2 mutant (G) transheterozygous cyriΔ2/Df(ED4457) mutant and (H) transheterozygous cyriΔ11/Df(ED4457) mutant macrophages were co-stained with phalloidin (grey) and DAPI (blue). High magnification of boxed areas displays single cells. Scale bars represent 10 µm. (I) Quantification of spread cell area, n = 167 for all genotypes. To evaluate statistical significance, one-way-ANOVA (Kruskal–Wallis test with Dunn´s correction) was used. P value: <0.001 (***). The red bar represents the median. Three independent experiments for each genotype were performed. Source data are available for this figure: SourceData FS1.
Figure 2.
Figure 2.
Drosophila CYRI controls lamellipodial protrusions. (A) Insertion of a GFP-tag at the 3′ end of the cyri gene in S2 cells using CRISPR/Cas9-mediated genome editing. Lysates from control cells and cells expressing CYRI-GFP were probed on a Western blot using an anti-CYRI (left) or anti-GFP (right) antibody. (B) Quantification of spread cell area, Cas9 S2 control: n = 200 cells; S2 CYRI-GFP knock-in: n = 200 cells; To evaluate statistical significance, the Mann–Whitney test was used and the following P value (two- tailed) was obtained: P value: ns < 0.05. (C–C″) Confocal images of CRISPR/Cas9-edited S2 cells expressing CYRI-GFP (C endogenous GFP; green) stained with phalloidin-Alexa568 (C′ red) and DAPI (C″ blue). Scale bars represent 10 µm. (D and E) Time-lapse fluorescence microscopy images of S2 CYRI-GFP knock-in cells. Images were taken at indicated timepoints. Black arrowheads mark lamellipodial protrusions in D and macropinocytic structures in E enriched for endogenous CYRI-GFP. Scale bar represents 10 µm. (F–H) Confocal images of S2R+ cells stained with phalloidin-Alexa488 (grey) and an anti-CYRI antibody (magenta) transfected with (F) an EGFP, (G) a wild type CYRI (CYRIWT) or (H) a mutant CYRI-R163/164D construct. (I) Quantification of cells showing a spiky cell morphology. n = 100 cells for each genotype from three independent transfection experiments. Two-sided Fisher’s exact test was used. P value: *** P < 0.0001; ns: > 0.05. Source data are available for this figure: SourceData F2.
Figure 3.
Figure 3.
Loss of CYRI controls lamellipodia spread of macrophages. (A) Schematic overview of the cyri gene locus. Exons encoding parts of the DUF1394 domain are highlighted in yellow. The target sequence for CRISPR/Cas9 gene modification and generated cyri deletions, cyriΔ2 and cyriΔ11 is depicted. (B) Loss of cyri mutants were validated by western blot analysis using a specific anti-CYRI antibody. Lysates from ten ovaries of wild type and different mutant flies were analyzed. Anti-tubulin signal served as a loading control. (C–E) Confocal images of (C) wild type; (D) cyri RNAi depleted (E) CYRI-WT overexpressing macrophages stained for endogenous WAVE (α-WAVE; green), F-actin (grey), and DAPI (blue). Scale bars represent 10 µm. (F) Quantification of spread cell area of pre-pupal hemocytes (wild type: 30 cells; cyri RNAi #1: 89 cells; cyri RNAi #2: 85 cells.). Statistical significance was evaluated using one-way-ANOVA (Kruskal–Wallis test) followed by Dunn’s Multiple Comparison test. P value: <0.0001 (***). The red bar represents the median. Three independent transfection experiments were performed. (G) Quantification of immunofluorescent anti-WAVE intensity at the leading edge of wild type (n = 30 cells), cyri RNAi depleted macrophages (two different RNAi transgenes #1 and #2; each n = 29 cells) and macrophages overexpressing a wild type CYRI transgenes (CYRI-WT OE, n = 30 cells) normalized to background fluorescence. One-way-ANOVA test was performed. For multiple comparison, the test was corrected after Dunnett. P = *(0.033), **(0.002), ***(0.001). Quantification was done from three independent experiments. Source data are available for this figure: SourceData F3.
Figure 4.
Figure 4.
The Rac-WRC-Arp2/3 pathway is required for wound closure. (A) Wild type 18 h APF old pupa specifically expressing a Lifeact-EGFP transgene in the abdominal epidermis under the control of the A58-Gal4 driver. The imaged area of the monolayered epithelium is boxed in yellow. (A′) Scale bar represents 250 µm (A′) Schematic of the in vivo wounding model. Laser-induced single-cell ablation starts at t = 0 min. In the first two min (t = 2 min), F-actin assembles into broad lamellipodial protrusions (green) within cells at the wound edge; lamellipodial protrusions reach a maximum size between 5 and 10 min after wounding. Later on (t > 5 min), an acto-myosin ring (red) is formed at the leading edge of the wound (according to Lehne and Bogdan [2023]). (B–E) Frames of spinning disc microscopy videos of 18 h APF old epidermis expressing a Lifeact-EGFP transgene under the control of the A58-Gal4 driver. The genotypes are indicated. Images were taken at indicated time points. Ablation of a single cell (yellow asterisk) starts at t = 0 min. Scale bar represents 50 µm. (F and F′) Quantification of wound closure in wild type (WT; n = 13) and after knockdown of arp2 (n = 15), arp3 (n = 16) and wave (n = 16) by RNAi. (F) Lamellipodia size was measured every 5 min and normalized to the initial size of the unwounded cell. Scale bar represents 50 µm. (F′) After 60 min wound closure was assessed by comparison of remaining wound size normalized to unwounded cell size. To evaluate statistical significance in F and F′, the two-way ANOVA analysis with Dunnett correction was used and P values was obtained: P value: 0.12 (ns), 0.033 (*), 0.002 (**), <0.001 (***). Error bars represent SD. At least three independent experiments for each genotype were performed.
Figure 5.
Figure 5.
Loss of CYRI accelerates epidermal wound closure. (A and B) Single-cell ablation experiments in the abdominal epidermis overexpressing a (A) wild type CYRI and (B) mutant CYRIR163/164D transgene. (C and D) Single-cell ablation in the abdominal epidermis of homozygous cyriΔ2 mutant, (D) and a transheterozygous cyriΔ11/Df(ED4457) mutant. Images were taken at indicated time points. Ablation of a single cell (yellow asterisk) starts at t = 0 min. Scale bars represent 50 µm. (E and E′) Quantification of wound closure defects. Following genotypes were measured: wild type (WT; n = 13), cyriΔ2 (n = 14), cyriΔ11/Df(ED4457) (n = 15), CYRIWT (n = 15), CYRIR163/164D (n = 18), rescue with CYRIWT (n = 7), and rescue with CYRIR163/164D (n = 11). (E) Over the time of 60 min wound closure was assessed by comparing the remaining wound size normalized to the unwounded cell size. (E′) Lamellipodia size was measured every 5 min and normalized to the initial size of the unwounded cell. To evaluate statistical significance in E and F, the two-way ANOVA analysis with Dunnett correction was used and the following P values were obtained: P value: 0.12 (ns), 0.033 (*), 0.002 (**), <0.001 (***). Error bars represent SD. At least three independent experiments for each genotype were performed. Note that wild type controls are the same as in Fig. 4, F and G as the data belong to the same dataset. Note that wounded transheterozygous cyriΔ11 mutant epithelium almost completely sealed after 40 min. (F and G) Frames of spinning disc microscopy videos of 18 h APF old epidermis expressing the Rac sensor MBT-GFP under the control of the A58-Gal4 driver. The genotypes are (F) wild type and (G) cyri RNAi. Images were taken at indicated time points. Ablation of a single cell (yellow asterisk) starts at t = 0 min. Red arrowheads mark increased broad lamellipodia marked by MBT-GFP in epidermal cells at the wound margin depleted for cyri. Scale bar represents 20 µm. (H) Quantification of the mean and maximum fluorescence intensity of MBT-GFP in control and cyri RNAi–depleted epidermis. Statistical significance was determined by Unpaired t test with Welch’s correction, P value: <0.001 (***) (wild type: n = 10; cyri RNAi: n = 10). At least three independent experiments for each genotype were performed. (I and J) Frames of spinning disc microscopy videos of 18 h APF old epidermis expressing the WRC subunit Abi-GFP under the control of the A58-Gal4 driver. The genotypes are (I) wild type and (J) cyri RNAi. Images were taken at indicated timepoints. Ablation of a single cell (yellow asterisk) starts at t = 0 min. Red arrowheads mark increased broad lamellipodial tips marked by Abi-GFP in epidermal cells at the wound margin depleted for cyri. Scale bar represents 20 µm. (K) Quantification of the maximum fluorescence intensity of Abi-GFP in control and cyri RNAi depleted epidermis. Statistical significance was determined by Unpaired t test with Welch’s correction, P value <0.001 (***) (wild type: n = 12; cyri RNAi: n = 12). At least three independent experiments for each genotype were performed.
Figure S2.
Figure S2.
A new GFP-based sensor for active Rac1 and Rac2. (A) Pull-down experiments with recombinant GST, GST-Rac1, -Rac2, and -Cdc42 proteins. GSH-sepharose-bound GST-Cdc42 was preloaded with GDP or GTP γS and incubated with S2 cell lysate transfected with MBT-GFP. Bead-bound complexes were probed for binding of MBT-GFP protein by an anti-GFP antibody. (B) Quantification of (A) from three independent experiments. Signals were normalized to GST. Mean ± SD. To evaluate statistical significance, the Mann-Whitney test was used and following P values (two- tailed) were obtained: P value: ** <0.001, * <0.05 and ns > 0.05. Source data are available for this figure: SourceData FS2.
Figure S3.
Figure S3.
Suppression of cyri function promotes epidermal wound closure. (A) Quantification of increased lamellipodial area upon expression of two different cyri RNAi transgenes (#1 and #2, n = 5), wave RNAi (n = 16), cyri; wave double RNAi (n = 12), CYRIWT (n = 15) under the epidermis-specific A58-Gal4 driver. Note that wild type control (n = 13) and wave RNAi are the same as in Fig. 4, F and G and CYRIWT is the same as Fig. 5 E′, as the data belong to the same dataset. Lamellipodia size was measured every 5 min and normalized to the initial size of the unwounded cell. The two-way ANOVA analysis with Dunnett correction was used and P values were obtained: P value: 0.12 (ns), 0.033 (*), 0.002 (**), <0.001 (***). (B–D) Multiple-cell ablation experiments in the abdominal epidermis of wild type and trans-heterozygous cyri mutant pupae (cyriΔ11/Df[ED4457]), marked by the expression of Lifeact-EGFP under the control of the A58-Gal4 driver. The data shown represent the wound area at the cell surface to illustrate the effects of rapid ingrowth of lamellipodia on wound size (B) Quantification of wound closure in wild type control (black) and trans-heterozygous cyri mutant pupae (purple). Wound size was measured every 10 min and normalized to the initial size of the unwounded cell, (n = 5). To evaluate statistical significance, the two-way-ANOVA Bonferroni post test, (P < 0.05) was used. Error bars represent SD. (C and D) Frames of spinning disc microscopy videos of 18 h APF old epidermis expressing a Lifeact-EGFP transgene under the control of the A58-Gal4 driver. The genotypes are indicated. Red asterisks mark ablated epidermal cells. Images were taken at indicated timepoints. Scale bar represents 20 µm.
Figure 6.
Figure 6.
Loss of CYRI results in partial sterility and border cell migration defects. (A) Quantification of cyri mutant female fertility. Single mutant females were mated with wild type males and the total number of offspring reaching adulthood was counted. Transheterozygous mutant cyriΔ11/Df(ED4457) females had substantially reduced fertility and produced fewer offspring compared with wild type. (n = 95; wild type and n = 94; cyriΔ11/Df(ED4457); the red bar represents the median. Mann–Whitney test was used to determine statistical significance: P value<0.001. (B) Brightfield photomicrographs of wild type and cyri mutant eggs. (C) Quantification of micropyle length. (n = 45; wild type and n = 45; cyriΔ11/Df[ED4457]); The red bar represents the median. Mann–Whitney test was used to determine statistical significance: P value: 0.004. Three independent experiments were performed. (D) Schematic drawing of border cell migration during egg development. Polar cells are marked in yellow and border cells in green. (E–G) Maximum intensity projections of three confocal slices of stage 10 egg chambers of the indicated genotypes with DNA (DAPI, blue), F-actin (grey) and anti-EYA (green); anterior is to the left. (E) Wild type egg chamber (F and G) two examples of cyri mutant egg chambers showing prominent lagging border cells. Bars represent 50 μm. (E1) Detailed view of boxed area in E showing wild type border cell cluster arrived the nurse cell-oocyte border. (F1) Detailed view of the boxed area in (F) shows an abnormally elongated border cell cluster with some cells completely detached. (G1–G3) High magnification of boxed areas in G shows cells detached from the main border cell cluster. The scale bar represents 10 µm. (H) Quantification of border cell cluster of indicated genotype with lagging border cells. Statistical significance was determined by Fisher’s exact test, P value <0.001 (wild type: n = 107; cyriΔ11/Df[ED4457]: n = 178). At least three independent experiments for each genotype were performed.
Figure S4.
Figure S4.
Overexpression of activated WAVE results in border cell cohesion defects. (A) Quantification of border cell numbers in wild type and trans-heterozygous cyri mutant egg chambers. Statistical significance was tested using the Mann–Whitney test, P value = 0.343. WT: n = 27, cyriΔ11/Df: n = 30. Three independent experiments for each genotype were performed. (B–D) Maximum intensity projections of five confocal slices of stage 9 egg chambers overexpressing a membrane-tethered WAVE construct (WAVEMyr) under the control of the C306 driver, stained for DNA (DAPI, blue), F-actin (phalloidin, grey), and anti-EYA (green); anterior is to the left. (B) Maximum intensity projection of a stage 10 egg chamber overexpressing WAVEMyr. Scale bars represent 50 μm. White arrowheads mark border cells (bc). (C and D) Detailed views of boxed areas in B show an abnormally elongated border cell cluster and border cohesion defects. White arrowheads mark border cells (bc) whereas polar cells (pc) are marked by yellow arrowheads. Scale bar represents 10 µm. (E) Removal of one copy of wave in cyri mutant background reduced the lagging border phenotype, although the difference was not significant. N numbers are indicated, P value: ns = 0.1607, ***<0.001. (F) Gel filtration profiles of endogenous WAVE complexes from S2R+ cells overexpressing wild type CYRI (CYRIWT) and Rac-binding deficient variant (CYRIR163/164D) constructs. Complexes co-fractionated with high molecular weight complexes at 500–700 kDa sizes. The elution profile of proteins of known molecular mass is indicated at the bottom. Source data are available for this figure: SourceData FS4.
Figure 7.
Figure 7.
CYRI controls border cell cluster cohesion and migration. (A and A′) Quantification of border cell cluster defects (lagging border cells and delayed border cell clusters) under the control of the (A′) c306-Gal4 and (A′) E132-Gal4 (upd-Gal4) driver. wild type; cyri RNAi #1; cyri RNAi #2; CYRI-WT OE; CYRI-R163/164D; wave RNAi and WAVE-Myr OE. N numbers are indicated. Quantified phenotypes are indicated by the colored legend in the middle. All genotypes were compared against WT using the chi-square test, P values: ns > 0.12, ***<0.001. At least three independent experiments for each genotype were performed. (B–D) Maximum intensity projections of stage 10A egg chambers of the indicated genotypes with DNA (DAPI, blue) and F-actin (red); anterior is to the left. Detailed views of the boxed area are shown on the right. (B) wild type; (C) CYRI overexpression (OE), yellow arrowhead marks nuclei of delayed border cell cluster; (D) RNAi-mediated suppression of wave function, yellow arrowhead marks delayed border cell cluster, whereas white arrowhead marks a lagging border cell.
Figure 8.
Figure 8.
Loss of CYRI affects β-integrin localization in border cell cluster. (A) Schematic drawing of a stage 9 egg chamber. Polar cells are marked in yellow and border cells in green. (A′ and A″) Illustration of migrating border cell cluster that maintains the apico-basal polarity. The apical cap/ring structure is oriented approximately orthogonal to the direction of migration. Highest concentration of E-cadherin is found at the apical interface between border cells and polar cells (apical cap, ring-like structure) and at the contact side between adjacent border cells (BC-BC interface, “arms”). (B–E) Maximum intensity projections of confocal slices of stage 9 egg chambers of the indicated genotypes (wild type: WT; cyri mutant: cyriΔ11/Df(ED4457)) with DNA (DAPI, blue), F-actin (Phalloidin, grey), anti-βPS-integrin (green), and anti-E-cadherin (red); anterior is to the left. (B′–E‴″) Detailed magnified 3D Imaris reconstructions of border cell clusters of boxed areas in B–E. The movement of the border cells proceeds from the left to the right. Scale bars represent 50 μm in B–E and 10 µm in B′–E‴′). (F and G) Quantification of βPS-integrin intensity of indicated genotypes. Statistical significance was determined using the Mann–Whitney test. (F) Trans-heterozygous cyri mutants (cyriΔ11/Df(ED4457): n = 11 and WT: n = 9, P value = 0.031. (G) Overexpression of wild type CYRI transgene under the control of the c306-Gal4 driver, c306 control: n = 14, c306 > CYRI-WT OE: n = 16, P value = 0.070. At least three independent experiments for each genotype were performed.

Similar articles

  • Fam49/CYRI interacts with Rac1 and locally suppresses protrusions.
    Fort L, Batista JM, Thomason PA, Spence HJ, Whitelaw JA, Tweedy L, Greaves J, Martin KJ, Anderson KI, Brown P, Lilla S, Neilson MP, Tafelmeyer P, Zanivan S, Ismail S, Bryant DM, Tomkinson NCO, Chamberlain LH, Mastick GS, Insall RH, Machesky LM. Fort L, et al. Nat Cell Biol. 2018 Oct;20(10):1159-1171. doi: 10.1038/s41556-018-0198-9. Epub 2018 Sep 24. Nat Cell Biol. 2018. PMID: 30250061 Free PMC article.
  • CYRI/ Fam49 Proteins Represent a New Class of Rac1 Interactors.
    Whitelaw JA, Lilla S, Paul NR, Fort L, Zanivan S, Machesky LM. Whitelaw JA, et al. Commun Integr Biol. 2019 Jul 23;12(1):112-118. doi: 10.1080/19420889.2019.1643665. eCollection 2019. Commun Integr Biol. 2019. PMID: 31413787 Free PMC article.
  • Structure of CYRI-B (FAM49B), a key regulator of cellular actin assembly.
    Kaplan E, Stone R, Hume PJ, Greene NP, Koronakis V. Kaplan E, et al. Acta Crystallogr D Struct Biol. 2020 Oct 1;76(Pt 10):1015-1024. doi: 10.1107/S2059798320010906. Epub 2020 Sep 23. Acta Crystallogr D Struct Biol. 2020. PMID: 33021503 Free PMC article.
  • Actin dynamics in cell migration.
    Schaks M, Giannone G, Rottner K. Schaks M, et al. Essays Biochem. 2019 Oct 31;63(5):483-495. doi: 10.1042/EBC20190015. Essays Biochem. 2019. PMID: 31551324 Free PMC article. Review.
  • Requirements for and consequences of Rac-dependent protrusion.
    Steffen A, Koestler SA, Rottner K. Steffen A, et al. Eur J Cell Biol. 2014 May-Jun;93(5-6):184-93. doi: 10.1016/j.ejcb.2014.01.008. Epub 2014 Feb 11. Eur J Cell Biol. 2014. PMID: 24629839 Review.

Cited by

References

    1. Bai, J., and Montell D.. 2002. Eyes absent, a key repressor of polar cell fate during Drosophila oogenesis. Development. 129:5377–5388. 10.1242/dev.00115 - DOI - PubMed
    1. Bieling, P., and Rottner K.. 2023. From WRC to Arp2/3: Collective molecular mechanisms of branched actin network assembly. Curr. Opin. Cell Biol. 80:102156. 10.1016/j.ceb.2023.102156 - DOI - PubMed
    1. Bischof, J., Maeda R.K., Hediger M., Karch F., and Basler K.. 2007. An optimized transgenesis system for Drosophila using germ-line-specific phiC31 integrases. Proc. Natl. Acad. Sci. USA. 104:3312–3317. 10.1073/pnas.0611511104 - DOI - PMC - PubMed
    1. Bogdan, S., Stephan R., Löbke C., Mertens A., and Klämbt C.. 2005. Abi activates WASP to promote sensory organ development. Nat. Cell Biol. 7:977–984. 10.1038/ncb1305 - DOI - PubMed
    1. Böttcher, R., Hollmann M., Merk K., Nitschko V., Obermaier C., Philippou-Massier J., Wieland I., Gaul U., and Förstemann K.. 2014. Efficient chromosomal gene modification with CRISPR/cas9 and PCR-based homologous recombination donors in cultured Drosophila cells. Nucleic Acids Res. 42:e89. 10.1093/nar/gku289 - DOI - PMC - PubMed

MeSH terms

Substances