Comparative Study
. 2025 Jan 1;328(1):H161-H173.
doi: 10.1152/ajpheart.00252.2024. Epub 2024 Oct 25.

Differential effects of myosin activators on myocardial contractile function in nonfailing and failing human hearts

Affiliations
Comparative Study

Differential effects of myosin activators on myocardial contractile function in nonfailing and failing human hearts

Joohee Choi et al. Am J Physiol Heart Circ Physiol. .

Abstract

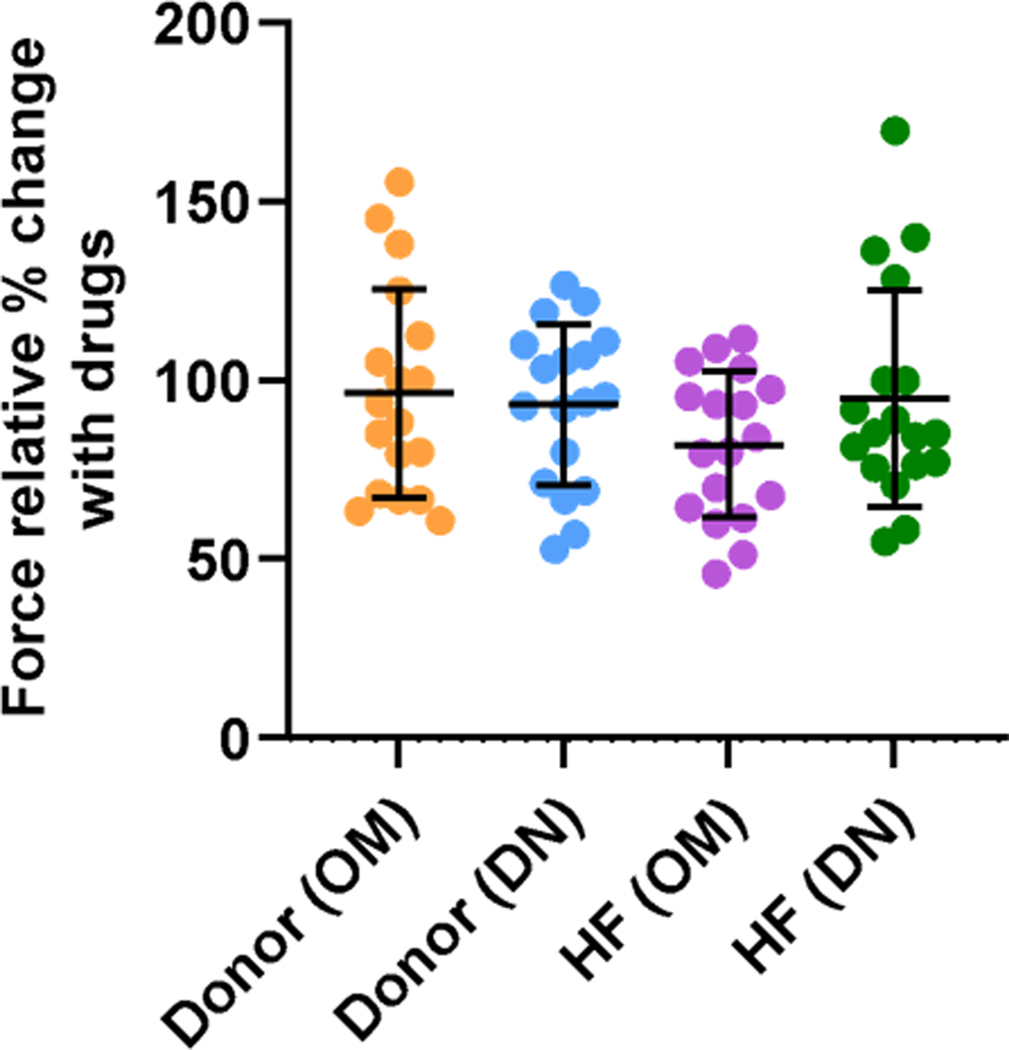
The second-generation myosin activator danicamtiv (DN) has shown improved function compared with the first-generation myosin activator omecamtiv mecarbil (OM) in nonfailing myocardium by enhancing cardiac force generation but attenuating slowed relaxation. However, whether the functional improvement with DN compared with OM persists in remodeled failing myocardium remains unknown. Therefore, this study aimed to investigate the differential contractile responses to myosin activators in nonfailing and failing myocardium. Mechanical measurements were performed in detergent-skinned myocardium isolated from donor and failing human hearts. Steady-state force, stretch activation responses and loaded shortening velocity were analyzed at submaximal [Ca2+] in the absence or presence of 0.5 µmol/L OM or 2 µmol/L DN. The effects of DN and OM on Ca2+ sensitivity of force generation were determined by incubating myocardial preparations at various [Ca2+]. The inherent impairment in force generation and cross-bridge behavior sensitized the failing myocardium to the effects of myosin activators. Specifically, increased Ca2+ sensitivity of force generation, slowed rates of cross-bridge recruitment and detachment following acute stretch, slowed loaded shortening velocity, and diminished power output were more prominent following treatment with OM or DN in failing myocardium compared with donor myocardium. Although these effects were less pronounced with DN compared with OM in failing myocardium, DN impaired contractile properties in failing myocardium that were not affected in donor myocardium. Our results indicate that similar to first-generation myosin activators, the DN-induced slowing of cross-bridge kinetics may result in a prolongation of systolic ejection and delayed diastolic relaxation in the heart failure setting.NEW & NOTEWORTHY This is the first study to provide a detailed mechanistic comparison of omecamtiv mecarbil (OM) and danicamtiv (DN) in failing and nonfailing human myocardium. These findings have clinical implications and the potential to inform the clinical utility of myosin activators in the heart failure setting.

Keywords: contractile function; danicamtiv; heart failure; myocardium; omecamtiv mecarbil.


Conflict of interest statement

DISCLOSURES

No conflicts of interest, financial or otherwise, are declared by the authors.

Figures

Figure 1.
Figure 1.
Representative cross-bridge dynamic stretch activation and force redevelopment. A. The force response was measured by stretching myocardial preparations to 2% of a muscle length, holding it for 8 seconds, and returning to the original length. The dynamic stretch activation is measured during the initial 8 seconds and the force redevelopment is recorded when the myocardial preparation is returned to the original length. B. The key features of the dynamic stretch activation. A sudden 2% stretch in muscle length is followed by an instantaneous spike in the force response (Phase 1). The force then rapidly decays (Phase 2) to a minimum with a dynamic rate constant krel (s−1), an index of cross-bridge detachment from actin. Following Phase 2, a gradual increase in force with a dynamic rate constant kdf (s−1) occurs (Phase 3), an index of the rate of cross-bridge recruitment as cross-bridges transition into the force-bearing state. P1 represents the magnitude of the stiffness of the cross-bridge. P2 represents the magnitude of strained cross-bridge detachment into a non-force-bearing state which is the lowest point of phase 2. P3 represents the new steady-state force, achieved from the prestretch steady-state force to the peak force value obtained in Phase 3. Pdf represents the magnitude of cross-bridge recruitment calculated as the difference between P3 and P2 values. C. The figure shows an expanded view of cross-bridge detachment kinetics. The initial phase shows a linear fast phase (i.e., krel (FAST), represented as orange dash line) while the second phase shows an exponential slow phase (i.e., krel (SLOW), represented as blue dash line). D. The figure shows the expanded view between Phase 2 and Phase 3. Td, the time required to reach the total cross-bridge detachment analyzed by the time difference between P1 and P2; Tr, the time required to reach the starting point of the force development measured by the time difference between P1 and the starting point of kdf.
Figure 2.
Figure 2.
Phosphorylation levels of contractile proteins in donor and HF myocardium. A. Representative Coomassie-stained SDS gel and Pro-Q Diamond stain showing the expression and phosphorylation status of myofilament proteins in donor and HF samples. B. Quantification of phosphorylation of cMyBPC, cTnT, cTnI, and RLC in donor and HF samples. Cardiac samples were isolated from the same hearts used in the mechanical studies. 6 hearts were used for each group. Values reported are means ± SD. cMyBPC, cardiac myosin binding protein-C; cTnI, cardiac troponin I; cTnT, cardiac troponin T; HF, heart failure; RLC, myosin regulatory light chain
Figure 3.
Figure 3.
Effect of OM and DN on force-pCa relationships. Force-pCa relationships were analyzed with a nonlinear fit (sigmoidal dose-response). Donor and HF myocardium pCa data is shown overlaid on pretreatment values. 2 myocardial fibers from 1 heart were studied. 6 hearts from each group were used for the analysis. Values reported are means ± SD. A. Force-pCa relationship of OM or DN treated donor myocardium. B. Force-pCa relationship of OM or DN treated HF myocardium. DN, danicamtiv; Fmax, Ca2+ activated maximal force measured at pCa 4.5; Fmin, Ca2+-independent force measured at pCa 9.0; HF, heart failure; nH, cooperativity of force production; OM, omecamtiv mecarbil; pCa50, Ca2+ sensitivity of myofilament.
Figure 4.
Figure 4.
Force relative % change from baseline following OM or DN incubation. The relative % change in parameters were measured by analyzing the net change from the parameters measured at baseline (untreated) and following OM or DN treatment. 3 myocardial fibers from 1 heart were studied. 6 hearts from each group were used for the analysis. Values reported are mean±SD. DN, danicamtiv; HF, heart failure; OM: omecamtiv mecarbil
Figure 5.
Figure 5.
Force relaxation kinetics. The representative stretch activation responses of the donor and HF myocardium prior to and following drug treatment. The relative % change in parameters was measured by analyzing the net change from the parameters at baseline (untreated) and following OM or DN treatment. 3 myocardial fibers from 1 heart were studied. 6 hearts from each group were used for the analysis. Values reported are means ± SD. A. Expanded views of force relaxation kinetics of OM or DN-treated donor myocardium. B. Expanded views of force relaxation kinetics of OM or DN-treated HF myocardium. C. a(SLOW) relative % change with drugs. D. b(FAST) relative % change with drugs. E. krel (SLOW) relative % change with drugs. F. krel (FAST) relative % change with drugs. a(SLOW), slow force decay rate amplitude; b(FAST), fast force decay rate amplitude; DN, danicamtiv; HF, heart failure; krel (FAST) (s−1), fast force decay rate; krel (SLOW) (s−1), slow force decay rate; OM, omecamtiv mecarbil.
Figure 6.
Figure 6.
Time course of cross-bridge detachment and recruitment. The representative stretch activation responses of the donor and HF myocardium prior to and following drug treatment. The relative % change in parameters was measured by analyzing the net change from the parameters at baseline (untreated) and following OM or DN treatment. Brown arrows represent Td. Blue arrows represent Tr. 3 myocardial fibers from 1 heart were studied. 6 hearts from each group were used for the analysis. Values reported are means ± SD. A. Stretch activation response of OM or DN treated donor myocardium. B. Stretch activation response of OM or DN-treated HF myocardium. C. Td relative % change with drugs D. Tr relative % change with drugs. DN, danicamtiv; HF, heart failure; OM, omecamtiv mecarbil; Td (ms), the time required to reach total cross-bridge detachment (i.e., P2); Tr (ms), the time required to start force development.
Figure 7.
Figure 7.
Cross-bridge recruitment kinetics and amplitudes. The representative stretch activation responses of the donor and HF myocardium prior to and following drug treatment. The relative % change in parameters were measured by analyzing the net change from the parameters at baseline (untreated) and following OM or DN treatment. Orange arrows represent the peak of the force development. 3 myocardial fibers from 1 heart were studied. 6 hearts from each group were used for the analysis. Values reported are means ± SD. A. Stretch activation responses of OM or DN-treated donor myocardium. B. Stretch activation responses of OM or DN-treated HF myocardium. C. kdf relative % decrease with drugs. DN, danicamtiv; HF, heart failure; kdf (s−1), cross-bridge recruitment rate; OM, omecamtiv mecarbil
Figure 8.
Figure 8.
Representative force redevelopment kinetics and relative % change with drugs. The representative stretch activation responses of the donor and HF myocardium prior to and following drug treatment. The relative % change in parameters were measured by analyzing the net change from the parameters at baseline (untreated) and following OM or DN treatment. Green arrows represent the peak of the force redevelopment. 3 myocardial fibers from 1 heart were studied. 6 hearts from each group were used for the analysis. Values reported are means ± SD. A. Force redevelopment kinetics of OM or DN-treated donor myocardium. B. Force redevelopment kinetics of OM or DN-treated HF myocardium. C. ktr relative % decrease with drugs. DN, danicamtiv; HF, heart failure; ktr (s−1), force redevelopment rate; OM, omecamtiv mecarbil
Figure 9.
Figure 9.
Representative force-velocity and force-power curves. A. Representative force responses of skinned myocardial preparation at different force clamps B. Representative length change traces of skinned myocardial preparation at different force clamps (blue lines represent shortening velocity). C. Representative force-velocity and force-power curves. D. Representative force-velocity and force-power curves of OM-treated donor myocardium. E. Representative force-velocity and force-power curves of DN-treated donor myocardium. F. Representative force-velocity and force-power curves of OM-treated HF myocardium. G. Representative force-velocity and force-power curves of DN-treated HF myocardium. DN, danicamtiv; HF, heart failure; OM, omecamtiv mecarbil; Pmax, maximal power output; Vmax, maximal shortening velocity; Vp, shortening velocity at Pmax.

Comment in

Similar articles

Cited by

References

    1. Psotka MA, Gottlieb SS, Francis GS, Allen LA, Teerlink JR, Adams KF, Rosano GMC, Lancellotti P. Cardiac Calcitropes, Myotropes, and Mitotropes. Journal of the American College of Cardiology 73: 2345–2353, 2019. doi: 10.1016/j.jacc.2019.02.051. - DOI - PubMed
    1. Teerlink JR, Diaz R, Felker GM, McMurray JJV, Metra M, Solomon SD, Adams KF, Anand I, Arias-Mendoza A, Biering-Sørensen T, Böhm M, Bonderman D, Cleland JGF, Corbalan R, Crespo-Leiro MG, Dahlström U, Echeverria LE, Fang JC, Filippatos G, … Kurtz CE Cardiac Myosin Activation with Omecamtiv Mecarbil in Systolic Heart Failure. New England Journal of Medicine, 384(2), 105–116. 10.1056/NEJMoa2025797 - DOI - PubMed
    1. Teerlink JR, Diaz R, Felker GM, McMurray JJV, Metra M, Solomon SD, Legg JC, Büchele G, Varin C, Kurtz CE, Malik FI, Honarpour N. Omecamtiv Mecarbil in Chronic Heart Failure With Reduced Ejection Fraction. JACC: Heart Failure 8: 329–340, 2020. doi: 10.1016/j.jchf.2019.12.001. - DOI - PubMed
    1. Fülöp GÁ, Oláh A, Csipo T, Kovács Á, Pórszász R, Veress R, Horváth B, Nagy L, Bódi B, Fagyas M, Helgadottir SL, Bánhegyi V, Juhász B, Bombicz M, Priksz D, Nanasi P, Merkely B, Édes I, Csanádi Z, Papp Z, Radovits T, Tóth A. Omecamtiv mecarbil evokes diastolic dysfunction and leads to periodic electromechanical alternans. Basic Res Cardiol 116: 24, 2021. doi: 10.1007/s00395-021-00866-8. - DOI - PMC - PubMed
    1. Voors AA, Tamby J, Cleland JG, Koren M, Forgosh LB, Gupta D, Lund LH, Camacho A, Karra R, Swart HP, Pellicori P, Wagner F, Hershberger RE, Prasad N, Anderson R, Anto A, Bell K, Edelberg JM, Fang L, Henze M, Kelly C, Kurio G, Li W, Wells K, Yang C, Teichman SL, Rio CL, Solomon SD. Effects of danicamtiv, a novel cardiac myosin activator, in heart failure with reduced ejection fraction: experimental data and clinical results from a phase 2a trial. Eur J Heart Fail 22: 1649–1658, 2020. doi: 10.1002/ejhf.1933. - DOI - PMC - PubMed

Publication types

LinkOut - more resources