. 2024 Nov 26;43(11):114876.
doi: 10.1016/j.celrep.2024.114876. Epub 2024 Oct 24.

Spatial, transcriptomic, and epigenomic analyses link dorsal horn neurons to chronic pain genetic predisposition

Affiliations

Spatial, transcriptomic, and epigenomic analyses link dorsal horn neurons to chronic pain genetic predisposition

Cynthia M Arokiaraj et al. Cell Rep. .

Abstract

Key mechanisms underlying chronic pain occur within the dorsal horn. Genome-wide association studies (GWASs) have identified genetic variants predisposed to chronic pain. However, most of these variants lie within regulatory non-coding regions that have not been linked to spinal cord biology. Here, we take a multi-species approach to determine whether chronic pain variants impact the regulatory genomics of dorsal horn neurons. First, we generate a large rhesus macaque single-nucleus RNA sequencing (snRNA-seq) atlas and integrate it with available human and mouse datasets to produce a single unified, species-conserved atlas of neuron subtypes. Cellular-resolution spatial transcriptomics in mouse shows the precise laminar location of these neuron subtypes, consistent with our analysis of neuron-subtype-selective markers in macaque. Using this cross-species framework, we generate a mouse single-nucleus open chromatin atlas of regulatory elements that shows strong and selective relationships between the neuron-subtype-specific chromatin regions and variants from major chronic pain GWASs.

Keywords: CP: Neuroscience; GWAS; cell types; chronic pain; human; mouse; multiplexed in situ hybridization; rhesus macaque; single-nucleus ATAC-seq; single-nucleus RNA sequencing; spatial transcriptomics; spinal cord; variants.


Conflict of interest statement

Declaration of interests A.R.P. is the founder of Snail Biosciences, Inc.

Figures
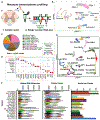
Figure 1.
Figure 1.. Macaque snRNA-seq dataset defines dorsal horn cell type identities and neuron subtypes
(A) Schematic overview of single-nuclear RNA sequencing (snRNA-seq) workflow for macaque lumbar dorsal horn (n = 3 macaques). (B) UMAP shows major cell types identified by previously established marker genes. (C) Contribution of each major cell type within the macaque dorsal horn snRNA-seq dataset. (D) Dot plot of the normalized mean expression of key marker genes used to identify each of the major cell types. Size of the circles depicts the percentage of cells within each cluster that express the gene. (E) UMAP visualization of the 1,954 dorsal horn neuronal nuclei identified through Leiden clustering. Excitatory clusters are prefixed with Exc and inhibitory clusters with Inh. (F) Quality control and number of nuclei per cluster, Left: violin plot of per-cell unique RNA molecules by cluster. Middle: violin plot of number of unique genes per cell found by cluster. Right: number of nuclei in each cluster.
Figure 2.
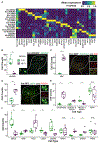
Figure 2.. Laminar distributions of macaque dorsal horn neuron subtypes using macaque-specific marker genes
(A) Heatmap of normalized mean expression of macaque-specific marker genes (mentioned in Figure S2B, dendrogram) for the neuronal subtypes. Inh-SORCS1* refers to the combined Inh-SORCS1/Inh-PDZD2 population, and Inh-MEF2C* refers to the combined Inh-MEF2C/Inh-NXPH1 population. (B–D) RNAscope in situ assays of select neuron subtypes show their laminar distributions. Images depict marker gene combinations used as in situ probes. Dorsal horn images are at 10×, and insets are magnified images (at 20×) for individual genes and the merged image. Dashed lines delineate laminar boundaries between II/III, III/IV, and IV/V. Scale bars: 100 μm. Boxplots indicate binned laminar distribution (superficial = I and II, deep = III–V) of cell counts by sample: n = 5 or 6 spinal cord sections from N = 2–3 macaques. ^Means ± S.E. *p < 0.05. (E) Boxplots indicate cell counts of inhibitory neuron subtypes by laminae. (F) Boxplots indicate cell counts of excitatory neuron subtypes by laminae.
Figure 3.
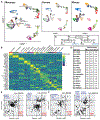
Figure 3.. Species-conserved dorsal horn subtype marker genes defined by the integration of adult macaque, human, and mouse snRNA-seq datasets
(A) UMAP shows dorsal horn neuron subtypes of each adult species in integrated coordinates (macaque, left; human, middle; mouse, right). Overlayed, colored dots represent nuclei from titled species, and light gray background dots represent nuclei from the two other species. Neuron subtype color scheme from (B). (B) Scaled gene expression of selected conserved marker genes. Rows are individual marker genes and columns are each neuron subtype. Each colored tick represents the expression of the given marker for an individual nucleus. Sets of marker genes for each cell type are shown in Table 1. (C) Schematic of an example decision tree to validate the choice of conserved marker genes for a given neuron subtype, in this case Inh-PDYN. The decision tree learns expression cutoffs that best separate the target cell type from off-target cells, trained using 80% of the macaque nuclei. (D) Decision tree test accuracies reported for each cell type and across the test sets of the three species: the remaining 20% of the macaque nuclei and all human and mouse nuclei. Mac, macaque; Hum, human. Additional metrics are provided in Tables S9, S10, S11, and S12. (E and F) Pseudo-bulk differential analysis for highlighted neuron subtypes indicate genes specialized in (E) macaque versus adult mouse and (F) macaque versus human. Genes shown (dots in scatterplot) are significantly different (p < 10e–5) in at least one species. Genes highlighted red are specialized in macaque (log fold change > 2 in macaque, log fold change <0 other). Genes in blue are specialized in mouse and human. Refer to Tables S13, S14, and S15 for differential expression statistics. *Scatterpoint representing gene lies beyond the axes shown.
Figure 4.
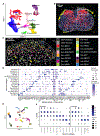
Figure 4.. Spatial transcriptomics of mouse spinal cord shows the location of major cell types and species-conserved dorsal horn neuron subtypes
(A) UMAP shows the major cell types identified with Xenium based on integration with adult mouse (n = 1) snRNA-seq dataset. (B) Spatial distribution of major cell types in a spinal cord cross-section. Individual dots represent individual cells segmented by Xenium. Dot color indicates cell type. Box indicates the location of representative dorsal horn section in (C). (C) Distinct neuron subtypes within the boxed region in (B). Individual neurons labeled based on RNA integration are shown with cell segmentation boundaries and individual colors indicated in legend (right). (D) Dot plot of gene expression patterns of neuron subtypes in Xenium. Left: species-conserved gene markers (as in Figure 3). Right: other genes of interest used to label dorsal horn neurons in mouse. Size of the dot indicates relative proportion of cells expressing the gene. (E) UMAP shows dorsal horn neuron subtypes identified with Xenium based on integration with adult mouse snRNA-seq dataset with conserved labels. Inh-SORCS1 and Inh-PDZD2 are combined, as the individual cell types are not readily distinguishable. Each cell is colored by the legend in (C) except for Inh-NPY in black. (F) Rexed laminar distribution of neuron subtypes across three spinal slices. Rexed laminae boundaries were determined by anatomical demarcation within Xenium Explorer. Proportions per neuron subtype were determined based on centroid coordinates of each neuron. Size and color of dots represent the proportion of each neuron subtype within each lamina (IIi, II inner; IIo, II outer).
Figure 5.
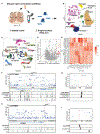
Figure 5.. Identification of species-conserved dorsal horn subtypes, TF motifs, and candidate regulatory SNPs using mouse snATAC-seq dataset
(A) Schematic overview of the snATAC-seq workflow of mouse lumbar dorsal horn (L3–L5, 5 female and 5 male pooled mice). (B) UMAP shows major cell types derived from snATAC-seq dataset after label transfer using RNA-ATAC integration and confirmation based on gene scores of marker genes. (C) UMAP shows dorsal horn neuron subtypes after neuron-specific re-clustering of snATAC-seq nuclei and label transfer using RNA-ATAC integration. The neuron subtype color scheme is same as that in Figures 3, 4, and 5. (D) Identification of positive transcription factor (TF) regulators. Motifs are considered TF regulators if they satisfy (1) top quartile of motif deviation, a measure of cell type specificity (y axis), and (2) their presence is correlated (>0.5, Pearson correlation) with the imputed gene expression of their corresponding TF (x axis). (E) Heatmap shows normalized motif deviation (Z score) of each TF regulator by neuron subtype. Black boxes highlight MAF and RORA motifs specific to Exc-MAF and NR3C1 motifs (glucocorticoid receptor) specific to Exc-LMO3 and Exc-SKOR2. TF, transcription factor. (F–I) Example GWAS SNPs near genes linked to spinal cord and chronic pain within subtype-specific mouse open chromatin peaks. (F and G) A LANCL1 SNP falling within Exc-TAC3/SKOR2/MAF peaks and (H and I) a FOXP2 SNP falling within an Inh-PDYN peak. Top sections of each image show Manhattan plots of significant SNPs (red dot, with rsID above) and nearby SNPs (blue dots) from Kupari et al. The bottom halves of each image show, from top to bottom, (1) nearby genes (Gene), (2) open chromatin peaks of the highlighted neuron subtype, and (3) peaks of other dorsal horn subtypes (Other). Translucent red rectangle highlights the SNP falling within the peak of interest. SNP, single-nucleotide polymorphism; eQTL, expression quantitative trait locus; chr2,7, chromosome 2,7; bp, base-pair range of locus.
Figure 6.
Figure 6.. Open chromatin profiles, rather than marker genes, of distinct dorsal horn neuron subtypes are enriched for human SNPs associated with chronic pain disorders
(A) Bar plot shows the proportion of marker genes for each neuron subtype that are either strictly specific to that neuron subtype (unique, blue) or are a marker gene for at least one other neuron subtype (shared, red). (B) Gene-based stratified LDSC based on marker gene enrichment only. Intronic and flanking non-coding regions of each neuron subtype (x axis of C) were aggregated. Backgrounds for all subtypes were intronic and flanking regions of all coding genes. Enrichment of GWAS SNPs per cell type versus background was estimated by stratified LDSC. Per the legend (shared by C, bottom left), darker purple indicates greater enrichment for the particular trait (y axis) and neuron subtype (x axis). The top three traits were non-neuronal negative controls. Significance based on FDR <0.05 is indicated by a black box around the square. (C) Stratified LDSC of subtype-specific open chromatin. Foregrounds for each neuron subtype are specific reproducible peaks from snATAC-seq. Backgrounds for each subtype are the union of foregrounds merged with a large mouse DNase hypersensitivity site dataset (see STAR Methods). Legend and interpretation are the same as those in (B). Estimated enrichments for glial cell types from the same dataset, as well as bulk liver, putamen, and hippocampal brain neurons and naive, interferon (IFN)-B, and IFN-G immune cells from separate datasets (details in STAR Methods). J, Johnson et al.; Kh, al Khoury et al.; Ku, Kupari et al.; LDSC, linkage disequilibrium score regression; FDR, false discovery rate; GWAS, genome-wide association study.

References

    1. Koch SC, Acton D, and Goulding M (2018). Spinal Circuits for Touch, Pain, and Itch. Annu. Rev. Physiol 80, 189–217. - PMC - PubMed
    1. Peirs C, and Seal RP (2016). Neural circuits for pain: Recent advances and current views. Science 354, 578–584. - PMC - PubMed
    1. Al-Chaer ED, Feng Y, and Willis WD (1999). Comparative Study of Viscerosomatic Input Onto Postsynaptic Dorsal Column and Spinothalamic Tract Neurons in the Primate. J. Neurophysiol 82, 1876–1882. - PubMed
    1. Christensen BN, and Perl ER (1970). Spinal neurons specifically excited by noxious or thermal stimuli: marginal zone of the dorsal horn. J. Neurophysiol 33, 293–307. - PubMed
    1. Al-Khater KM, Kerr R, and Todd AJ (2008). A quantitative study of spinothalamic neurons in laminae I, III, and IV in lumbar and cervical segments of the rat spinal cord. J. Comp. Neurol 511, 1–18. - PMC - PubMed

Publication types

Associated data