Defining Postinduction Hemodynamic Instability With an Automated Classification Model
- PMID: 39453850
- PMCID: PMC11687939
- DOI: 10.1213/ANE.0000000000007315
Defining Postinduction Hemodynamic Instability With an Automated Classification Model
Abstract
Background: Postinduction hypotension (PIH) may be associated with increased morbidity and mortality. In earlier studies, the definition of PIH is solely based on different absolute or relative thresholds. However, the time-course (eg, how fast blood pressure drops during induction) is rarely incorporated, whereas it might represent the hemodynamic instability of a patient. We propose a comprehensive model to distinguish hemodynamically unstable from stable patients by combining blood pressure thresholds with the magnitude and speed of decline.
Methods: This prospective study included 375 adult elective noncardiac surgery patients. Noninvasive blood pressure was continuously measured between 5 minutes before up to 15 minutes after the first induction agent had been administered. An expert panel rated whether the patient experienced clinically relevant hemodynamic instability or not. Interrater correlation coefficient and intraclass correlation were computed to check for consistency between experts. Next, an automated classification model for clinically relevant hemodynamic instability was developed using mean, maximum, minimum systolic, mean, diastolic arterial blood pressure (SAP, MAP, and DAP, respectively) and their corresponding time course of decline. The model was trained and tested based on the hemodynamic instability labels provided by the experts.
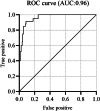
Results: In total 78 patients were classified as having experienced hemodynamic instability and 279 as not. The hemodynamically unstable patients were significantly older (7 years, 95% confidence interval (CI), 4-11, P < .001), with a higher prevalence of chronic obstructive pulmonary disease (COPD) (3% higher, 95% CI, 1-8, P = .036). Before induction, hemodynamically unstable patients had a higher SAP (median (first-third quartile): 161 (145-175) mm Hg vs 150 (134-166) mm Hg, P < .001) compared to hemodynamic stable patients. Interrater agreement between experts was 0.92 (95% CI, 0.89-0.94). The random forest classifier model showed excellent performance with an area under the receiver operating curve (AUROC) of 0.96, a sensitivity of 0.84, and specificity of 0.94.
Conclusions: Based on the high sensitivity and specificity, the developed model is able to differentiate between clinically relevant hemodynamic instability and hemodynamic stable patients. This classification model will pave the way for future research concerning hemodynamic instability and its prevention.
Copyright © 2024 The Author(s). Published by Wolters Kluwer Health, Inc. on behalf of the International Anesthesia Research Society.
Conflict of interest statement
Conflicts of Interest, Funding: Please see DISCLOSURES at the end of this article.
Figures


References
-
- Claeys MA, Gepts E, Camu F. Haemodynamic changes during anaesthesia induced and maintained with propofol. Br J Anaesth. 1988;60:3–9. - PubMed
-
- Larsen R, Rathgeber J, Bagdahn A, Lange H, Rieke H. Effects of propofol on cardiovascular dynamics and coronary blood flow in geriatric patients: a comparison with etomidate. Anaesthesia. 1988;43:25–31. - PubMed
-
- Reich DL, Hossain S, Krol M, et al. Predictors of hypotension after induction of general anesthesia. Anesth Analg. 2005;101:622–628. - PubMed
-
- Green RS, Butler MB. Postintubation hypotension in general anesthesia: a retrospective analysis. J Intensive Care Med. 2016;31:667–675. - PubMed
MeSH terms
LinkOut - more resources
Full Text Sources
Medical
Miscellaneous

