. 2024 Nov 5;18(44):30405-30420.
doi: 10.1021/acsnano.4c07610. Epub 2024 Oct 25.

Mitochondrial Bioenergetics of Functional Wound Closure is Dependent on Macrophage-Keratinocyte Exosomal Crosstalk

Affiliations

Mitochondrial Bioenergetics of Functional Wound Closure is Dependent on Macrophage-Keratinocyte Exosomal Crosstalk

Anu Sharma et al. ACS Nano. .

Abstract

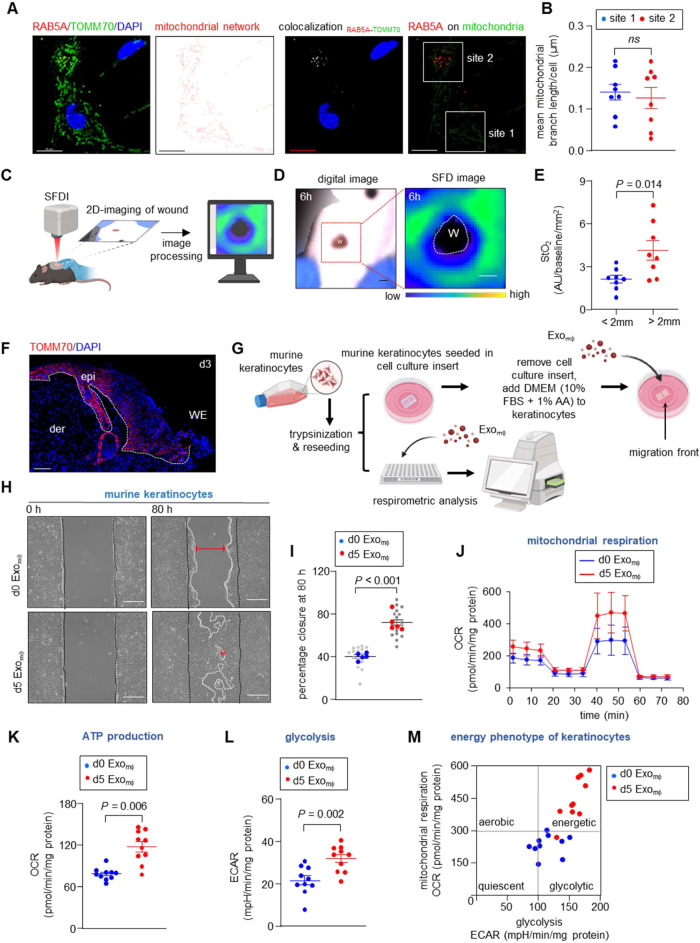
Tissue nanotransfection (TNT)-based fluorescent labeling of cell-specific exosomes has shown that exosomes play a central role in physiological keratinocyte-macrophage (mϕ) crosstalk at the wound-site. Here, we report that during the early phase of wound reepithelialization, macrophage-derived exosomes (Exo), enriched with the outer mitochondrial membrane protein TOMM70, are localized in leading-edge keratinocytes. TOMM70 is a 70 kDa adaptor protein anchored in the mitochondrial outer membrane and plays a critical role in maintaining mitochondrial function and quality. TOMM70 selectively recognizes cytosolic chaperones by its tetratricopeptide repeat (TPR) domain and facilitates the import of preproteins lacking a positively charged mitochondrial targeted sequence. Exosomal packaging of TOMM70 in mϕ was independent of mitochondrial fission. TOMM70-enriched Exo compensated for the hypoxia-induced depletion of epidermal TOMM70, thereby rescuing mitochondrial metabolism in leading-edge keratinocytes. Thus, macrophage-derived TOMM70 is responsible for the glycolytic ATP supply to power keratinocyte migration. Blockade of exosomal uptake from keratinocytes impaired wound closure with the persistence of proinflammatory mϕ in the wound microenvironment, pointing toward a bidirectional crosstalk between these two cell types. The significance of such bidirectional crosstalk was established by the observation that in patients with nonhealing diabetic foot ulcers, TOMM70 is deficient in keratinocytes of wound-edge tissues.

Keywords: TOMM70; functional wound closure; keratinocyte migration; macrophage-derived exosomes; macrophage–keratinocyte crosstalk; tissue nanotransfection; “don’t eat me” plasmid.


Conflict of interest statement

The authors declare no competing financial interest.

Figures

Figure 1
Figure 1
Application of a deep learning algorithm for tissue segmentation in WE tissue postimaging mass cytometry identified keratinocyte-mϕ crosstalk as the predominant exosome-mediated paracrine signaling. (A) Schematic diagram showing delivery of plasmid cocktails in WE tissue of C57BL/6 mice at different time points. (B) Schematic diagram showing the staining of murine WE tissue with metal-conjugated antibodies for Imaging Mass Cytometry. Localization of Exoκ and Exo in dermis d3 post-TNT. Scale, 100 and 10 μm. (C) Deep learning algorithm-based marker antibodies were used for tissue segmentation. Based on the segmentation, the skin and WE tissue were divided into six segments: background (BG), hair follicles (HF), epidermis (E), dermis (D), hypodermis (HD), and adipose tissue (A). A deep learning classifier based on DNA1 and DNA2 channels with expansion of the cell body from the nuclei was used for cell segmentation. The white circle indicates the entire cell, and the red circle demonstrates nuclear compartments. (D) t-SNE plot with a binary color bar showing an abundance of F4/80 cell distributions at d0, d3, and d7 post wounding. (E) Abundance of Exoκ in F4/80+ cells was plotted on a tSNE plot with a continuous color bar. (F) Heat map showing the distribution of Exoκ in different cell types at d0, d3, and d7 post wounding. (G) t-SNE plot with a binary color bar showing an abundance of e-cadherin+ cell distributions at d0, d3, and d7 post wounding. (H) Abundance of Exo in e-cadherin+ cells was plotted on a t-SNE plot with a continuous color bar. (I) Heat map showing the distribution of Exo in different cell types at d0, d3, and d7 post wounding. (J) Representative high-resolution confocal microscopic images demonstrating the presence of Exo (red) in keratinocytes (green) in murine d5 WE tissue. Scale, 100, 20, and 10 μm.
Figure 2
Figure 2
Macrophage-derived exosomes isolated from WE tissue showed an abundance of mitochondrial proteins. (A) Schematic diagram showing isolation of Exo from murine WE tissue. Field emission scanning electron microscopy (FESEM) images demonstrate the presence of Exo on RFP magnetic beads. Scale, 5 μm. (B) Particle size distribution of Exo from murine WE tissue (n = 10). (C) Representative transmission electron microscopy (TEM) and FESEM images of Exo. Scale, 100 nm. (D) Schematic diagram of endosomal pathway showing early, intermediate, and late endosomal markers. (E) Bead flow cytometric analysis of murine Exo conjugated with supermagnetic Dynabeads functionalized with the RFP antibody showing binding of RAB5APE, RAB7AFITC, and RAB11AAF647 antibodies. The histogram demonstrates the shift in FITC and AF647 fluorescence after binding with the antibodies. The mean percentage of beads with Exo was mentioned over the marker bar. (F) Antibody array of Exo isolated from murine skin and WE tissue. ALIX, TSG101, CD63, CD81, FLOT1, exosomal marker; EpCAM = epithelial cell adhesion molecule; ANXA5, Annexin 5. *Positive control for HRP detection of exosomes derived from the human serum. (G) Exo were isolated and quantified using NTA from murine skin and d5 WE tissue after nanotransfection with the Lyz2 plasmid cocktail (n = 10). (H) Zeta potentials of Exo isolated from murine skin and d5 WE tissue at physiological pH (pH 7.4). Each gray dot corresponds to one technical replicate, and the blue and red dots correspond to biological replicates (n = 5). (I) Fourier Transform Infrared (FTIR) spectra of Exo isolated from murine skin and d5 WE tissue. (J) Two-dimensional (2D) score plot constructed from principal component analysis of FTIR spectra of Exo isolated from murine skin and d5 WE tissue (n = 3). (K) Bead flow cytometric analysis of murine Exo conjugated with supermagnetic Dynabeads functionalized with the RFP antibody showing binding of TOMM70AF647, Prohibitin 1AF647, and VDAC1AF647 antibodies. The histogram demonstrates the shift in fluorescence after binding with the antibodies. The mean percentage of beads with Exo was mentioned over the marker bar. Data are representative of three independent experiments. Data in panels (D) and (E) are shown as mean ± standard error of the mean (SEM) and are analyzed by two-tailed unpaired Student’s t-test.
Figure 3
Figure 3
TOMM70 is actively packaged in Exo that augments keratinocyte migration. (A) Representative immunocytochemistry of RAB5A (red) and TOMM70 (green) in murine proinflammatory mϕ. TOMM70 signal was used for mitochondria morphology analysis. MiNA tool on the ImageJ interface was used to show the skeletonized images of the mitochondrial network. Colocalization of TOMM70 with RAB5A was shown as white dots. The red fluorescence of RAB5A was superimposed with the mitochondrial network (green) for the quantification of mean mitochondrial branch length. Scale, 10 μm. (B) Quantification of the mean mitochondrial branch length from areas with and without RAB5A colocalization (n = 8). (C) Schematic diagram demonstrating the experimental setup of Spatial Frequency Domain Imaging (SFDI) of the murine dorsal excisional wound. (D) Digital and SFDI photographs of murine dorsum 6 h post wounding. Scale, 1.5 mm (E). (E) Quantification of cutaneous tissue O2 saturation at WE (<2 mm) and skin (>2 mm) analyzed from SFD images (n = 8). (F) Immunohistochemistry of TOMM70 with DAPI counterstaining in d3 murine WE tissue. White dashed lines indicate the dermal–epidermal junction. Scale, 100 μm. (G) Schematic experimental design for respirometric study and cell migration assay. (H) Representative phase-contrast microscopic images of murine keratinocytes at 0 h and 80 h showing migration following treatment with Exo isolated from murine skin (d0) and d5 WE tissue. Scale 200 μm. (I) Keratinocyte migrations were quantified and expressed as percentage closure. For each image, the distance of the migrating front at the top, middle, and bottom was measured (gray dots) and the mean value was plotted (blue, red) (n = 5). (J) Baseline OCR in murine keratinocytes after the addition of Exo isolated from murine skin (d0, blue dots) and d5 WE tissue (red dots) was plotted graphically. (K, L) ATP production and glycolysis in murine keratinocytes as calculated from OCR and ECAR (n = 10). (M) Energy phenotype of keratinocytes analysis as calculated from OCR and ECAR (n = 10). Data in panels (B, E, I, K, and L) are shown as mean ± SEM and are analyzed by two-tailed unpaired Student’s t-test.
Figure 4
Figure 4
Bidirectional crosstalk between WE mϕ and resident keratinocytes is critical for functional wound closure. (A) Design of Krt14-promoter-driven tetraspanins plasmid-connected via the IRES element with “don’t eat me”-CD47 sequence with “in-frame” GFP and RFP reporter. (B) Representative phase-contrast confocal images showing coexpression of RFP (red) and GFP (green) in murine keratinocytes. Scale, 20 μm. (C) Flow cytometric analysis of murine Exoκ on pan CD magnetic beads showing dual positivity of GFP and RFP on “don’t eat me” Exoκ-GFP-CD47-RFP. (D) Schematic experimental design. (E) Digital photographs of the excisional stented punch wound (6 mm) at d0 and d12 post wounding in C57BL/6 mice treated with either TNTκ-GFP or TNTκ-GFP-CD47-RFP. (F) Quantification of the wound area by digital planimetry following TNTκ-GFP or TNTκ-GFP-CD47-RFP. Scale, 2 mm (n = 20). (G) TEWL in C57BL/6 mice at d12 post wounding following TNTκ-GFP or TNTκ-GFP-CD47-RFP. The gray dots represent normal skin (n = 16). (H) Representative H&E staining of wounds of C57BL/6 mice at d12 post wounding following either TNTκ-GFP or TNTκ-GFP-CD47-RFP. Scale, 1000 μm. The blue vertical arrowhead represents complete reepithelialization. The red arrowhead represents the WE. (I) Morphometric analysis showing an epithelial gap, wound length, and granulation tissue area in C57BL/6 mice at d12 post wounding following either TNTκ-GFP or TNTκ-GFP-CD47-RFP (n = 6). (J) Representative coimmunofluorescence staining of F4/80 (red) with iNOS (green) and DAPI counterstaining in the WE granulation tissue at d12 post wounding in C57BL/6 mice following either TNTκ-GFP or TNTκ-GFP-CD47-RFP. (K, L) Quantification of F4/80 and iNOS intensity in WE tissue at d12 post wounding in C57BL/6 mice following either TNTκ-GFP or TNTκ-GFP-CD47-RFP. Each corresponds to one quantified ROI, except the blue and red dots, which correspond to the mean of each mouse. At least 5 ROI per mouse (n = 4 and 5). (M) Heat map showing the expression of proinflammatory markers COX2, MCP-1, and MIP-1α in WE granulation tissue at d12 post wounding in C57BL/6 mice following either TNTκ-GFP or TNTκ-GFP-CD47-RFP (see Figure S5h). Data in panels (C, F, G, I, K, and L) are shown as mean ± SEM and are analyzed by two-tailed unpaired Student’s t test.

References

    1. Wilkinson H. N.; Hardman M. J. Wound healing: cellular mechanisms and pathological outcomes. Open Biol. 2020, 10 (9), 20022310.1098/rsob.200223. - DOI - PMC - PubMed
    1. Viola A.; Munari F.; Sánchez-Rodríguez R.; Scolaro T.; Castegna A. The Metabolic Signature of Macrophage Responses. Front. Immunol. 2019, 10, 1462.10.3389/fimmu.2019.01462. - DOI - PMC - PubMed
    1. Hasan M. N.; Capuk O.; Patel S. M.; Sun D.. The Role of Metabolic Plasticity of Tumor-Associated Macrophages in Shaping the Tumor Microenvironment Immunity. Cancers 2022, 14 ( (14), 3331.10.3390/cancers14143331. - DOI - PMC - PubMed
    1. Susser L. I.; Nguyen M. A.; Geoffrion M.; Emerton C.; Ouimet M.; Khacho M.; Rayner K. J. Mitochondrial Fragmentation Promotes Inflammation Resolution Responses in Macrophages via Histone Lactylation. Mol. Cell. Biol. 2023, 43 (10), 531–546. 10.1080/10985549.2023.2253131. - DOI - PMC - PubMed
    1. Chen A. N.; Luo Y.; Yang Y. H.; Fu J. T.; Geng X. M.; Shi J. P.; Yang J. Lactylation, a Novel Metabolic Reprogramming Code: Current Status and Prospects. Front. Immunol. 2021, 12, 68891010.3389/fimmu.2021.688910. - DOI - PMC - PubMed

Publication types

Substances

LinkOut - more resources