. 2024 Oct 25;10(43):eadn7573.
doi: 10.1126/sciadv.adn7573. Epub 2024 Oct 25.

Mice lacking acid-sensing ion channel 2 in the medial prefrontal cortex exhibit social dominance

Affiliations

Mice lacking acid-sensing ion channel 2 in the medial prefrontal cortex exhibit social dominance

Boren Lin et al. Sci Adv. .

Abstract

Social dominance is essential for maintaining a stable society and has both positive and negative impacts on social animals, including humans. However, the regulatory mechanisms governing social dominance, as well as the crucial regulators and biomarkers involved, remain poorly understood. We discover that mice lacking acid-sensing ion channel 2 (ASIC2) exhibit persistently higher social dominance than their wild-type cagemates. Conversely, overexpression of ASIC2 in the medial prefrontal cortex reverses the dominance hierarchy observed in ASIC2 knockout (Asic2-/-) mice. Asic2-/- neurons exhibit increased synaptic transmission and plasticity, potentially mediated by protein kinase A signaling pathway. Furthermore, ASIC2 plays distinct functional roles in excitatory and inhibitory neurons, thereby modulating the balance of neuronal activities underlying social dominance behaviors-a phenomenon suggestive of a cell subtype-specific mechanism. This research lays the groundwork for understanding the mechanisms of social dominance, offering potential insights for managing social disorders, such as depression and anxiety.


Figures

Fig. 1.
Fig. 1.. Asic2−/− mice exhibit a superior social ranking compared to their WT cagemates in dominance behavior tests.
(A) Protocol of mouse tube test assay. Four mice housed together for 2 weeks undergo a round-robin tournament to determine social ranking. (B) Typical ranking of a group of one Asic2−/− mouse versus three WT cagemates. (C) Average number of winning times in trials 1 and 7. (D) Comparison of winning times between WT and Asic2−/− mice shows that Asic2−/− mice have higher winning times. ****P < 0.0001, one-way ANOVA. n = 28 cages. (E) Typical ranking of three Asic2−/− mice versus one WT cagemate. (F) Average number of winning times in trials 1 and 7. (G) Three Asic2−/− mice exhibit higher winning times than one WT cagemate. ****P < 0.0001; ns, nonsignificant, one-way ANOVA. n = 7 cages. (H) Comparison of winning times between groups of one Asic2−/− mouse versus three WT cagemates and one WT mouse versus three Asic2−/− cagemates, using data from (B) to (G). ***P = 0.0007, two-tailed unpaired Student’s t test. (I) Comparison of winning times between groups of one Asic1a−/− mouse versus three WT cagemates, and one WT mouse versus three Asic1a−/− cagemates. ns, P = 0.8477, two-tailed unpaired Student’s t test. n = 7 cages. (J and K) Schematic of mouse warm spot test and correlation with tube test rank. P = 0.0118, two-sided Fisher’s exact test. n = 16 cages. (L and M) Schematic of mouse urine marking test and correlation with tube test rank. P = 0.0118, two-sided Fisher’s exact test. n = 16 cages.
Fig. 2.
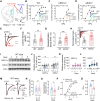
Fig. 2.. Acid-induced ASIC-like currents in the mPFC correlate with social ranking.
(A) Recordings of acid-induced currents in the mPFC slice. (B to D) pH-dependent ASIC currents in WT (B) (n = 5 to 13 cells per pH dose, from four mice), Asic1a−/− (C) (n = 5 to 21 cells per pH dose, from four mice) and Asic2−/− (D) neurons (n = 5 to 12 cells per pH dose, from 4 mice). (E) Normalized ASIC currents in WT (black) and Asic2−/− (red) neurons. (F) Current density at pH 5.0 in WT and Asic2−/− neurons. ns, P = 0.2828. (G) Desensitization decay times (τ), **P = 0.0058, n = 16 cells per four mice. (H) Normalized ASIC current per unit time. ****P < 0.0001, n = 15 cells per four mice. (I) Representative Western blot data illustrating the expression of ASIC1a and ASIC2 in WT mice with different rankings in the tube test. (J) Average expression data for ASIC1a and ASIC2. ns, P = 0.1592, **P < 0.007. (K and L) Correlation curves depicting expressions of ASIC1a [Pearson correlation coefficient (r) = −0.23, P = 0.18, ns] and ASIC2 (r = −0.80, **P = 0.005) in relation to social rankings, n = 9 mice in each ranking group. (M) Representative ASIC currents in neurons from winner (α) and loser (δ) mice. (N and O) Average current density and τ of ASIC currents. ns, P = 0.4211; *P = 0.0113, n = 21 cells per four mice. (P) pH-dependent ASIC currents in WT mice were analyzed to determine pH50 values, obtained by best-fitting with the Hill equation. (Q) Average pH50 between neurons in α and δ mice. ****P < 0.0001, n = 13 to 15 cells per four mice.
Fig. 3.
Fig. 3.. Restoration of ASIC2 in the mPFC of Asic2−/− mice decreased social ranking.
(A) Schematic showing the injection of AAV2-CMV-mASIC2 into the mPFC in Asic2−/− mice. (B) Left, a representative image of the AAV2-mASIC2 injection site and neurons expressing mASIC2; middle-right, representative recording of acid-induced ASIC-like currents in the GFP positive and negative neurons. (C) The representative comparison of acid-induced currents among WT, Asic2−/− (non-GFP cells), and AAV-mASIC2 neurons (GFP positive cells). (D and E) Comparison of desensitization decay times (D) and density (E) of the acid-induced currents in the neurons in (C). WT versus Asic2−/−, **P = 0.0012, Asic2−/− versus AAV-mASIC2, **P = 0.0082; AAV-mASIC2 versus AAV-sham, *P = 0.0129, ns, P = 0.6763, one-way ANOVA. n = 12 to 15 cells from four mice. (F) Schematic showing the tube test protocol before and after AAV-mediated expression of ASIC2 in the mPFC of Asic2−/− mice. (G) Representative result of ranking in the tube test following the restoration of ASIC2 in mPFC neurons of Asic2−/− mice. (H) Average winning times in the tube test after restoring ASIC2 in mPFC neurons of Asic2−/− mice. (I) Comparison of winning times between the group with restored ASIC2 in Asic2−/− mice and one of its WT subordinates. **P = 0.0092; ns, P = 0.3652, two-tailed unpaired Student’s t test. n = 9 cages.
Fig. 4.
Fig. 4.. Deletion of ASIC2 enhances synaptic transmission in social dominance.
(A) Recording site schematic in the mPFC. (B to D) PPR recorded with 50- to 500-ms interstimulus intervals. Left: Representative PPR traces at 50 ms in WT and Asic2−/− mice before and after social rankings. Right: Average PPR plotted against intervals. (C) *P = 0.0433; (D) **P = 0.0088, 0.0044, *P = 0.0481, n = 10 cells per four mice. (E) Representative AMPAR-EPSCs (−80 mV) and NMDAR-EPSCs (+60 mV) in WT and Asic2−/− neurons. (F) Average AMPAR/NMDAR ratios before and after social rankings. Current amplitudes measured 70 ms after onset. ns, P = 0.6117; *P = 0.0470; ***P = 0.0006. n = 22 to 29 cells per five mice. (G and H) mEPSCs in the groups of WT versus WT, and WT versus Asic2−/− mice after social rankings. Upper: Representative mEPSC traces. Lower: Cumulative distributions of mEPSC amplitudes and interevent intervals. (G) *P = 0.0342; ns, P = 0.4768; (H) *P = 0.0109, 0.0065, n = 18 cells per four mice. (I) AMPAR current rectification in WT and Asic2−/− neurons before social rankings. Left: Current-voltage relationships of AMPARs. Inset: Representative AMPAR-EPSC traces at −80 mV and +60 mV. NMDARs blocked with 100 μM d-APV. Right: AMPAR current rectification index (−80 mV/+60 mV). ns, P = 0.5913. n = 18 cells per four mice. (J and K) AMPAR current rectification of WT versus WT, and WT versus Asic2−/− neurons after social rankings. ns, P = 0.4467; ***P = 0.0003, n = 22 cells per four mice. (L to N) Time course of 50 μM NASPM effect on EPSCs in mPFC neurons of WT versus WT (M) and Asic2−/− versus WT (N) mice groups before (L) and after (M and N) social rankings. NMDARs blocked with 100 μM d-APV. Right: NASPM-sensitive EPSC comparison. ns, P = 0.9864, P = 0.1059; ****P < 0.0001, n = 10 cells per four mice. All comparisons by two-tailed unpaired Student’s t test.
Fig. 5.
Fig. 5.. Deletion of ASIC2 fosters dendrite and spine remodeling in social dominance.
(A) Dendritic and spine morphology of mPFC neurons using Alexa 568 dye. (B) Sholl analysis for dendritic branches. Left: Parameters measured with Sholl shells from the cell body. Right: Nodes (blue dots) are branching points, and intersections (yellow dots) are where processes intersect Sholl shells. (C) Reconstructed mPFC neurons from WT winner and loser mice. (D to G) Sholl analysis of dendritic intersections (D), **P = 0.0019; number of branches (E), *P = 0.0314; branch length (F), ns, P = 0.1465; and node numbers (G), ns, P = 0.0717. n = 6 to 8 slices per four mice. (H) Reconstructed mPFC neurons from Asic2−/− winner and WT loser mice. (I to L) Sholl analysis: dendritic intersections (I) ****P < 0.0001; branches (J) **P = 0.0042; branch length (K) *P = 0.0409; and nodes (L) *P = 0.0412. n = 6 to 8 slices per four mice. (M) Spine structures in mPFC neurons from WT winner and loser mice. (N) Spine density comparison: mature, ****P < 0.0001; immature, **P = 0.001; total spines, ns, P = 0.7656. (O) Immature spine density (stubby, thin, and filopodia) in WT winner and loser mice. ****P < 0.0001; *P = 0.0253; ns, P = 0.9336. (P) Mature-to-immature spine density ratio in WT winner and loser mice, ****P < 0.0001. n = 27 to 37 neurons per four mice. (Q) Spine structures in mPFC neurons from Asic2−/− winner and WT loser mice. (R) Spine density comparison: mature, ****P < 0.0001; immature, ****P < 0.0001; total spines, **P = 0.0026. (S) Immature spine density in Asic2−/− winner and WT loser mice, ****P < 0.0001; ns, P = 0.0624, 0.6637. (T) Mature-to-immature spine density ratio in Asic2−/− winner and WT loser mice, ****P < 0.0001. n = 27 neurons per four mice. All comparisons by two-tailed unpaired Student’s t test.
Fig. 6.
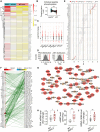
Fig. 6.. Identifying ASIC2-dependent kinase pathways involved in social dominance.
(A) Heatmap of substrate phosphorylation levels for STK in Asic2−/− brain samples versus WT controls. (B) Global phosphorylation level differences between Asic2−/− and WT brain samples. ***P = 0.0001 by paired two-tailed Student’s t test. n = 86 peptides. (C) Reverse KRSA plots mapping peptides to upstream kinases in Asic2−/− versus WT brains. (D) Quantification of PKA and AKT (Z > 2) using histogram peacock plots. (E) Waterfall plot of differentially identified kinases in Asic2−/− brain samples versus WT controls. Red dots indicate increased or decreased representation for each kinase. (F) piNET analysis identified downstream proteins activated by STK pathways, highlighting PKA (PRKACA) and AKT1 pathways. Selected kinases (red nodes) and downstream regulators (blue nodes) are connected by green edges. (G) Asic2−/− molecular interaction network. Functionally enriched protein-protein interaction network of upstream kinase “hits” (red) and interpolated hidden nodes (yellow) identified by Kinograte R software. n = 5 mice per group. (H) mRNA expression of PKA (PRKACA) via RT-qPCR in Asic2−/− versus WT mice mPFC. *P = 0.0217 by unpaired two-tailed Student’s t test. n = 14 mice per group. (I) Basal cAMP level measured by ELISA in Asic2−/− versus WT mice mPFC. **P = 0.0039 by unpaired two-tailed Student’s t test. n = 6 to 9 mice per group. (J) mRNA expression of BDNF via RT-qPCR in Asic2−/− versus WT mice mPFC. **P = 0.0062 by unpaired two-tailed Student’s t test. n = 12 mice per group.
Fig. 7.
Fig. 7.. Deletion of ASIC2 disrupts E/I Balance in mPFC neurons in the context of social dominance.
(A) Schematic showing the AAV2-hSyn-Cre injection into the mPFC of Asic2f/f mice. (B) Representative immunofluorescence image depicting the AAV2-hSyn-Cre injection site. (C) Representative immunofluorescence image demonstrating colocalization of ASIC2 (red) and AAV2-hSyn-Cre/AAV2-hSyn-GFP (green). Please note the presence of colocalization indicated by arrows in the AAV2-hSyn-GFP control group (upper), whereas such colocalization is absent in the AAV2-hSyn-Cre group (lower). (D) Western blot results show ASIC2 protein levels in the AAV2-hSyn-Cre and AAV2-hSyn-GFP groups. *P = 0.0472. n = 6 mice. (E) Schematic showing procedures of the tube test, AAV-hSyn-Cre injection into the mPFC of Asic2f/f mice, and the EPSC recordings. (F) Summarized results of ranking in the tube test before and after virus injections. (G) Average percentage of winning times in the tube test before and after AAV2-hsyn-Cre and AAV2-hSyn-GFP injections. ***P = 0.0007, n = 9 cages. (H) Representative mEPSC traces of Asic2f/f mPFC neurons in AAV2-hsyn-Cre and AAV2-hSyn-GFP groups. (I and J) Cumulative distributions of mEPSC amplitudes.*P = 0.0088. (K and L) Cumulative distributions of mEPSC interevent intervals, *P = 0.0172. n = 10 cells from four mice per group. (M) Representative mIPSC traces of Asic2f/f mPFC neurons in AAV2-hsyn-Cre and AAV2-hSyn-GFP groups. (N and O) Cumulative distributions of mIPSC amplitudes, ns, P = 0.8873. (P and Q) Cumulative distributions of mEPSC interevent intervals, *P = 0.0115. n = 9 cells from four mice per group. All comparisons by two-tailed unpaired Student’s t test.
Fig. 8.
Fig. 8.. Deletion of ASIC2 in mPFC excitatory neurons elevates social ranking in mice.
(A) Generation of ASIC2-cKO mice in excitatory neurons (ASIC2-Vglut1-cKO) by crossbreeding Asic2f/f mice with Vglut1-ires2-Cre mice. (B) Immunofluorescence images showing the absence of ASIC2 expression (green) in mPFC excitatory neurons labeled with N-methyl d-aspartate receptor subtype 2B (NR2B) (red). Inset highlights the lack of ASIC2 and NR2B colocalization. (C) One ASIC2-Vglut1-cKO and three WT mice cohoused for 2 weeks, followed by the tube test tournament to establish social rankings. Data from six cages per group summarized. (D) Comparison of time to stable rankings between ASIC2-Vglut1-cKO and WT subordinate mice. ***P = 0.0002, n = 6 cages. (E) Schematic of AAV2-CaMKIIα-Cre injection into Asic2f/f mouse mPFC neurons. (F) Representative image of AAV2-CaMKIIα-Cre injection site. (G) Immunofluorescence image demonstrating ASIC2 (green) and AAV2-CaMKIIα-Cre/mCherry (red) colocalization. Arrows indicate colocalization in AAV2-CaMKIIα-mCherry, but not AAV2-CaMKIIα-Cre group. (H) Whole-cell patch-clamp recording of acid-induced ASIC-like currents in AAV2-CaMKIIα-Cre (mCherry positive) mPFC neurons. (I) Representative traces of acid-induced currents in AAV2-CaMKIIα-Cre (red) and AAV2-CaMKIIα-mCherry (black) neurons. (J) Comparison of desensitization decay times of acid-induced currents in neurons from (I). Effective ASIC2 deletion in AAV2-CaMKIIα-Cre neurons shows prolonged desensitization times. **P = 0.0082. n = 15 to 17 cells from four mice per group. (K) Schematic of tube test procedures following AAV2-CaMKIIα-Cre injection into Asic2f/f mouse mPFC. (L) Summary of tube test rankings before and after AAV2-CaMKIIα-Cre and AAV2-CaMKIIα-mCherry injections. (M) Average percentage of winning times in the tube test before and after AAV2-CaMKIIα-Cre and AAV2-CaMKIIα-mCherry injections. ***P = 0.0007, n = 6 cages. All comparisons by two-tailed unpaired Student’s t test.

Similar articles

References

    1. Baum A., Garofalo J. P., Yali A. M., Socioeconomic status and chronic stress: Does stress account for SES effects on health? Ann. N. Y. Acad. Sci. 896, 131–144 (1999). - PubMed
    1. Davari M., Maracy M. R., Khorasani E., Socioeconomic status, cardiac risk factors, and cardiovascular disease: A novel approach to determination of this association. ARYA Atheroscler 15, 260–266 (2019). - PMC - PubMed
    1. Kawachi I., Subramanian S. V., Almeida-Filho N., A glossary for health inequalities. J. Epidemiol. Community Health 56, 647–652 (2002). - PMC - PubMed
    1. Ennals R., Michael Marmot (2004) Status Syndrome: How your social standing directly affects your health and life expectancy. AI Soc. 21, 231–233 (2006).
    1. Bronson F. H., The reproductive ecology of the house mouse. Q. Rev. Biol. 54, 265–299 (1979). - PubMed

Publication types

Substances

LinkOut - more resources