. 2024 Oct 25;10(43):eadp8783.
doi: 10.1126/sciadv.adp8783. Epub 2024 Oct 25.

p53 terminates the regenerative fetal-like state after colitis-associated injury

Affiliations

p53 terminates the regenerative fetal-like state after colitis-associated injury

Kimberly Hartl et al. Sci Adv. .

Abstract

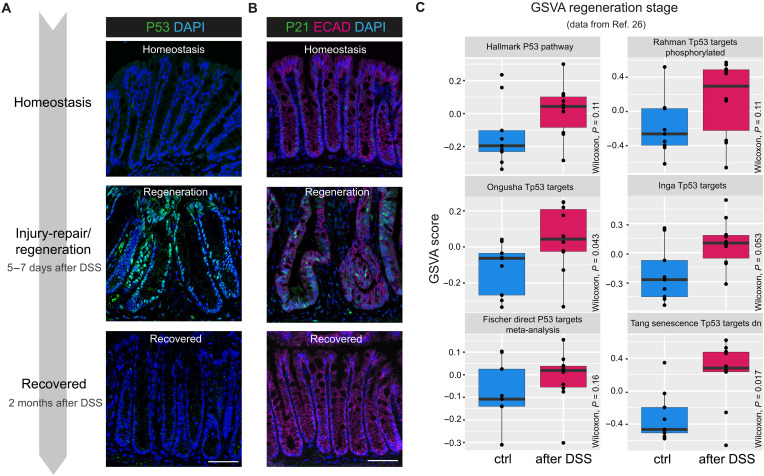
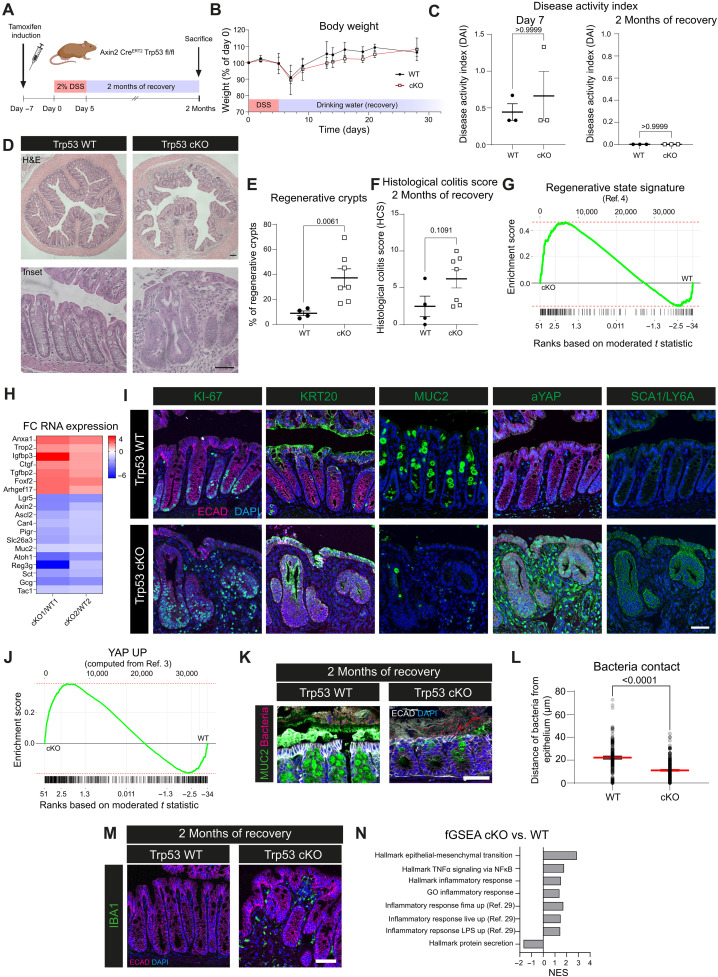
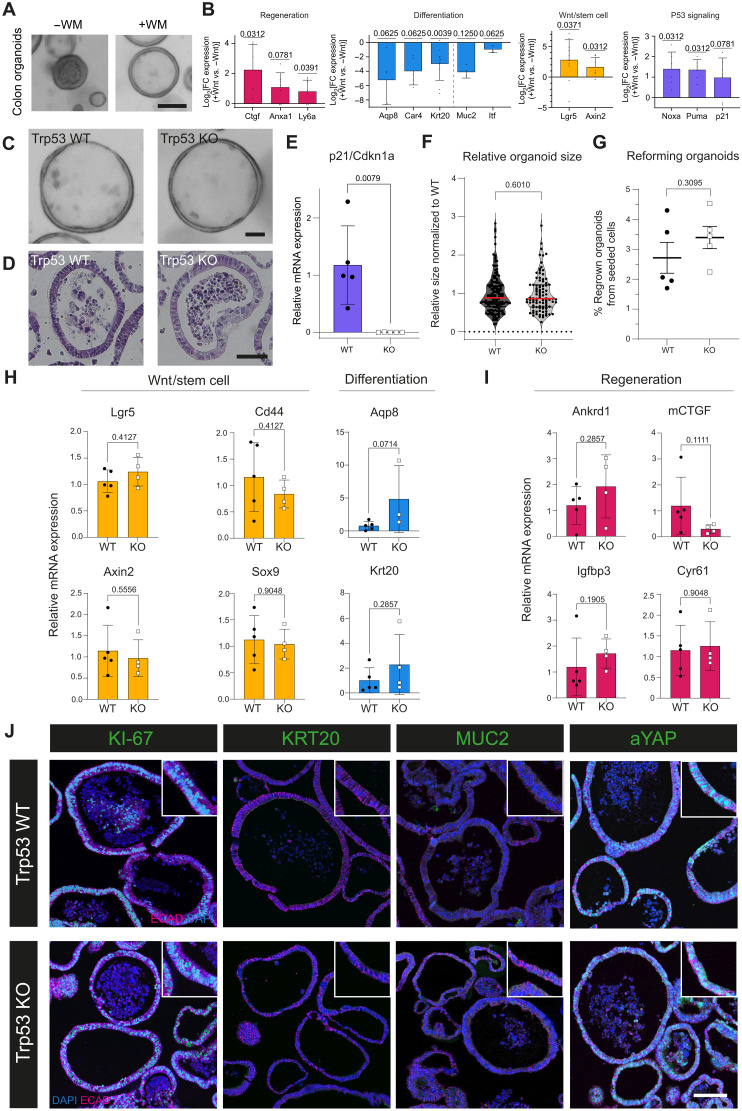
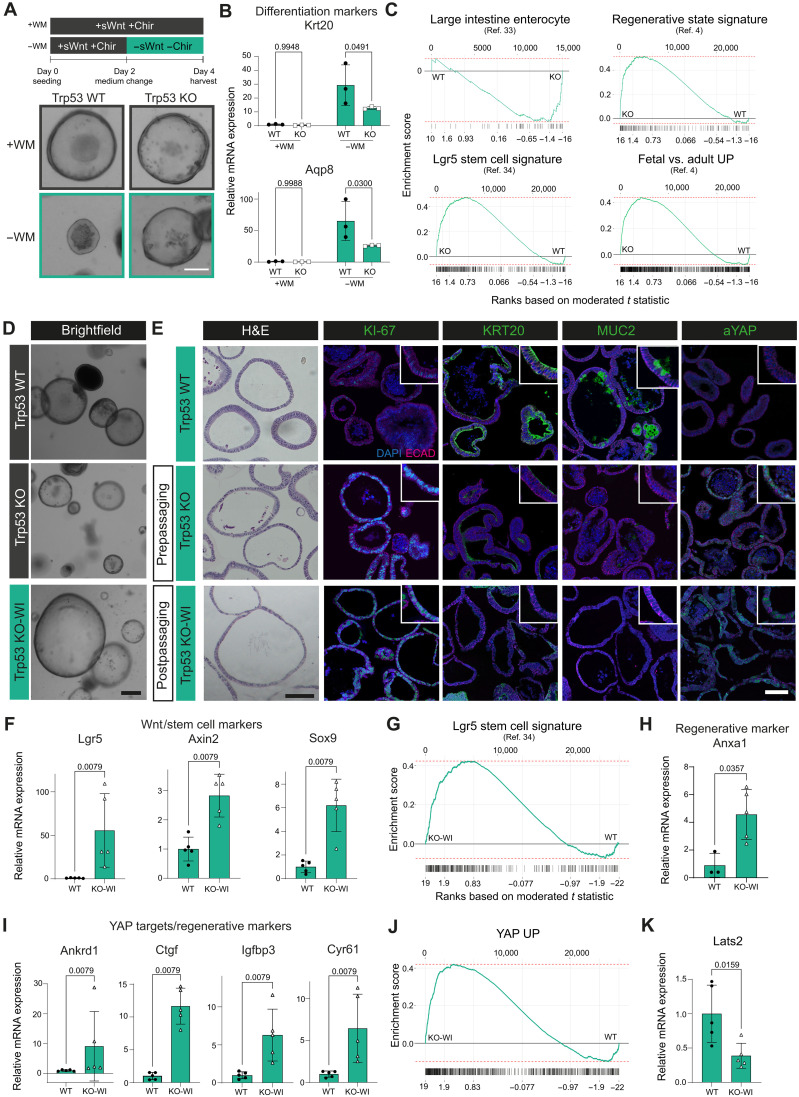
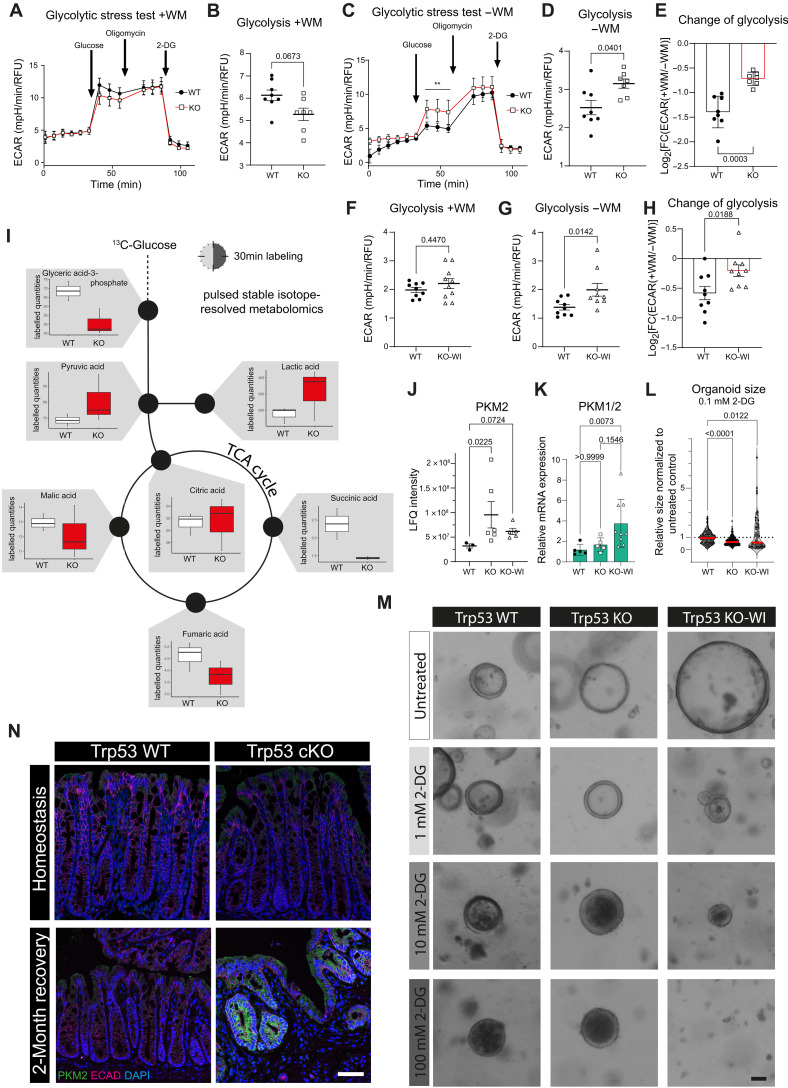
Cells that lack p53 signaling frequently occur in ulcerative colitis (UC) and are considered early drivers in UC-associated colorectal cancer (CRC). Epithelial injury during colitis is associated with transient stem cell reprogramming from the adult, homeostatic to a "fetal-like" regenerative state. Here, we use murine and organoid-based models to study the role of Trp53 during epithelial reprogramming. We find that p53 signaling is silent and dispensable during homeostasis but strongly up-regulated in the epithelium upon DSS-induced colitis. While in WT cells this causes termination of the regenerative state, crypts that lack Trp53 remain locked in the highly proliferative, regenerative state long-term. The regenerative state in WT cells requires high Wnt signaling to maintain elevated levels of glycolysis. Instead, Trp53 deficiency enables Wnt-independent glycolysis due to overexpression of rate-limiting enzyme PKM2. Our study reveals the context-dependent relevance of p53 signaling specifically in the injury-induced regenerative state, explaining the high abundance of clones lacking p53 signaling in UC and UC-associated CRC.


Figures

Fig. 1.
Fig. 1.. Trp53 signaling is activated after epithelial injury.
(A) Schematic for DSS-induced colitis and IF staining for P53 (green) and DAPI (blue). (B) IF staining for P21 (green), E-cadherin (ECAD; magenta), and 4′,6-diamidino-2-phenylindole (DAPI; blue). (C) Box and whisker plot for GSVA score for p53-related pathways (26) in control (blue) versus DSS-treated colon in regeneration phase (5 days DSS with 7 days of recovery) (magenta). Scale bars, 50 μm. n = 5 mice for homeostasis, n = 6 mice for regeneration, and n = 3 mice for 2-month recovery.
Fig. 2.
Fig. 2.. Loss of Trp53 prevents return to tissue homeostasis after colitis-associated injury and locks the epithelium in a regenerative state.
(A) Schematic: DSS treatment and recovery. (B) Body weight curve. (C) Disease activity index (DAI) for day 7 and 2 months of recovery. (D) Hematoxylin and eosin (H&E) staining for WT and cKO with 2 months of recovery. (E) Quantification of regenerative crypts after 2 months of recovery. (F) Histological colitis score at 2 months recovery. (G) Enrichment plot for the regenerative signature (4) cKO versus WT [false discovery rate (FDR) = 0.015, P = 0.00038, enrichment score (ES) = 0.47, normalized enrichment score (NES) = 2]. (H) Fold change (FC) of RNA expression for regenerative and epithelial lineage markers in cKO versus WT. Results from one WT versus one cKO mouse each. (I) IF of WT and cKO for KI-67, KRT20, MUC2, aYAP, or SCA1/LY6a (green), E-cadherin (magenta), and DAPI (blue). (J) Enrichment plot for a YAP signature based on data from (3) for cKO versus WT (FDR = 0.015, P = 0.00036, ES = 0.38, NES = 1.8). (K) RNA-ISH and IF for bacteria (magenta), MUC2 (green), E-cadherin (white), and DAPI (blue) in WT and cKO mice with 2 months of recovery. (L) Quantification of (K). Median and SEM. (M) IF for IBA1 (green) in WT and cKO mice with 2 months of recovery (E-cadherin, magenta; DAPI, blue). (N) NES for GSEA of Molecular Signatures Database (MSigDB) gene sets of mice with 2 months of recovery. Scale bars, 100 μm [overview in (C)] and 50 μm (others). (B and C) n = 3 mice for WT and cKO. (E, F, and L) n = 2 mice for WT; n = 3 for cKO; data points represent quantification from different colon cross sections. n = 2 mice for WT; n = 3 for cKO for all stainings. n = 2 mice for RNA expression data. TNFα, tumor necrosis factor–α; NF-κB, nuclear factor κB; GO, Gene Ontology; LPS, lipopolysaccharide.
Fig. 3.
Fig. 3.. Trp53 KO organoids do not differ from WT organoids in culture conditions mimicking regeneration.
(A) Brightfield (BF) images of colon organoids kept in medium without (−WM) or with (+WM) supplementation of sWnt after organoid formation. Scale bar, 100 μm. Representative images from n > 10. (B) LogFC of mRNA expression of regeneration, differentiation, and Wnt/stem cell markers and p53 signaling for +WM versus −WM organoids. n = 4 to 10 biological replicates. (C) BF images of Trp53 WT and KO organoids in +WM medium. Scale bar, 50 μm. Representative images from n > 10 biological replicates. (D) H&E images of Trp53 WT and KO organoids. Scale bar, 50 μm. Representative images from n = 3 biological replicates. (E) mRNA expression of p21 in WT and KO organoids in +WM medium. n = 5 biological replicates. (F) Quantification of organoid size in +WM condition normalized to WT. Median (red line) and quartiles (black lines). n = 4 biological replicates. (G) Percentage of organoids regrowing from seeded cells for WT and KO organoids in +WM condition. n = 5 biological replicates. (H) mRNA expression of Wnt signaling/stem cell markers and differentiation markers of Trp53 WT and KO organoids in +WM medium. n = 3 to 5 biological replicates. (I) mRNA expression of regeneration markers of Trp53 WT and KO organoids grown in +WM medium. n = 4 to 5 biological replicates. (J) IF images for WT and KO organoids in +WM condition for KI-67, KRT20, MUC2, and aYAP (all green) and counterstaining for E-cadherin (magenta) and DAPI (blue). Representative images from n = 3 biological replicates. Scale bar, 100 μm.
Fig. 4.
Fig. 4.. Trp53 KO organoids remain in the regenerative state after reinduction of homeostatic conditions.
(A) Treatment schematic and BF images of Trp53 WT and KO organoids. Scale bar, 50 μm. n > 6 biological replicates. (B) mRNA expression of differentiation markers for WT and KO in +WM and −WM conditions, n = 3 biological replicates. (C) Enrichment plots for KO versus WT in −WM conditions of large intestine enterocytes (36), Lgr5 stem cell (37), regenerative state, and fetal-like signature (4) (enterocytes FDR = 0.031, P = 0.0017, ES = −0.49, NES = −1.9; Lgr5 stem cell FDR = 0.012, P = 0.00026, ES = 0.48, NES = 2; regenerative FDR = 0.012, P = 0.00028, ES = 0.51, NES = 2; fetal versus adult FDR = 0.012, P = 0.00022, ES = 0.42, NES = 2), n = 2 biological replicates per genotype. (D) BF images of WT, KO organoids (in −WM condition), and KO in −WM medium (KO-WI). Scale bar, 250 μm. n > 6 biological replicates. (E) H&E and IF images for WT, KO, and KO-WI in −WM condition. KI-67, KRT20, MUC2, aYAP (all green), E-cadherin (magenta), and DAPI (blue). Scale bars, 100 μm. n = 3 biological replicates. (F) mRNA expression of Wnt/stem cell markers for WT and KO-WI in −WM condition. n = 5 biological replicates. (G) Enrichment plots for KO-WI versus WT in −WM conditions for Lgr5 signature (FDR = 0.019, P = 0.00048, ES = 0.42, NES = 1.9), n = 2 biological replicates per genotype. (H and I) mRNA expression of regenerative markers in WT and KO-WI in −WM condition. n = 3 to 5 biological replicates. (J) Enrichment plots for KO-WI versus WT in −WM conditions for YAP UP signature (FDR = 0.019, P = 5 × 10−04, ES = 0.42, NES = 2), n = 2 biological replicates per genotype. (K) Lats2 mRNA expression in WT and KO-WI in −WM conditions. n = 5 biological replicates.
Fig. 5.
Fig. 5.. Locked regenerative Trp53 KO epithelium remains in a high glycolytic metabolic state.
(A) Extracellular acidification rate (ECAR) plot for Seahorse glycolytic stress test assay: WT and Trp53 KO organoids in +WM medium. (B) Rate for glycolysis in WT and KO from (A). (C) ECAR plot for WT and KO organoids in −WM medium. (D) Rate for glycolysis in WT and KO from (C). (E) LogFC for glycolysis in WT and KO in +WM versus −WM medium. (F and G) Rate for glycolysis in WT and Trp53 KO-WI organoids in +WM medium and in −WM medium. (H) LogFC for glycolysis in WT and KO-WI organoids in +WM versus −WM medium. (I) Labeled quantities plot for WT and KO organoids from pulsed stable isotope resolved metabolomics (pSIRM) (n = 3 technical replicates). (J) Protein expression of PKM2 in WT, KO, and KO-WI organoids (n = 3 biological replicates). (K) mRNA expression of PKM1/2 in WT, KO, and KO-WI organoids (n = 5 biological replicates, plotted are one to two experimental replicates per biological replicate). (L) Organoids’ size treated with 0.1 mM 2-deoxyglucose (2-DG) for 2 days. Red line: mean. n = 6 biological replicates for WT, n = 4 biological replicates for KO, n = 2 biological replicates for KO-WI. (M) BF images of WT, KO, and KO-WI organoids treated with different concentrations of 2-DG for 2 days (n = 2 to 6 biological replicates). Scale bar, 50 μm. (N) IF staining for PKM2 in homeostasis (n = 2 mice) or 2 months after DSS in WT and KO mice (WT, n = 2 mice; KO, n = 3 mice). (A, D, and E) Mean ± SEM; individual data points represent technical replicates of n = 3 biological replicates. (F, G, and H) Mean ± SEM; individual data points represent technical replicates of n = 5 (WT) or n = 4 (KO-WI) biological replicates. RFU, relative fluorescence units. TCA, tricarboxylic acid.

References

    1. Barker N., van Es J. H., Kuipers J., Kujala P., van den Born M., Cozijnsen M., Haegebarth A., Korving J., Begthel H., Peters P. J., Clevers H., Identification of stem cells in small intestine and colon by marker gene Lgr5. Nature 449, 1003–1007 (2007). - PubMed
    1. Ayyaz A., Kumar S., Sangiorgi B., Ghoshal B., Gosio J., Ouladan S., Fink M., Barutcu S., Trcka D., Shen J., Chan K., Wrana J. L., Gregorieff A., Single-cell transcriptomes of the regenerating intestine reveal a revival stem cell. Nature 569, 121–125 (2019). - PubMed
    1. Gregorieff A., Liu Y., Inanlou M. R., Khomchuk Y., Wrana J. L., Yap-dependent reprogramming of Lgr5+ stem cells drives intestinal regeneration and cancer. Nature 526, 715–718 (2015). - PubMed
    1. Yui S., Azzolin L., Maimets M., Pedersen M. T., Fordham R. P., Hansen S. L., Larsen H. L., Guiu J., Alves M. R. P., Rundsten C. F., Johansen J. V., Li Y., Madsen C. D., Nakamura T., Watanabe M., Nielsen O. H., Schweiger P. J., Piccolo S., Jensen K. B., YAP/TAZ-dependent reprogramming of Colonic Epithelium Links ECM Remodeling to Tissue Regeneration. Cell Stem Cell 22, 35–49.e7 (2018). - PMC - PubMed
    1. Sarvestani S. K., Signs S. A., Lefebvre V., Mack S., Ni Y., Morton A., Chan E. R., Li X., Fox P., Ting A., Kalady M. F., Cruise M., Ashburn J., Stiene J., Lai W., Liska D., Xiang S., Huang E. H., Cancer-predicting transcriptomic and epigenetic signatures revealed for ulcerative colitis in patient-derived epithelial organoids. Oncotarget 9, 28717–28730 (2018). - PMC - PubMed

MeSH terms

Substances