. 2024 Oct 25;10(43):eadp5059.
doi: 10.1126/sciadv.adp5059. Epub 2024 Oct 25.

Accelerated Alzheimer's Aβ-42 secondary nucleation chronologically visualized on fibril surfaces

Affiliations

Accelerated Alzheimer's Aβ-42 secondary nucleation chronologically visualized on fibril surfaces

Peter Niraj Nirmalraj et al. Sci Adv. .

Abstract

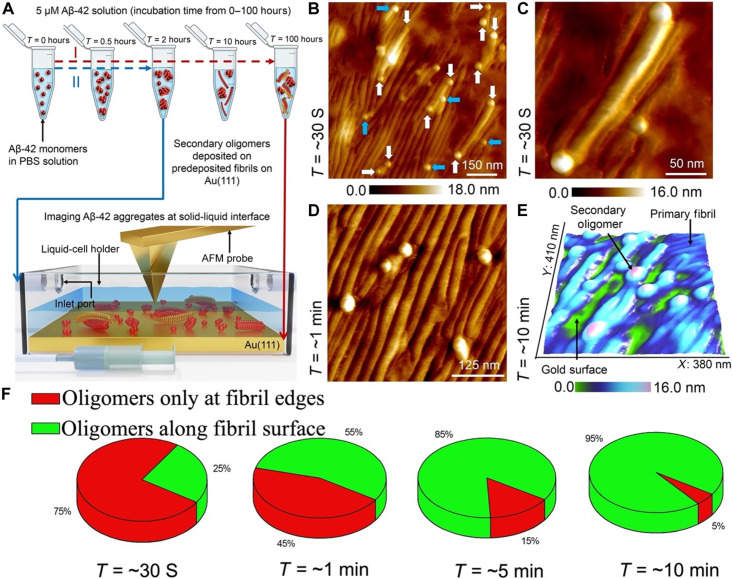
Protein fibril surfaces tend to generate toxic oligomers catalytically. To date, efforts to study the accelerated aggregation steps involved with Alzheimer's disease-linked amyloid-β (Aβ)-42 proteins on fibril surfaces have mainly relied on fluorophore-based analytics. Here, we visualize rare secondary nucleation events on the surface of Aβ-42 fibrils from embryonic to endpoint stages using liquid-based atomic force microscopy. Nanoscale imaging supported by atomic-scale molecular simulations tracked the adsorption and proliferation of oligomeric assemblies at nonperiodically spaced catalytic sites on the fibril surface. Upon confirming that fibril edges are preferential binding sites for oligomers during embryonic stages, the secondary fibrillar size changes were quantified during the growth stages. Notably, a small population of fibrils that displayed higher surface catalytic activity was identified as superspreaders. Profiling secondary fibrils during endpoint stages revealed a nearly threefold increase in their surface corrugation, a parameter we exploit to classify fibril subpopulations.


Figures

Fig. 1.
Fig. 1.. Schematic showing differences between primary and secondary amyloid nucleation pathways.
The protein aggregates formed through the secondary nucleation are autocatalytically generated on the primary fibril surface. Objects are shown not to scale.
Fig. 2.
Fig. 2.. Characterization of primary Aβ-42 fibril morphology.
(A) Large-area AFM image showing submonolayer coverage of Aβ-42 fibrils. The red arrow indicates that the mature fibrils are also present together with oligomers of varying sizes. (B) Cross-sectional height profiles (blue and green traces) extracted along individual Aβ-42 oligomeric particles (indicated by corresponding blue and green lines) are shown in the AFM image (B, inset). (C) A representative spatially well-resolved AFM topograph of a single Aβ-42 oligomer. (D) Height profiles extracted along multiple points of the Aβ-42 oligomer shown in the AFM image (C) confirm the local height differences within a single oligomeric particle. (E) The height profile of single fibrils measured along the gray line indicated in the AFM image shown in (A). On the basis of the quantitative analysis of the AFM images of Aβ-42 fibrils incubated for ~150 hours, we extract a mean fibril height of (8.3 ± 0.85) nm (F, red histogram) (n = 340) and mean fibril length of (842 ± 133.5) nm (G, gray histogram) (n = 251).
Fig. 3.
Fig. 3.. Capturing early stages of oligomer adsorption on Aβ-42 fibrils.
(A) Diagram of Aβ-42 monomer solution incubation and aggregation process through primary nucleation pathway (highlighted in red dashed arrow) and secondary nucleation pathway (highlighted in blue dashed arrow) studied using liquid-cell setup (shown in the bottom section). Objects in both schematics are not shown to scale. (B) AFM topographic image of secondary oligomers adsorbed on the edges (indicated by white arrows) and along the surface (indicated by blue arrows) of Aβ-42 fibrils predeposited on gold substrate. (C) High-resolution AFM image of secondary oligomers adsorbed at the edges of a primary fibril. (D) AFM image showing several secondary oligomers adsorbed along the surface of primary Aβ-42 fibril surface. (E) Three-dimensionally represented AFM image of secondary oligomers adsorbed along the secondary fibril surface. The size of an oligomer is calculated on the basis of the total height measured on top of the oligomer adsorbed on the primary fibril and by subtracting the fibril height with respect to the underlying bare gold surface. AFM images shown in (B), (D), and (E) were recorded after ~30 s, ~1 min, and ~10 min of depositing the secondary oligomer solution onto the predeposited Aβ-42 fibrils. (F) Pie chart normalized distribution (over an area of 500 nm2) based on AFM images of secondary oligomers adsorbed only at the edges and along the surface of Aβ-42 fibrils recorded at periods of ~30, 60, 300, and 600 s, respectively.
Fig. 4.
Fig. 4.. MD simulations of Aβ-42 oligomers adsorbed along the backbone and at the edge of the Aβ-42 fibril.
(A) Initial orientations showing side-on views of the oligomer (colored red) adsorbed in various starting configurations on the fibril template (colored blue). The oligomer is initially placed either along the primary fibril surface (orientations 1 and 2) or at the fibril edge (orientations 3, 4, and 5) (B) Final structures formed following 100 ns of MD. See fig. S1 for plan views of the complexes from above. (C) Comparison of oligomer-fibril total interaction energies as estimates of the binding strength of each complex. (D) Distribution of secondary oligomer height profiles above the gold platform, comparing different morphologies assembled in the four calculated successful oligomer-fibril adsorption profiles (orientation 3 is omitted as the oligomer dissociated from the fibril surface). AU, arbitrary units.
Fig. 5.
Fig. 5.. Quantifying secondary fibril and oligomer size.
(A) Three-dimensionally represented AFM image recorded at a period of ~10 min after deposition of the primary oligomers on preformed Aβ-42 fibrils. (B) The cross-sectional profile extracted along the primary and secondary fibrils in AFM image shown in (A). (C) Time-elapsed AFM image recorded ~20 min after initiating the secondary nucleation process showing secondary oligomers to be adsorbed mostly along the primary and secondary (indicated by blue arrows) Aβ-42 fibrils. (D) On the basis of the height traces measured on secondary Aβ-42 oligomers adsorbed on fibrils (top blue bar histogram, n: 1066) and directly on the gold surface (bottom red bar histogram, n: 1168), we extract mean oligomer diameters of (7.9 ± 0.2) nm and (7.3 ± 1.9) nm, respectively. The Aβ-42 oligomers in both experiments were formed after the Aβ-42 monomer solution was incubated for ~2 hours.
Fig. 6.
Fig. 6.. Identifying differences in catalytic activity of fibrils.
(A to D) Large-area AFM images were recorded at ~30, 60, 120, and 180 min after deposition of the oligomers on Aβ-42 primary fibrils. (E) High-resolution AFM image (recorded at the time point of ~60 min) showing fibrils exhibiting high catalytic activity (indicated in white dashed and green dashed regions). The red dashed region in (E) highlights primary fibrils with no adsorbed oligomers. (F) Large-area AFM image recorded at a time point of ~240 min showing regions with high fibril catalytic activity (indicated by blue dashed region). The morphology of the secondary oligomers and fibrils did not vary beyond this time point indicative of the endpoint of the secondary nucleation pathway. (G) High-resolution AFM image recorded at the time point of ~240 min showing local differences in catalytic activity. (H) Pie chart showing the normalized distribution (over an area of 500 nm2) of active primary fibrils (coded in yellow), dormant primary fibrils (coded in dark green), and superspreader primary fibrils (coded in blue), based on AFM images recorded during embryonic, growth, and endpoint phases of Aβ-42 secondary nucleation pathway.
Fig. 7.
Fig. 7.. Profiling corrugations along primary and secondary fibrils.
(A to C) The plot of surface corrugation measured along the backbone of secondary and primary fibrils resolved in the inset AFM images recorded at multiple time points of ~10, 60, and 240 min, respectively. (D) Plot showing the distribution of average fibril surface roughness measured along the length of the fibrils resolved from the AFM height maps. The lower surface roughness values ranging from ~0.4 to 2.2 nm correspond to the roughness measured along the primary fibrils, and the higher values correspond to the secondary fibrils. (E) Plot showing the diameter of secondary Aβ-42 oligomers measured on Aβ-42 primary fibrils based on AFM data collected at multiple time points from ~0.5 to 250 min. Particle diameter is calculated from AFM height profile analysis of individual oligomers detected both on the edges and along the surface of Aβ-42 fibrils. (F) Plot monitoring the evolution of secondary fibril length over time (~10 to 250 min) obtained from AFM height maps. The individual data points shown in (E) and (F) in the black plot (trial 1) and red plot (trial 3) are based on AFM measurements conducted in buffer salt solutions. The green plots in (E) and (F) are based on AFM measurements (trial 2) conducted in a water medium. Data shown in (E) and (F) are expressed as mean ± SD.

Similar articles

Cited by

References

    1. Maccioni R. B., Muñoz J. P., Barbeito L., The molecular bases of Alzheimer’s disease and other neurodegenerative disorders. Arch. Med. Res. 32, 367–381 (2001). - PubMed
    1. Blennow K., Zetterberg H., Fagan A. M., Fluid biomarkers in Alzheimer disease. Cold Spring Harb. Perspect. Med. 2, a006221 (2012). - PMC - PubMed
    1. Shankar G. M., Bloodgood B. L., Townsend M., Walsh D. M., Selkoe D. J., Sabatini B. L., Natural oligomers of the Alzheimer amyloid-β protein induce reversible synapse loss by modulating an NMDA-type glutamate receptor-dependent signaling pathway. J. Neurosci. 27, 2866–2875 (2007). - PMC - PubMed
    1. Vergallo A., Mégret L., Lista S., Cavedo E., Zetterberg H., Blennow K., Vanmechelen E., de Vos A., Habert M.-O., Potier M.-C., Dubois B., Neri C., Hampel H.; INSIGHT-preAD study group; Alzheimer Precision Medicine Initiative (APMI) , Plasma amyloid β 40/42 ratio predicts cerebral amyloidosis in cognitively normal individuals at risk for Alzheimer’s disease. Alzheimers Dement. 15, 764–775 (2019). - PubMed
    1. Schindler S. E., Bollinger J. G., Ovod V., Mawuenyega K. G., Li Y., Gordon B. A., Holtzman D. M., Morris J. C., Benzinger T. L. S., Xiong C., Fagan A. M., Bateman R. J., High-precision plasma β-amyloid 42/40 predicts current and future brain amyloidosis. Neurology 93, e1647–e1659 (2019). - PMC - PubMed

LinkOut - more resources