. 2024 Oct 25;10(43):eadp2229.
doi: 10.1126/sciadv.adp2229. Epub 2024 Oct 25.

Temporal regulation of gene expression through integration of p53 dynamics and modifications

Affiliations

Temporal regulation of gene expression through integration of p53 dynamics and modifications

Dan Lu et al. Sci Adv. .

Abstract

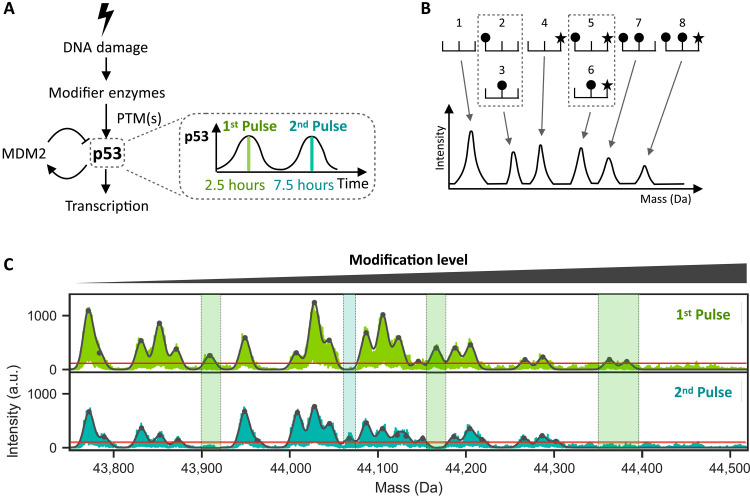
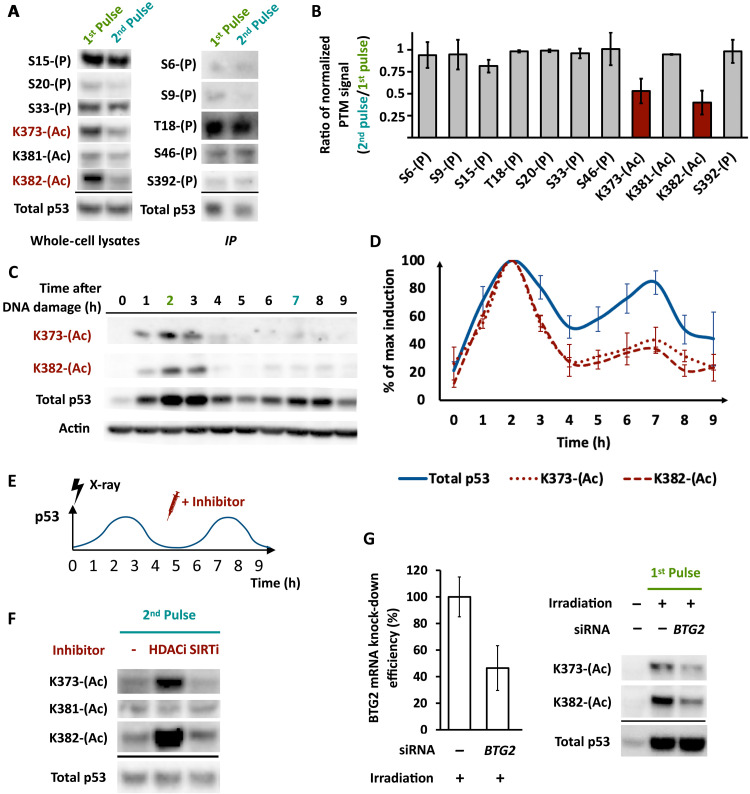
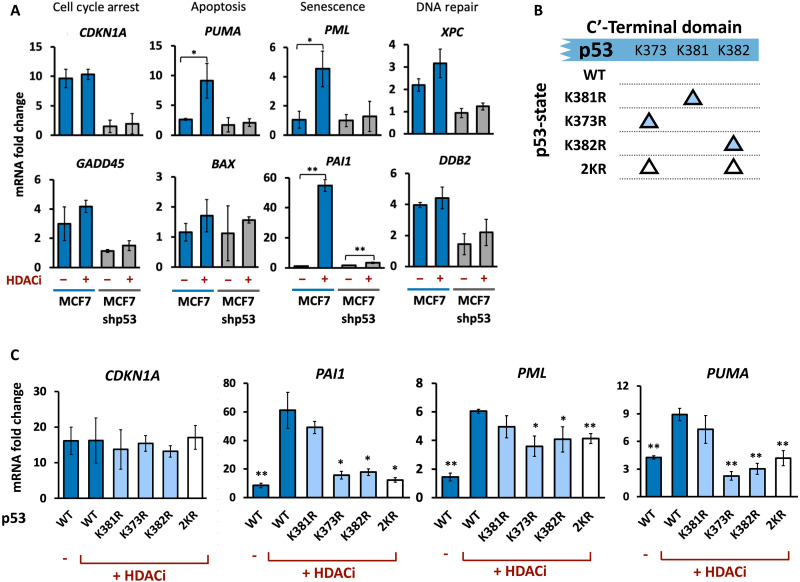
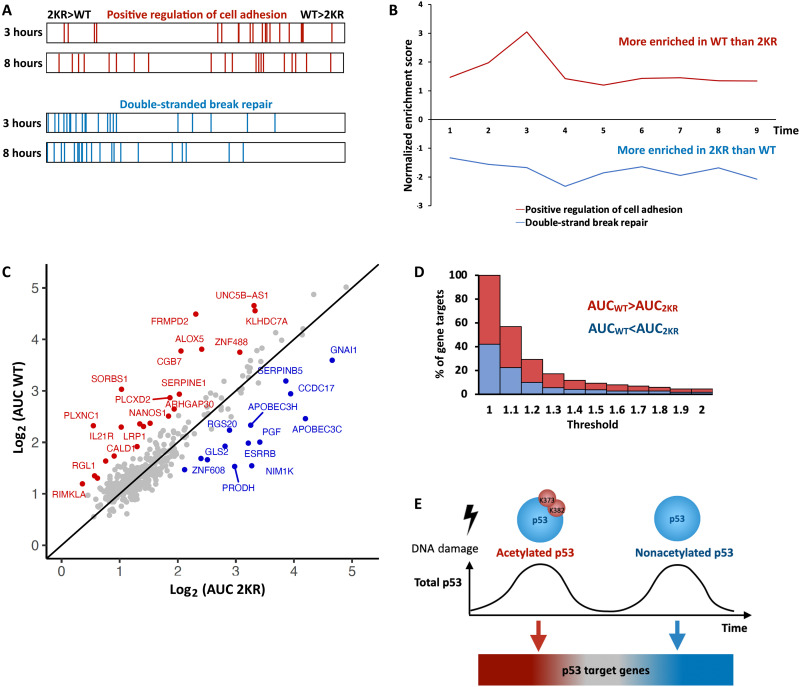
The master regulator of the DNA damage response, the transcription factor p53, orchestrates multiple downstream responses and coordinates repair processes. In response to double-strand DNA breaks, p53 exhibits pulses of expression, but how it achieves temporal coordination of downstream responses remains unclear. Here, we show that p53's posttranslational modification state is altered between its first and second pulses of expression. We show that acetylations at two sites, K373 and K382, were reduced in the second pulse, and these acetylations differentially affected p53 target genes, resulting in changes in gene expression programs over time. This interplay between dynamics and modification may offer a strategy for cellular hubs like p53 to temporally organize multiple processes in individual cells.


Figures

Fig. 1.
Fig. 1.. The overall state of p53 PTMs changes between its first and second pulses following DNA damage.
(A) DNA damage activates enzymes, which activate p53 through PTMs. Activated p53 subsequently transcribes target genes including MDM2, an E3 ubiquitin ligase that leads to p53 degradation. The resulting negative feedback loop leads to oscillatory p53 dynamics with its first peak at 2.5 hours and second peak at 7.5 hours after initial DNA damage. (B) Schematic depicting a protein with 3 sites of modifications (top), the first two sites being subject to one type of modification (circle) and the third site to a different type of modification (star). The eight possible modified forms are shown. An I2MS spectrum (bottom) can distinguish forms that are unique in mass (1, 4, 7, 8) while those sharing the same mass cannot be distinguished (2 and 3, 5 and 6). (C) I2MS mass spectra of p53 proteins isolated at the peaks of the first (top) or second (bottom) pulses as shown in arbitrary units (a.u.). The furthest left peak shows the least modified form of p53, and all peaks to the right represent combinations of p53 PTMs. Black contour line represents fitted Gaussian distributions to each peak in the spectrum, while horizontal red line distinguishes the limit of detection (detailed in Materials and Methods). Shaded green and turquoise areas indicate modification states that differ between the first and second p53 peaks.
Fig. 2.
Fig. 2.. Specific lysine acetylations vary between p53’s pulses due to regulation of HDAC enzymes.
(A) Phosphorylations or acetylations at the indicated residues of p53 were monitored by Western blots of total cell lysates (left) or of p53 immunoprecipitates (IP) (right) in the first and second pulses. Loading was normalized for total p53. Modifications indicated in red showed differences in levels between the two pulses. (B) Quantification of the Western blot from A, normalized to total p53 levels (n = 3 biological replicates, error bars indicate SD). (C) Western blot of acetylation at lysine-373 (K373-Ac) or lysine-382 (K382-Ac) of p53 at the indicated time points after 10-Gy x-ray irradiation. Actin is shown as a loading control. (D) Quantification of time-course Western blot signal from (B), normalized to the maximum level attained for each species over the time course (n = 3 biological replicates, error bars indicate SD). (E) Schematic of experiment showing addition of inhibitor(s) at the trough between p53 peaks (4.5 hours post irradiation). (F) Western blot of p53 acetylated at K373, K381, or K382 in the presence or absence of HDACi or SIRTi added at the time point shown in A. Total p53 is shown as a loading control. (G) Left: BTG2 mRNA levels following 48-hour knockdown with control or BTG2 short interfering (si)RNA. Right: Western blot of p53 acetylated at K373 or K382 following siRNA silencing of BTG2 (see Materials and Methods) and after the indicated number of hours after irradiation.
Fig. 3.
Fig. 3.. Enhancing p53 acetylation differentially affects target gene expression.
(A) qPCR analysis of the mRNA levels of the indicated genes at 8 hours after irradiation treated with or without HDACi, normalized to mRNA levels in unirradiated cells. Error bars represent SD from three biological replicates. *P < 0.05, **P < 0.01 by t test. (B) Schematic of p53 constructs harboring single or double K➔R mutations. (C) qPCR analysis of mRNA levels of CDKN1A, PAI1, PML, and PUMA after the second p53 pulse in cells expressing the indicated p53 variants and treated with or without HDACi. Error bars represent SD from three biological replicates. *P < 0.05, **P < 0.01 by t test (all conditions compared to WT + HDACi).
Fig. 4.
Fig. 4.. Pulse-dependent modifications of p53 temporally separate its various transcription programs.
(A) GSEA barcode of “positive regulation of cell adhesion” pathway genes (top) or “DSB DNA repair” pathway genes (bottom) in 2KR compared to WT cells at 3 or 8 hours post irradiation. (B) Normalized Enrichment Score (NES) for the pathways shown in (A) at the indicated time points as calculated by GSEA. Positive values represent enrichment in WT p53, while negative values represent enrichment in 2KR. (C) Scatter plot of the fold-change AUC from 1 to 3 hours for p53 target genes in WT versus 2KR cells. Genes enriched at least 1.5-fold in WT or 2KR are colored red or blue, respectively. (D) Stacked bar-graph showing the percentage of gene targets having a WT:2KR (for WT > 2KR) or 2KR:WT (for WT < 2KR) AUC ratio at or above the indicated threshold. Red bars represent genes enriched in WT cells, and blue bars represent genes enriched in 2KR cells. (E) Model depicting how changes in acetylation on distinct pulses of p53 lead to different transcriptional activation of target genes. Red genes are better induced under K373/K382 acetylated p53. Blue genes are better induced under nonacetylated p53. The shift is gradual with grey genes in the middle having no preference.

Similar articles

References

    1. Behar M., Hoffmann A., Understanding the temporal codes of intra-cellular signals. Curr. Opin. Genet. Dev. 20, 684–693 (2010). - PMC - PubMed
    1. Purvis J. E., Lahav G., Encoding and decoding cellular information through signaling dynamics. Cell 152, 945–956 (2013). - PMC - PubMed
    1. Beltrao P., Bork P., Krogan N. J., van Noort V., Evolution and functional cross-talk of protein post-translational modifications. Mol. Syst. Biol. 9, 714 (2013). - PMC - PubMed
    1. Prabakaran S., Lippens G., Steen H., Gunawardena J., Post-translational modification: Nature’s escape from genetic imprisonment and the basis for dynamic information encoding. Wiley Interdiscip. Rev. Syst. Biol. Med. 4, 565–583 (2012). - PMC - PubMed
    1. Bieging K. T., Attardi L. D., Deconstructing p53 transcriptional networks in tumor suppression. Trends Cell Biol. 22, 97–106 (2012). - PMC - PubMed

Substances