. 2024 Oct 25;10(43):eadq7483.
doi: 10.1126/sciadv.adq7483. Epub 2024 Oct 25.

Stepwise virus assembly in the cell nucleus revealed by spatiotemporal click chemistry of DNA replication

Affiliations

Stepwise virus assembly in the cell nucleus revealed by spatiotemporal click chemistry of DNA replication

Alfonso Gomez-Gonzalez et al. Sci Adv. .

Abstract

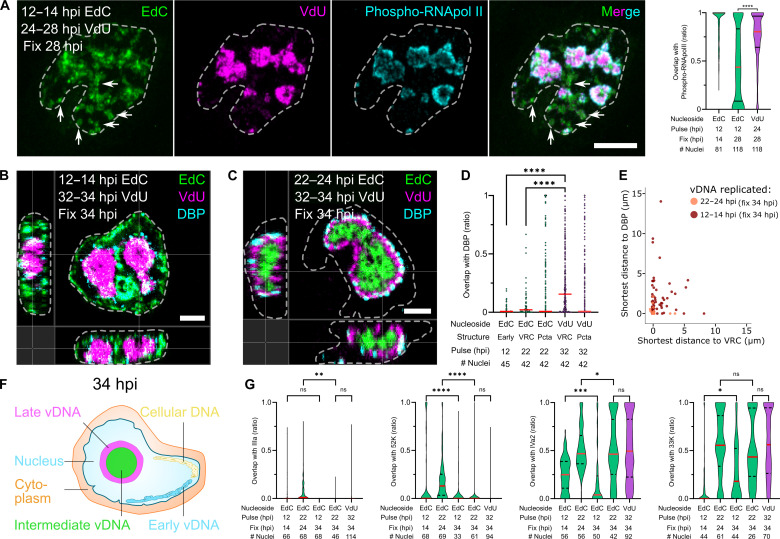
Biomolecular assemblies are fundamental to life and viral disease. The spatiotemporal coordination of viral replication and assembly is largely unknown. Here, we developed a dual-color click chemistry procedure for imaging adenovirus DNA (vDNA) replication in the cell nucleus. Late- but not early-replicated vDNA was packaged into virions. Early-replicated vDNA segregated from the viral replication compartment (VRC). Single object tracking, superresolution microscopy, fluorescence recovery after photobleaching, and correlative light-electron microscopy revealed a stepwise assembly program involving vDNA and capsid intermediates. Depending on replication and the scaffolding protein 52K, late-replicated vDNA with rapidly exchanging green fluorescent protein-tagged capsid linchpin protein V and incomplete virions emerged from the VRC periphery. These nanogel-like puncta exhibited restricted movements and were located with the capsid proteins hexon, VI, and virions in the nuclear periphery, suggestive of sites for virion formation. Our findings identify VRC dynamics and assembly intermediates, essential for stepwise productive adenovirus morphogenesis.


Figures

Fig. 1.
Fig. 1.. Incorporation of VdU into AdV-infected A549 cells and E1-expressing helper cell lines and virions isolated from these cells.
(A) Tagging of newly synthesized VdU-modified vDNA with acridine orange–coupled 6-methyl-tetrazine (AO-6MT). (B) VdU incorporation during AdV-C5 replication. A549 cells were inoculated with AdV [multiplicity of infection (MOI) of 3] at 37°C for 60 min, washed, and fixed at 28 hpi. VdU was added 4 hours before fixation. Samples were immuno-stained for DBP and clicked with AO-6MT. Scale bar, 10 μm. (C) VdU incorporation into A549 cells infected with AdV-C5 (MOI of 1.5). Nuclei were segmented on the basis of 4′,6-diamidino-2-phenylindole (DAPI) nuclear signal, and the AO signal was quantitated in the nuclear area. Data represent means ± SD. Statistical significance was determined by unpaired t test. **P < 0.002. AU, arbitrary units. (D and E) VdU incorporation into AdV-C5–infected (MOI of 1.5) human embryonic kidney (HEK) 293 and human embryonic retina (HER) 911 cells, fixed at 20 hpi. For noninfected cells, VdU was present throughout 20 hours, and for AdV-C5–infected cells, 4 hours before fixation. Dashed lines indicate nuclear outlines. Scale bars, 10 μm. Bar graphs show quantitative analyses of VdU incorporation into HEK293 and HER911 cells. Data represent means ± SD of the AO-6MT signal over the DAPI-stained nuclei. Statistical significance was determined by nonparametric analysis of variance (ANOVA) with Holm-Sidak for multiple comparisons. ***P < 0.0002; ****P < 0.0001. (F) Electron micrographs of AdV-C5 and AdV-C5-VdU particles. Scale bar, 100 nm. (G) AdV-C5 and AdV-C5-VdU particles stained with AO-6MT. Virions were incubated at 4° or 45°C, bound to coverslips, fixed, immuno-stained for hexon, and clicked with AO-6MT, and the percentage of AO-6MT–positive virus particles was displayed. Scale bar, 10 μm. (H) Tracking of incoming VdU-labeled virions. Arrows indicate VdU-AO-6MT–labeled vDNA-containing viral particles; arrowheads highlight released VdU-AO-6MT vDNA. Data represent normalized intensities of capsid and vDNA across the dotted lines. Scale bar, 10 μm. Scale bar in the zoom-in, 1 μm.
Fig. 2.
Fig. 2.. Dual-label click chemistry reveals distinct spatiotemporal features of vDNA in AdV infection.
(A) Encapsidation of EdC into AdV particles. Cesium chloride–purified progeny virions from infected EdC-pulsed A549 cells were heat-disrupted, bound to poly-l-lysine–coated coverslips, fixed, and stained with hexon 9C12 antibody and N3-AlexaFluor488. Data represent the relative amount of AlexaFluor488-positive virus particles to AdV-EdC control virus. (B) Schematic depiction of biorthogonal dual-label pulse-chase experiment of vDNA replication. A549 cells were infected with AdV-C5 (MOI of 3) for 60 min, washed, pulse labeled with 2.5 μM EdC for 4 hours at different times pi, washed, and either fixed or tagged with 50 μM VdU 24 to28 hpi. Samples were stained with anti-DBP antibodies (cyan), clicked with AO-6MT (magenta), and clicked with N3-AlexaFluor647 (green). (C) AdV replication compartment visualized by EdC pulse labeling. Samples were prepared as in (B). Images are maximum projections. Scale bar, 10 μm. (D) The VRC displays distinct patterns of early- and late-replicated vDNAs. Samples preparation as in (B). Images are maximum projections. Scale bar, 10 μm. (E) Quantitative analysis of the EdC content in the VRC. DBP objects from (C) were 3D segmented, and the EdC-AlexaFluor647 signal was quantitated in the DBP volume. Each data point represents a DBP object. The median is shown in red. (F) Quantitative analysis of vDNA dissociation from DBP late in infection. EdC-labeled vDNA objects from (D) were 3D segmented, and DBP-EdC overlap was computed and compared to the 3D-segmented DBP. Each data point represents an EdC-labeled vDNA object. The median is shown in red. (G) Shortest distance plots of early-replicated vDNA to late-replicated vDNA from single 3D-segmented EdC-labeled vDNA surfaces to both DBP and VdU-labeled vDNA from (D), color-coded by the EdC pulse time. EdC objects in DAPI-stained nuclei were segmented as in (F).
Fig. 3.
Fig. 3.. Early-replicated vDNA dissociates from VRC and becomes phospho-RNA Pol-II– and DBP-negative.
(A) p-RNA Pol-II staining of late-replicated vDNA. Specimens were labeled with EdC (green) and VdU (magenta), fixed, and stained with anti–p-RNA Pol-II-CTD (cyan). The median of violin plotted data is shown in red. Statistical significance was determined by nonparametric ANOVA with Holm-Sidak for multiple comparisons. ****P < 0.0001. Arrows indicate p-RNA Pol-II–negative EdC regions. Images are maximum projections. Scale bar, 10 μm. (B and C) Early-replicated vDNA segregates from VRC, while intermediate-replicated vDNA constitutes the VRC center. Specimens were labeled with EdC (green) and VdU (magenta) and stained with anti-DBP (cyan) showing en face projections and orthogonal slices. Scale bars, 5 μm. (D) Quantitative analysis of vDNA colocalization with DBP at late stages of infection. EdC- and VdU-labeled vDNA was 3D segmented on the basis of AlexaFluor594 and AO-6MT signals. Overlap with 3D-segmented DBP objects was computed. Each data point represents a vDNA object, including puncta (Pcta). The median is shown in red. Statistical significance was determined as in (A). ****P < 0.0001. (E) Distance plots of vDNA objects segregated from the VRC late in infection. Data represent the shortest distance from single 3D-segmented vDNA surface objects (EdC) to the VRC (DBP and VdU). The color code indicates EdC pulse time. (F) Schematics depicting the spatial distribution of cellular and viral DNA late in infection. (G) vDNA colocalization with IIIa, 52K, IVa2, and 33K late in infection. Samples were prepared as in (B) and (C). Data distribution is shown as violin plots. The median is shown in red. Statistical significance was determined as in (A). *P < 0.03; **P < 0.0021; ***P < 0.0002; ****P < 0.0001; ns, not significant.
Fig. 4.
Fig. 4.. Late-replicated vDNA bubbles from VRC as distinct punctuate structures.
(A) Samples were prepared as described in Fig. 3 (B and C). Arrows in the zoom-in indicate single EdC puncta (EdC pulse, 22 to 24 hpi); arrowheads indicate single VdU puncta (VdU pulse, 32 to 34 hpi). Images are maximum projections. Scale bar, 10 μm. Scale bar in the zoom-in, 1 μm. (B) Distribution profile of early VRC, intermediate VRC, and nascent vDNA puncta across the nucleus. Samples were prepared as in Fig. 3 (B and C). Shortest distance plots from 3D-segmented EdC-labeled surfaces to the nuclear rim defined by the DAPI signal. Statistical significance was determined as indicated in Fig. 3A. *P < 0.03; ****P < 0.0001. (C) Colocalization of early VRC, intermediate VRC, and nascent vDNA puncta with 3D-segmented VRC defined by a late VdU pulse 32 to 34 hpi. Samples prepared as described in Fig. 3 (B and C). Each data point represents one EdC-vDNA object. The median is shown in red. Statistical significance was determined as in Fig. 3A. ****P < 0.0001. (D) Nascent vDNA puncta depend on the 52K protein and vDNA replication. A549 cells were infected with AdV-C5 wt or ΔL1-52K, pulsed with 2.5 μM EdC, and treated with 2.5 μM DFT 24 to 34 hpi. Samples were clicked with N3-AlexaFluor594. Data represent the proportion of nascent vDNA puncta and VRC normalized to the total EdC volume. Arrows indicate small vDNA objects (puncta); arrowheads indicate large vDNA objects distinct from VRC. Images are maximum projections. Scale bars, 10 μm.
Fig. 5.
Fig. 5.. Punctuate viral assembly intermediates containing vDNA and GFP-V bubbles from the VRC periphery.
(A) Protein V localizes to the periphery of VRC. A549 cells were infected with AdV-C2-GFP-V for 60 min, washed, pulse labeled with 2.5 μM EdC (22 to 24 hpi), washed, and fixed at 34 hpi. Samples were clicked with N3-AlexaFluor647 and imaged in an SP8 gSTED microscope. Data represent normalized intensities of vDNA (magenta) and GFP-V (green) across a dotted line. Scale bar, 5 μm. (B) gSTED analyses of nascent vDNA colocalizing with GFP-V in punctuate objects distant from the VRC. Samples were prepared and imaged as in A). Arrows indicate EdC vDNA-positive GFP-V puncta. Data represent normalized intensities of vDNA (magenta) and GFP-V (green) across a dotted line. Scale bar, 1 μm. (C) Nascent GFP-V puncta bubble from the VRC. A549 cells were infected with AdV-C2-GFP-V for 60 min, washed, and kept in FluoroBrite until imaging. Live-cell GFP-V signal was recorded on a single Z plane from 33:30 to 33:40 hpi at 0.5 Hz in an Olympus IXplore SpinSR10 spinning-disk microscope. Arrows indicate GFP-V puncta in single confocal slices. Scale bar, 10 μm. Scale bar in the zoom-in, 1 μm.
Fig. 6.
Fig. 6.. Movement, FRAP, and localization analyses of GFP-V puncta and viral particles.
(A and B) GFP-V puncta localize to the nuclear periphery and viral particles are observed in the nucleoplasm at late stages of infection. Live-cell Z stacks of A549 cells infected with AdV-C2-GFP-V for 60 min, washed, and kept in FluoroBrite until imaging with an axial resolution of 0.3 μm. Arrows indicate GFP-V puncta; arrowheads indicate virus particles (VP). Images show en face projections and orthogonal slices. Scale bars, 5 μm. (C and D) Nascent GFP-V puncta near the nuclear periphery have subdiffusive movements, while viral particles have virtually unrestricted movements in the nucleus. GFP-V was recorded on single Z planes at 31.2 Hz and objects were segmented, tracked, and classified in thousand frames using TrackMate and TraJClassifier. Object trajectories from 50 consecutive frames are colored on the basis of their movement type. Data distribution is shown as violin plots. The median is shown in red. Statistical significance was determined by unpaired t test. ****P < 0.0001. Images are single confocal slices. Scale bar, 10 μm. (E) Viral particles poorly recover their GFP-V fluorescence after photobleaching, unlike nascent GFP-V puncta and VRC. A549 cells were infected with AdV-C2-GFP-V and GFP-V recorded at 31.2 Hz both before and after laser photobleaching. Arrows indicate GFP-V puncta; arrowheads indicate VP. Red dashed lines mark the photobleached region. Images are single confocal slices. Scale bars, 1 μm. (F to H) Quantitative analysis of GFP-V FRAP in VRC, nascent GFP-V puncta, and viral particles. Data were collected as described in (C). Photobleached GFP-V objects were analyzed using the jru Fiji plugins. Representative normalized FRAP curves, each starting at 1 (F), recovery half-time (tau) (G), and total fluorescence recovery (H). Pcta, puncta. Each dot in (G) and (H) is from a distinct cell (5 ≦ n ≦ 13). The median is shown in red. Statistical significance was determined by nonparametric ANOVA with Holm-Sidak for multiple comparisons. *P < 0.03; ***P < 0.0002; ****P < 0.0001.
Fig. 7.
Fig. 7.. Nascent viral assembly intermediates and single virus particles were revealed by CLEM staining for vDNA and the capsid-DNA linchpin GFP-V.
(A) AdV capsid proteins localize to the 52K compartment. A549 cells constitutively expressing a 52K-mScarlet fusion protein were infected with AdV-C5 (MOI of 3) for 60 min and fixed at 34 hpi. Samples were stained with anti-VI or anti-52K antibodies (green) and anti-hexon (cyan). Arrows indicate hexon-positive regions within the inner nuclear periphery. Images show single confocal slices. Scale bar, 10 μm. (B to G) Scanning electron microscopy (SEM) analyses and visualization of GFP-V and EdC vDNA signals by CLEM showing that nascent GFP-V puncta are virus assembly intermediates. A549 cells were infected with AdV-C2-GFP-V for 60 min, washed, labeled with 2.5 μM EdC at 22 hpi, and fixed at 34 hpi. Sectioned cell pellets were clicked with N3-AlexaFluor594 and imaged in a ZEISS Elyra 7 Lattice SIM2 microscope, followed by a Zeiss Auriga 40 CrossBeam acquisition. Images were aligned in TrakEM2 using the DAPI signal. Black arrows indicate GFP-V–positive amorphous virus assembly intermediates; black arrows with an asterisk indicate nascent GFP-V puncta bubbling from the VRC; arrowheads indicate viral particles positive for EdC (magenta) and GFP-V (green) or both markers (white); arrowheads with an asterisk indicate viral particles in close vicinity of the GFP-V–positive virus assembly intermediates. SEM object diameters are indicated in nanometers. Scale bars, 5 μm. Scale bars in the zoom-in, 500 nm.
Fig. 8.
Fig. 8.. Spatiotemporal model depicting nuclear events in AdV morphogenesis, vDNA replication, nanogel-like intermediates, and formation of particles.
At late stages of infection (1), early-replicated vDNA (1a) along with cellular DNA (1b) is segregated to the nuclear periphery, while late-replicated vDNA gets packaged into progeny. Depending on vDNA replication (DFT interference) and the 52K protein, nascent puncta emerge (bubble) from the VRC into the 52K/IIIa compartment (2). These nascent objects contain late-replicated vDNA, GFP-V, and incomplete virions, but not DBP. GFP-V puncta exhibit subdiffusive movements (3). In the nuclear periphery, where the capsid proteins hexon and protein VI are enriched (4), the GFP-V puncta constitute the formation site for virus particles (5), which exhibit nearly unrestricted random diffusion in the nucleoplasm (6).

Similar articles

Cited by

References

    1. Trinkle-Mulcahy L., Lamond A. I., Toward a high-resolution view of nuclear dynamics. Science 318, 1402–1407 (2007). - PubMed
    1. Mitchison T. J., Salmon E. D., Mitosis: A history of division. Nat. Cell Biol. 3, E17–E21 (2001). - PubMed
    1. Elmore S., Apoptosis: A review of programmed cell death. Toxicol. Pathol. 35, 495–516 (2007). - PMC - PubMed
    1. Mei Y., Liu Y., Ji P., Understanding terminal erythropoiesis: An update on chromatin condensation, enucleation, and reticulocyte maturation. Blood Rev. 46, 100740 (2021). - PubMed
    1. Hao S. L., Ni F. D., Yang W. X., The dynamics and regulation of chromatin remodeling during spermiogenesis. Gene 706, 201–210 (2019). - PubMed

LinkOut - more resources