. 2024 Oct 25;9(100):eado0090.
doi: 10.1126/sciimmunol.ado0090. Epub 2024 Oct 25.

Gastrointestinal germinal center B cell depletion and reduction in IgA+ plasma cells in HIV-1 infection

Affiliations

Gastrointestinal germinal center B cell depletion and reduction in IgA+ plasma cells in HIV-1 infection

Francesca Cossarini et al. Sci Immunol. .

Abstract

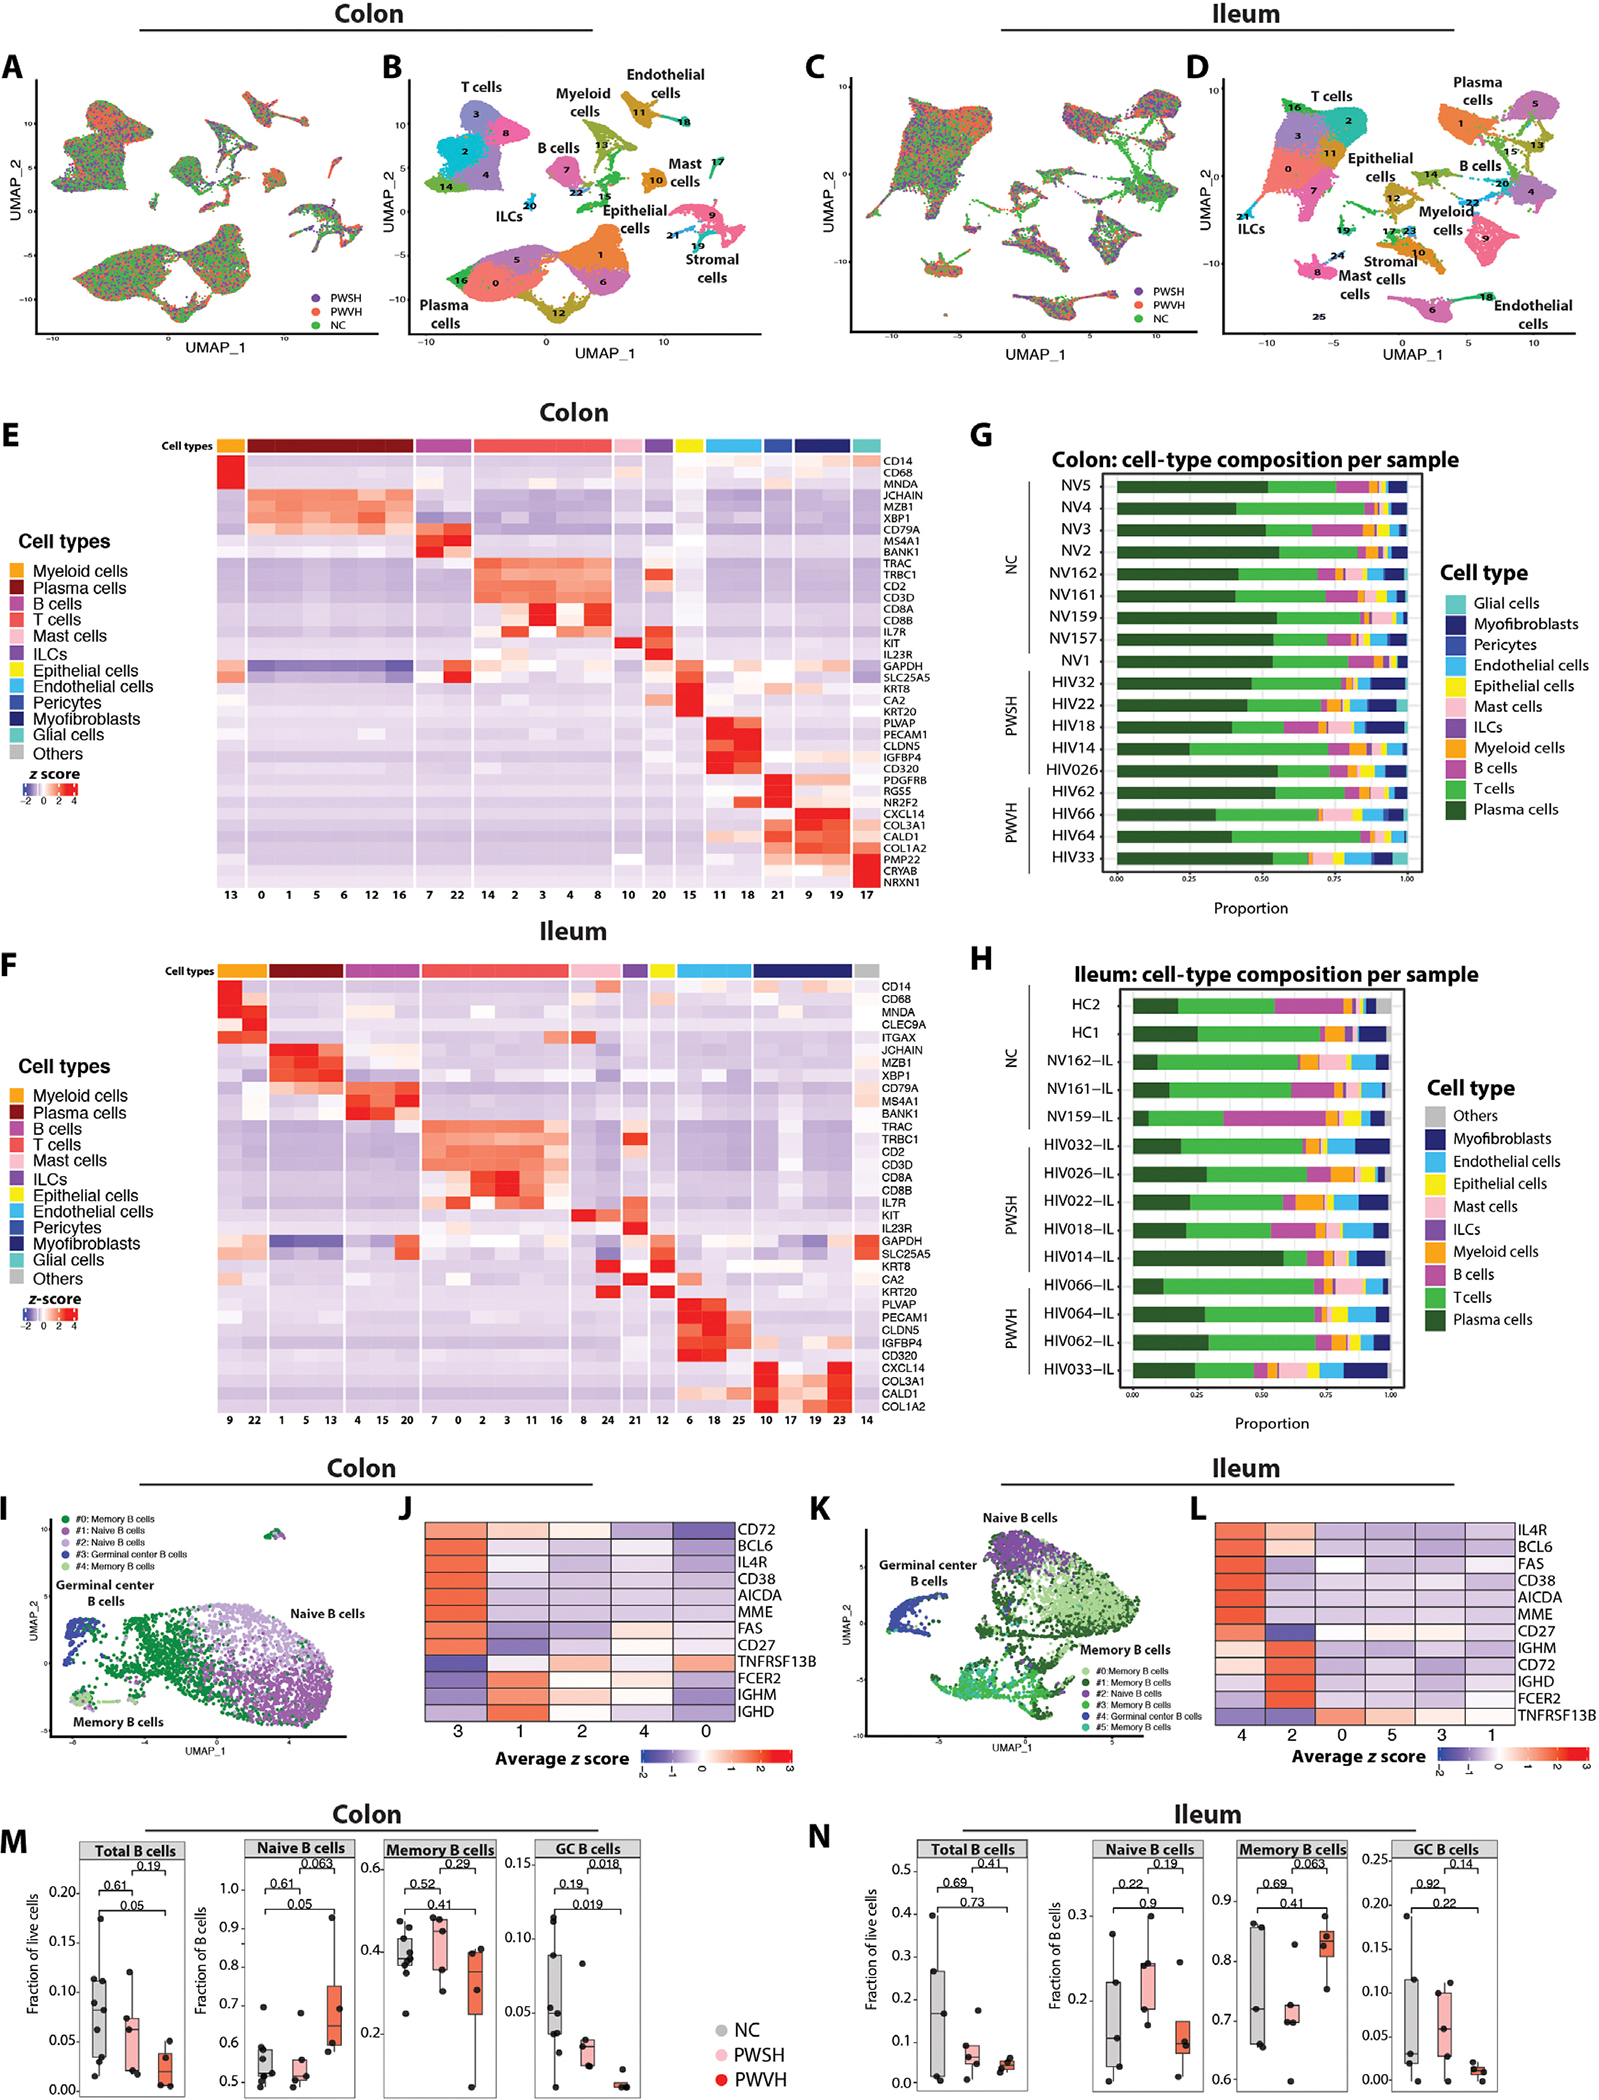
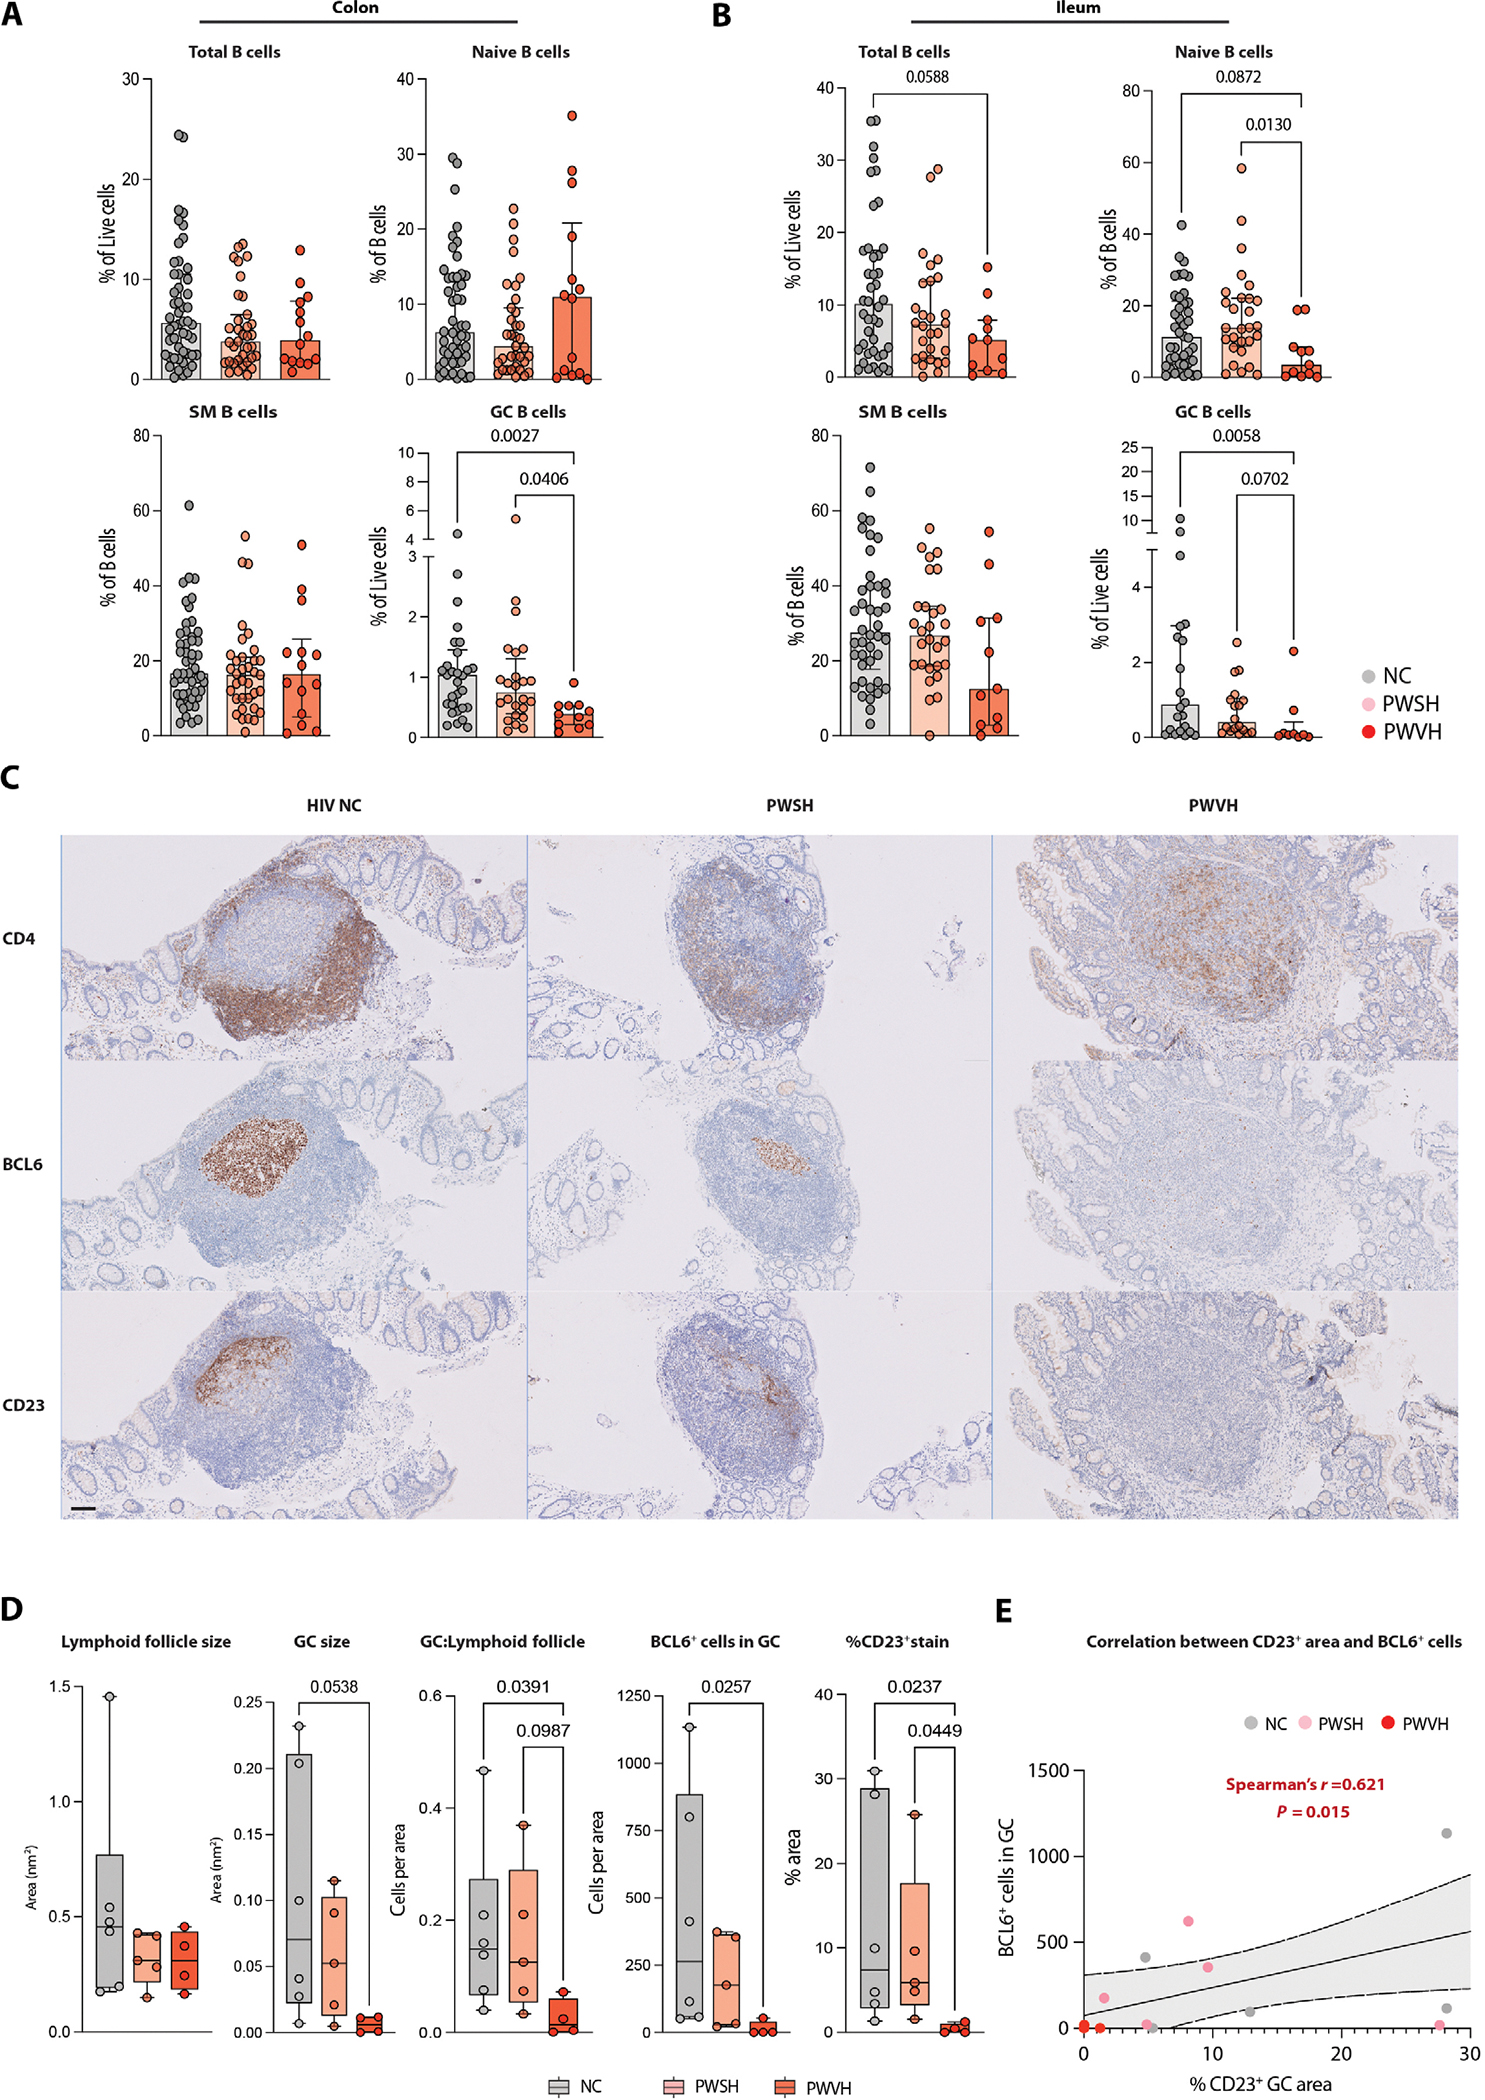
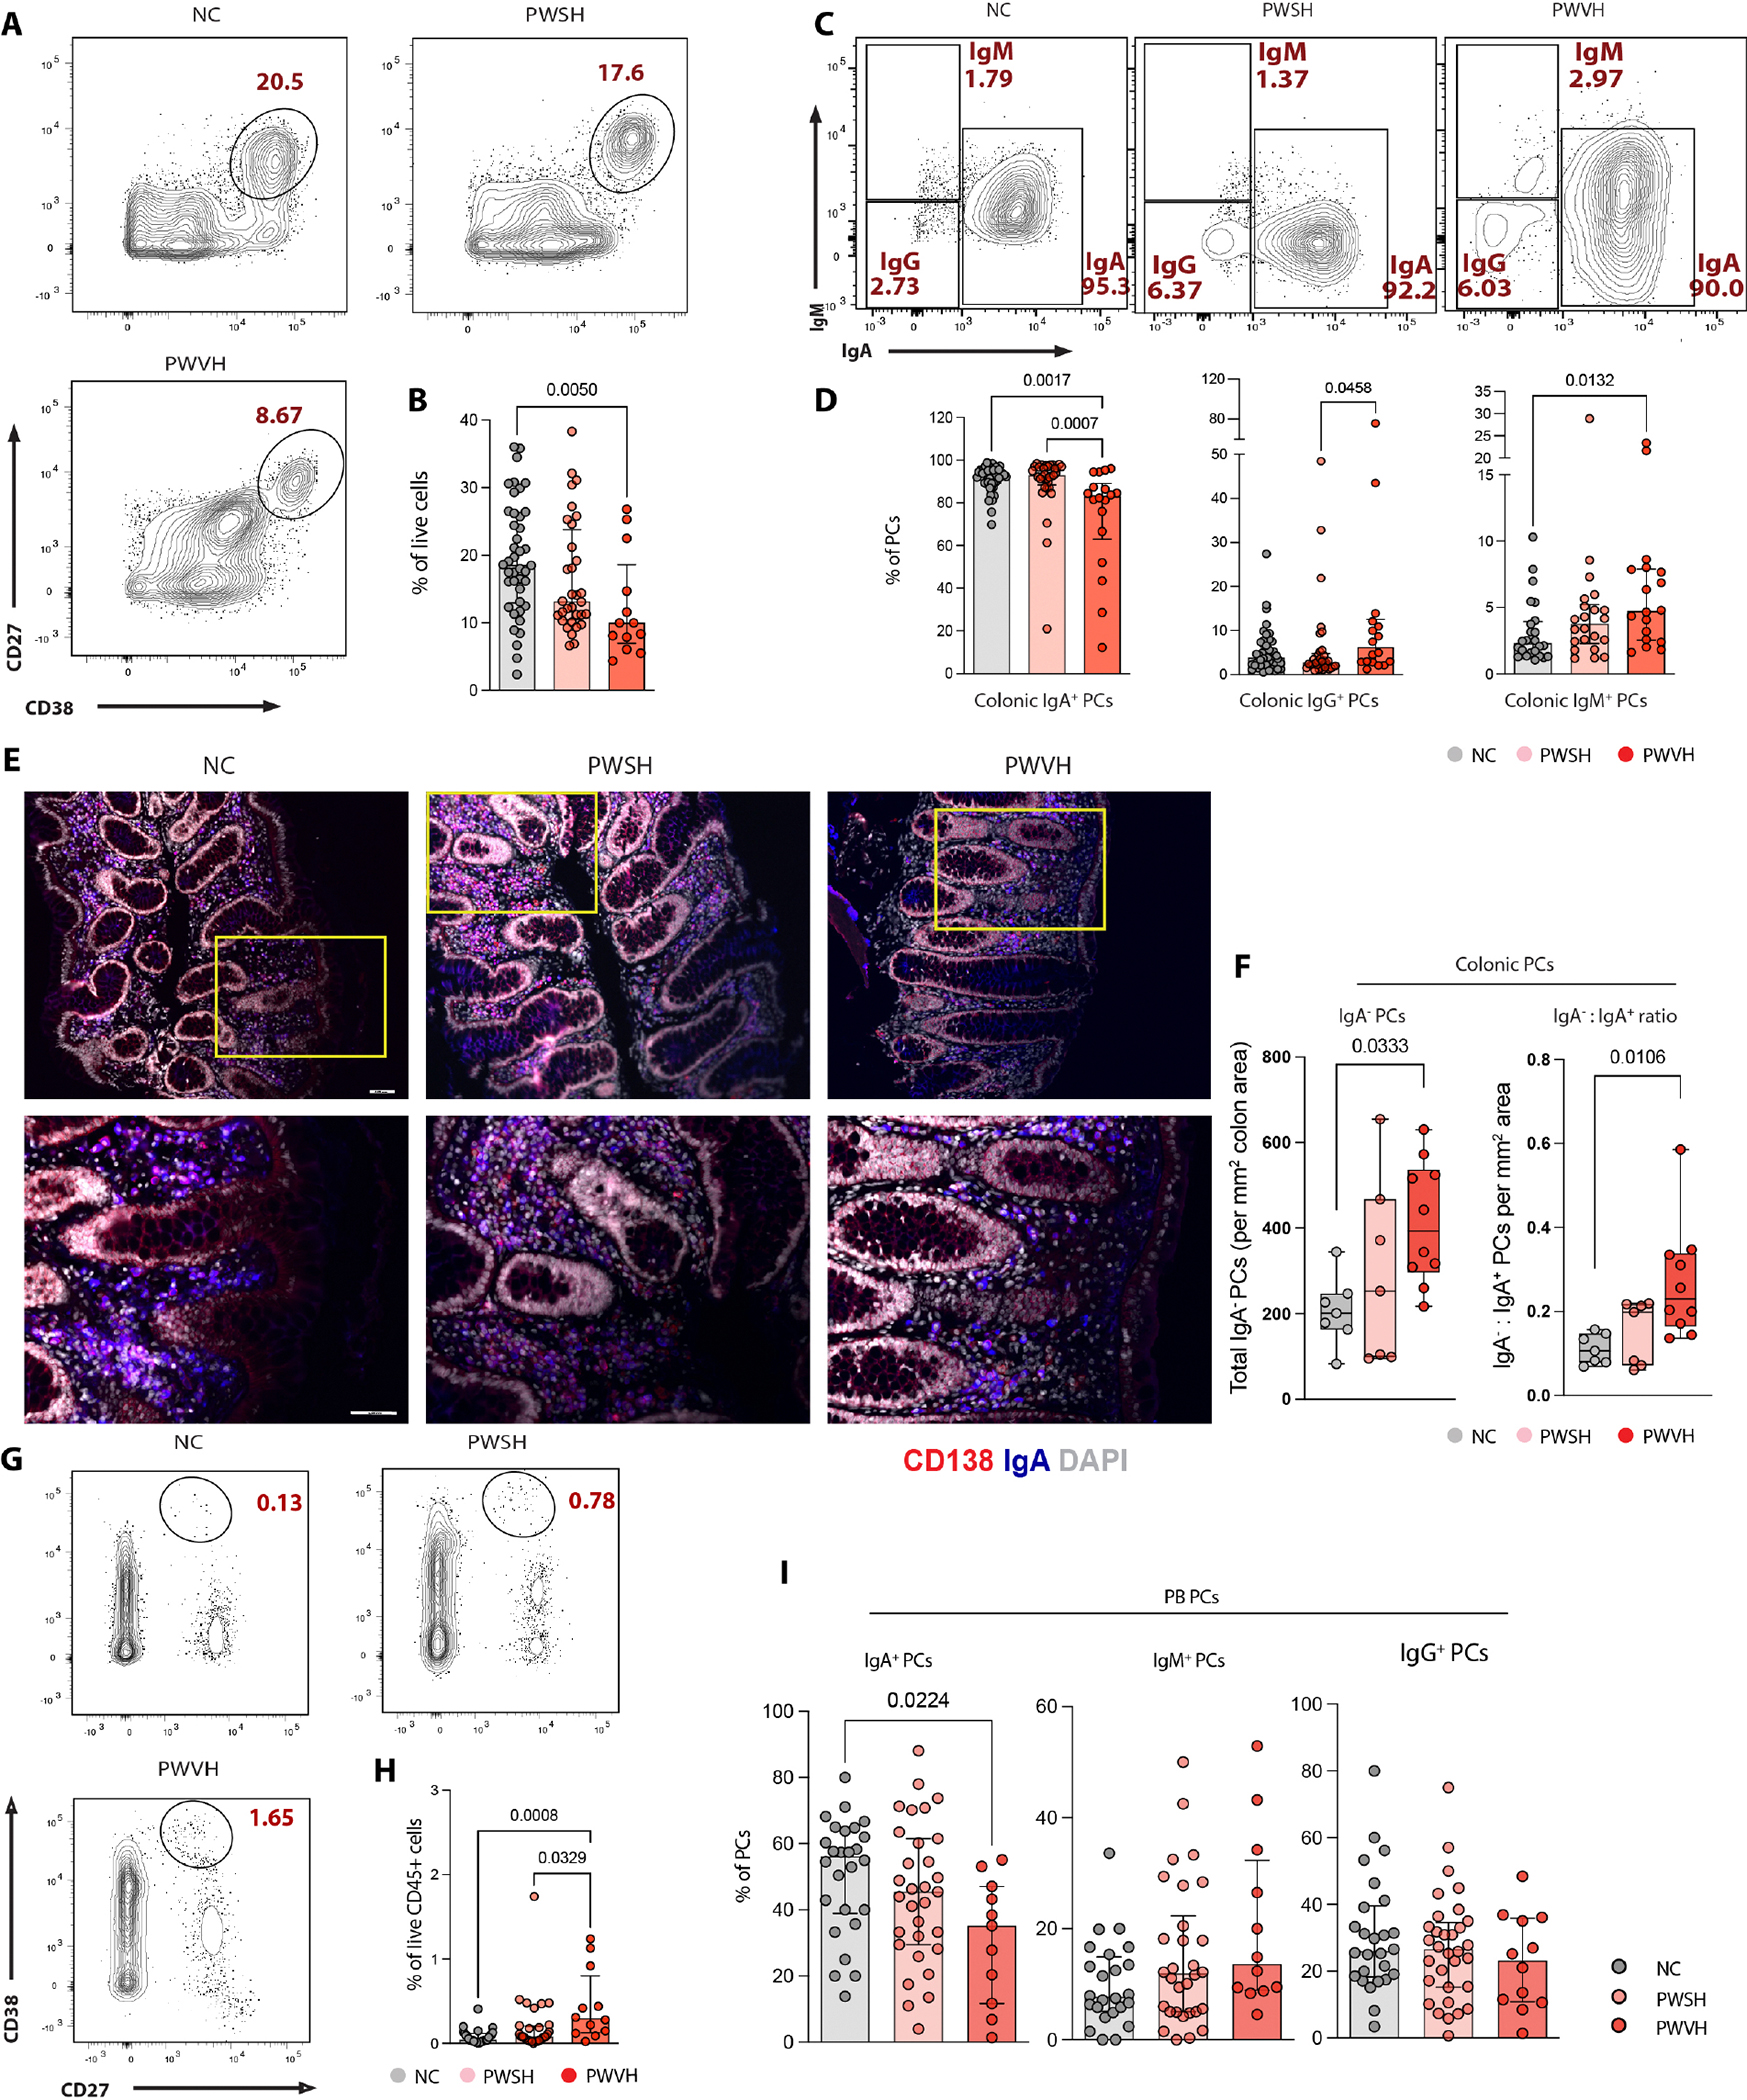
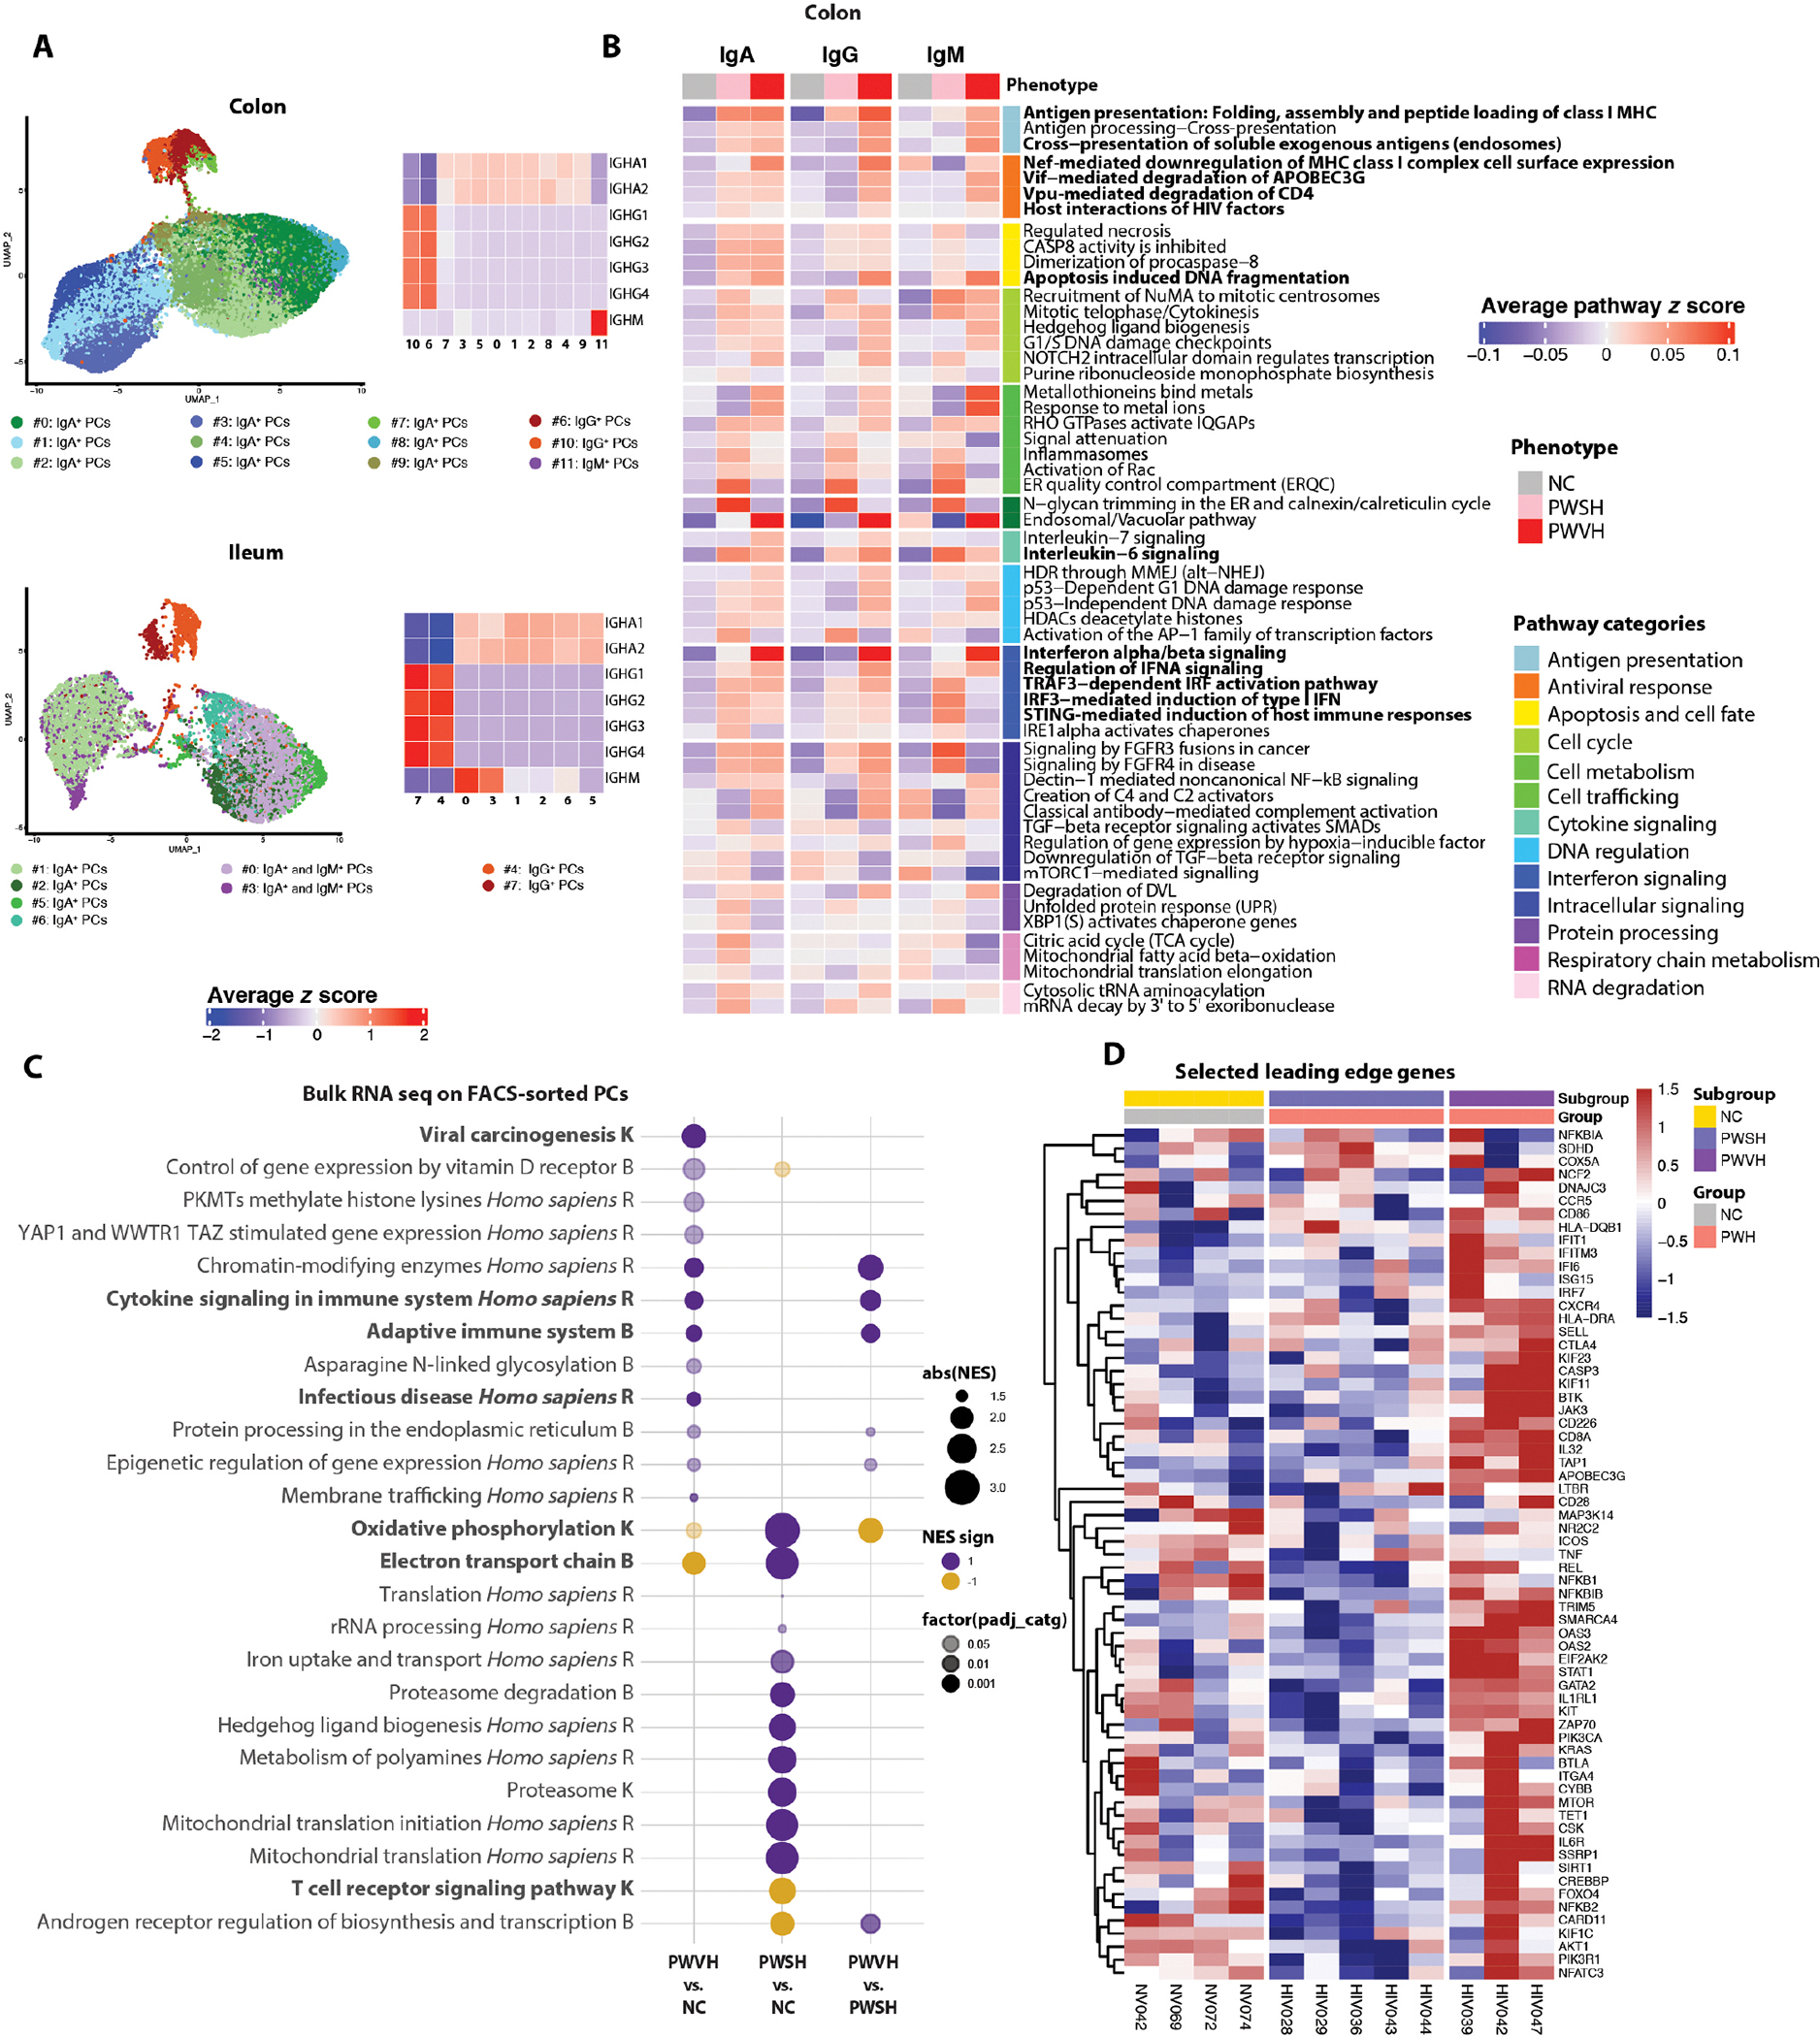
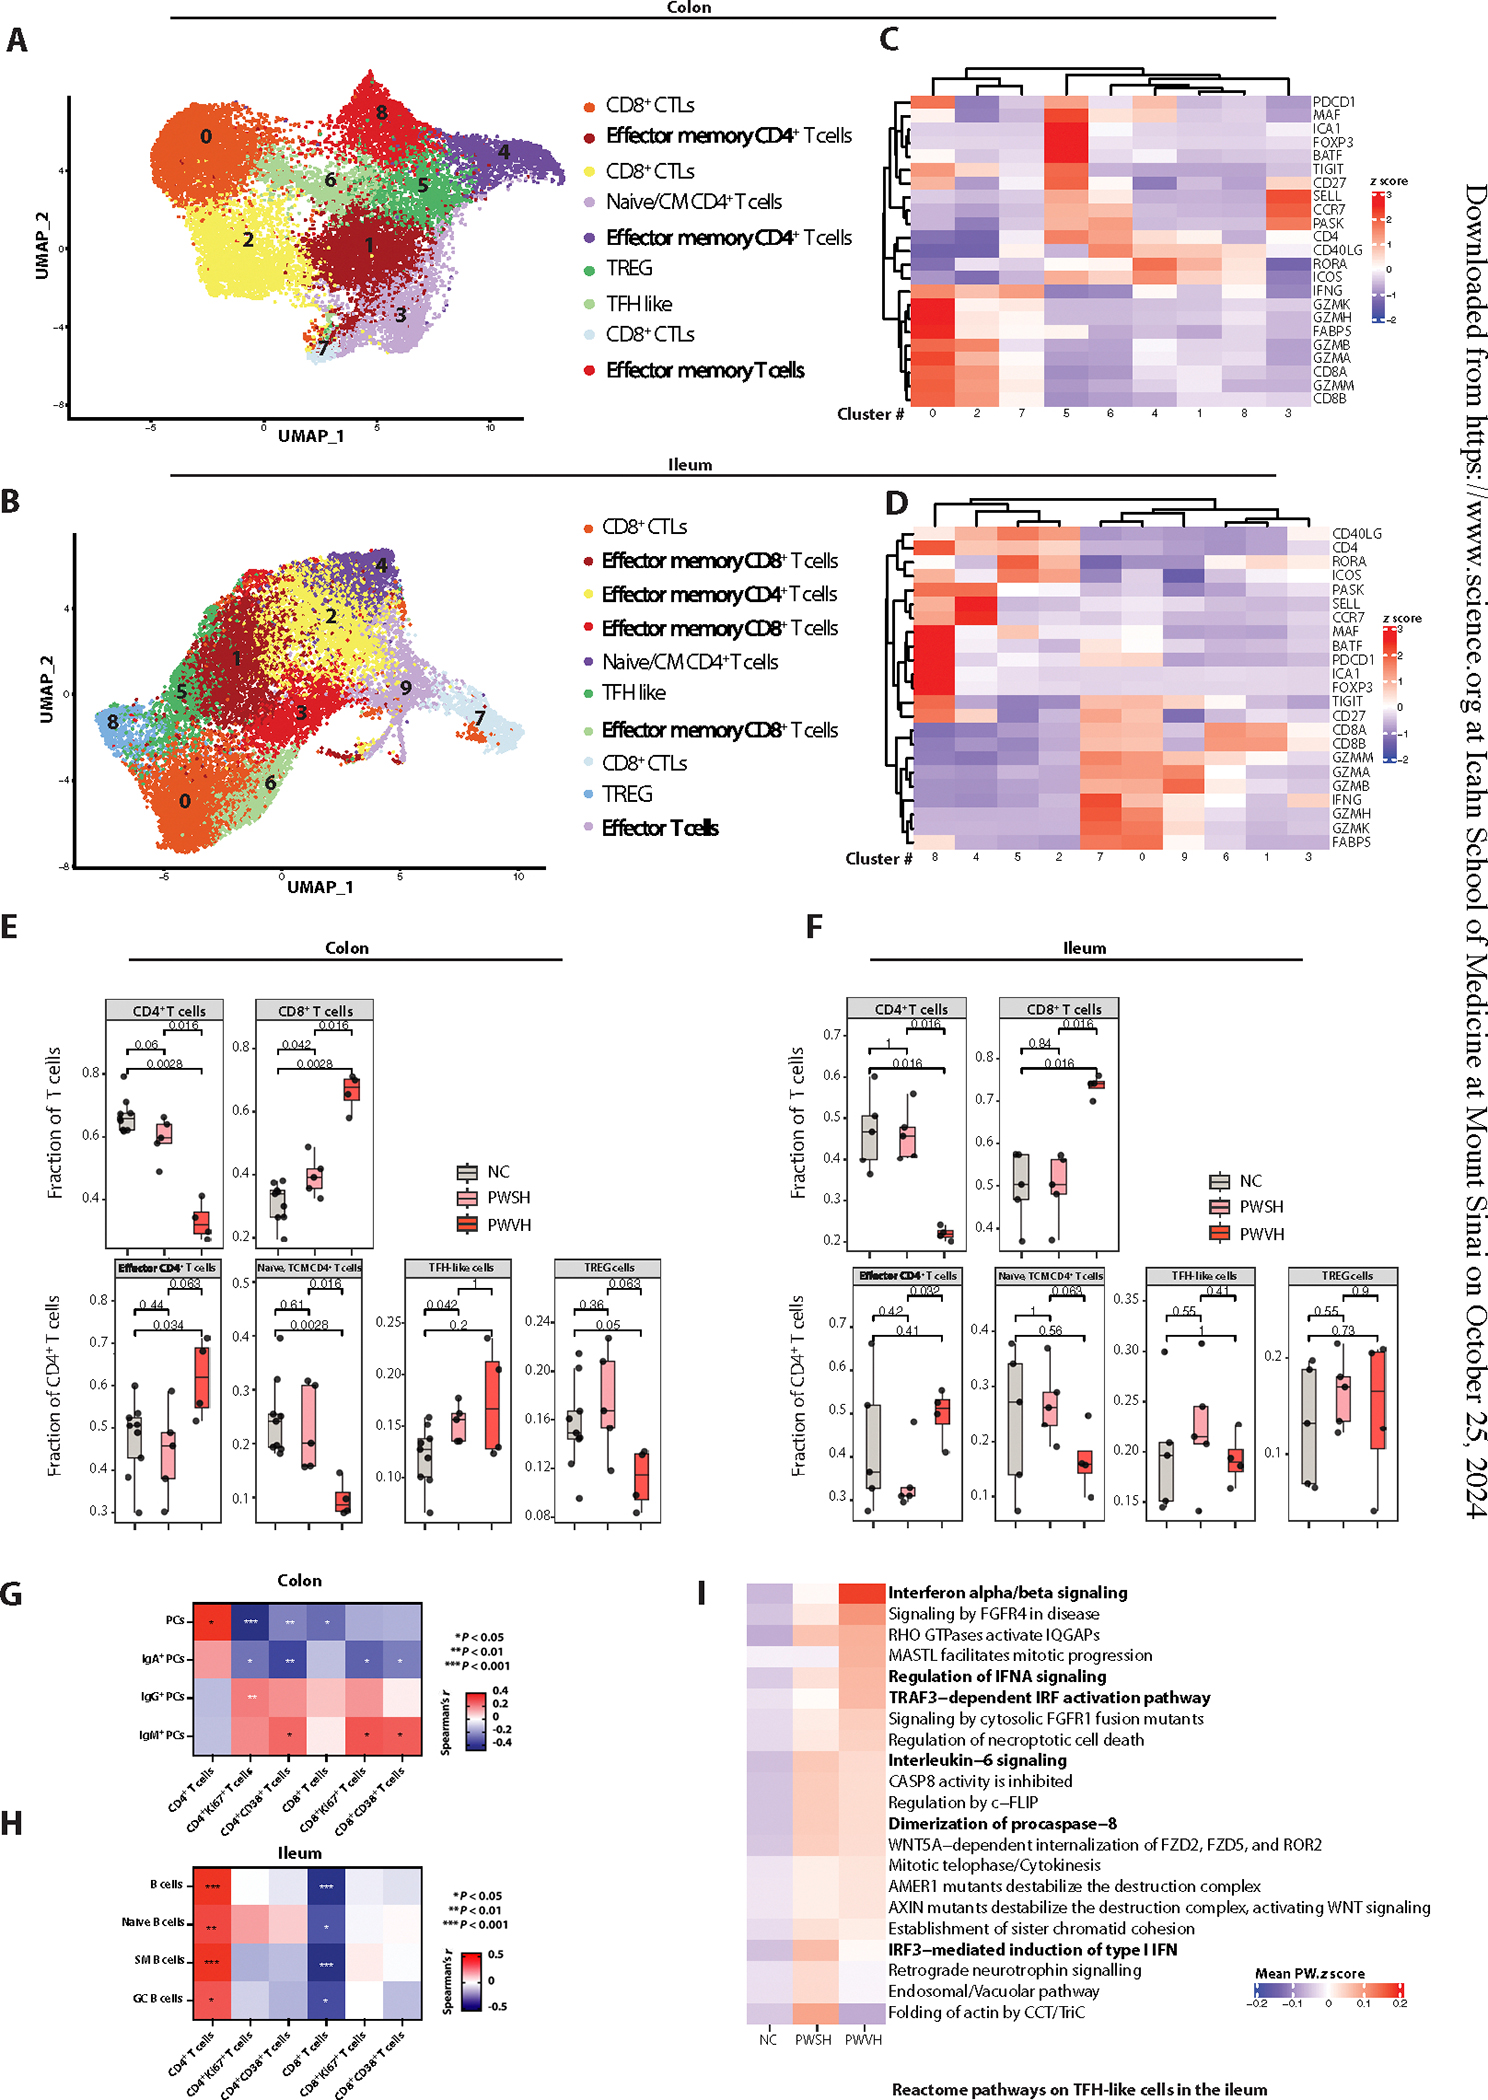
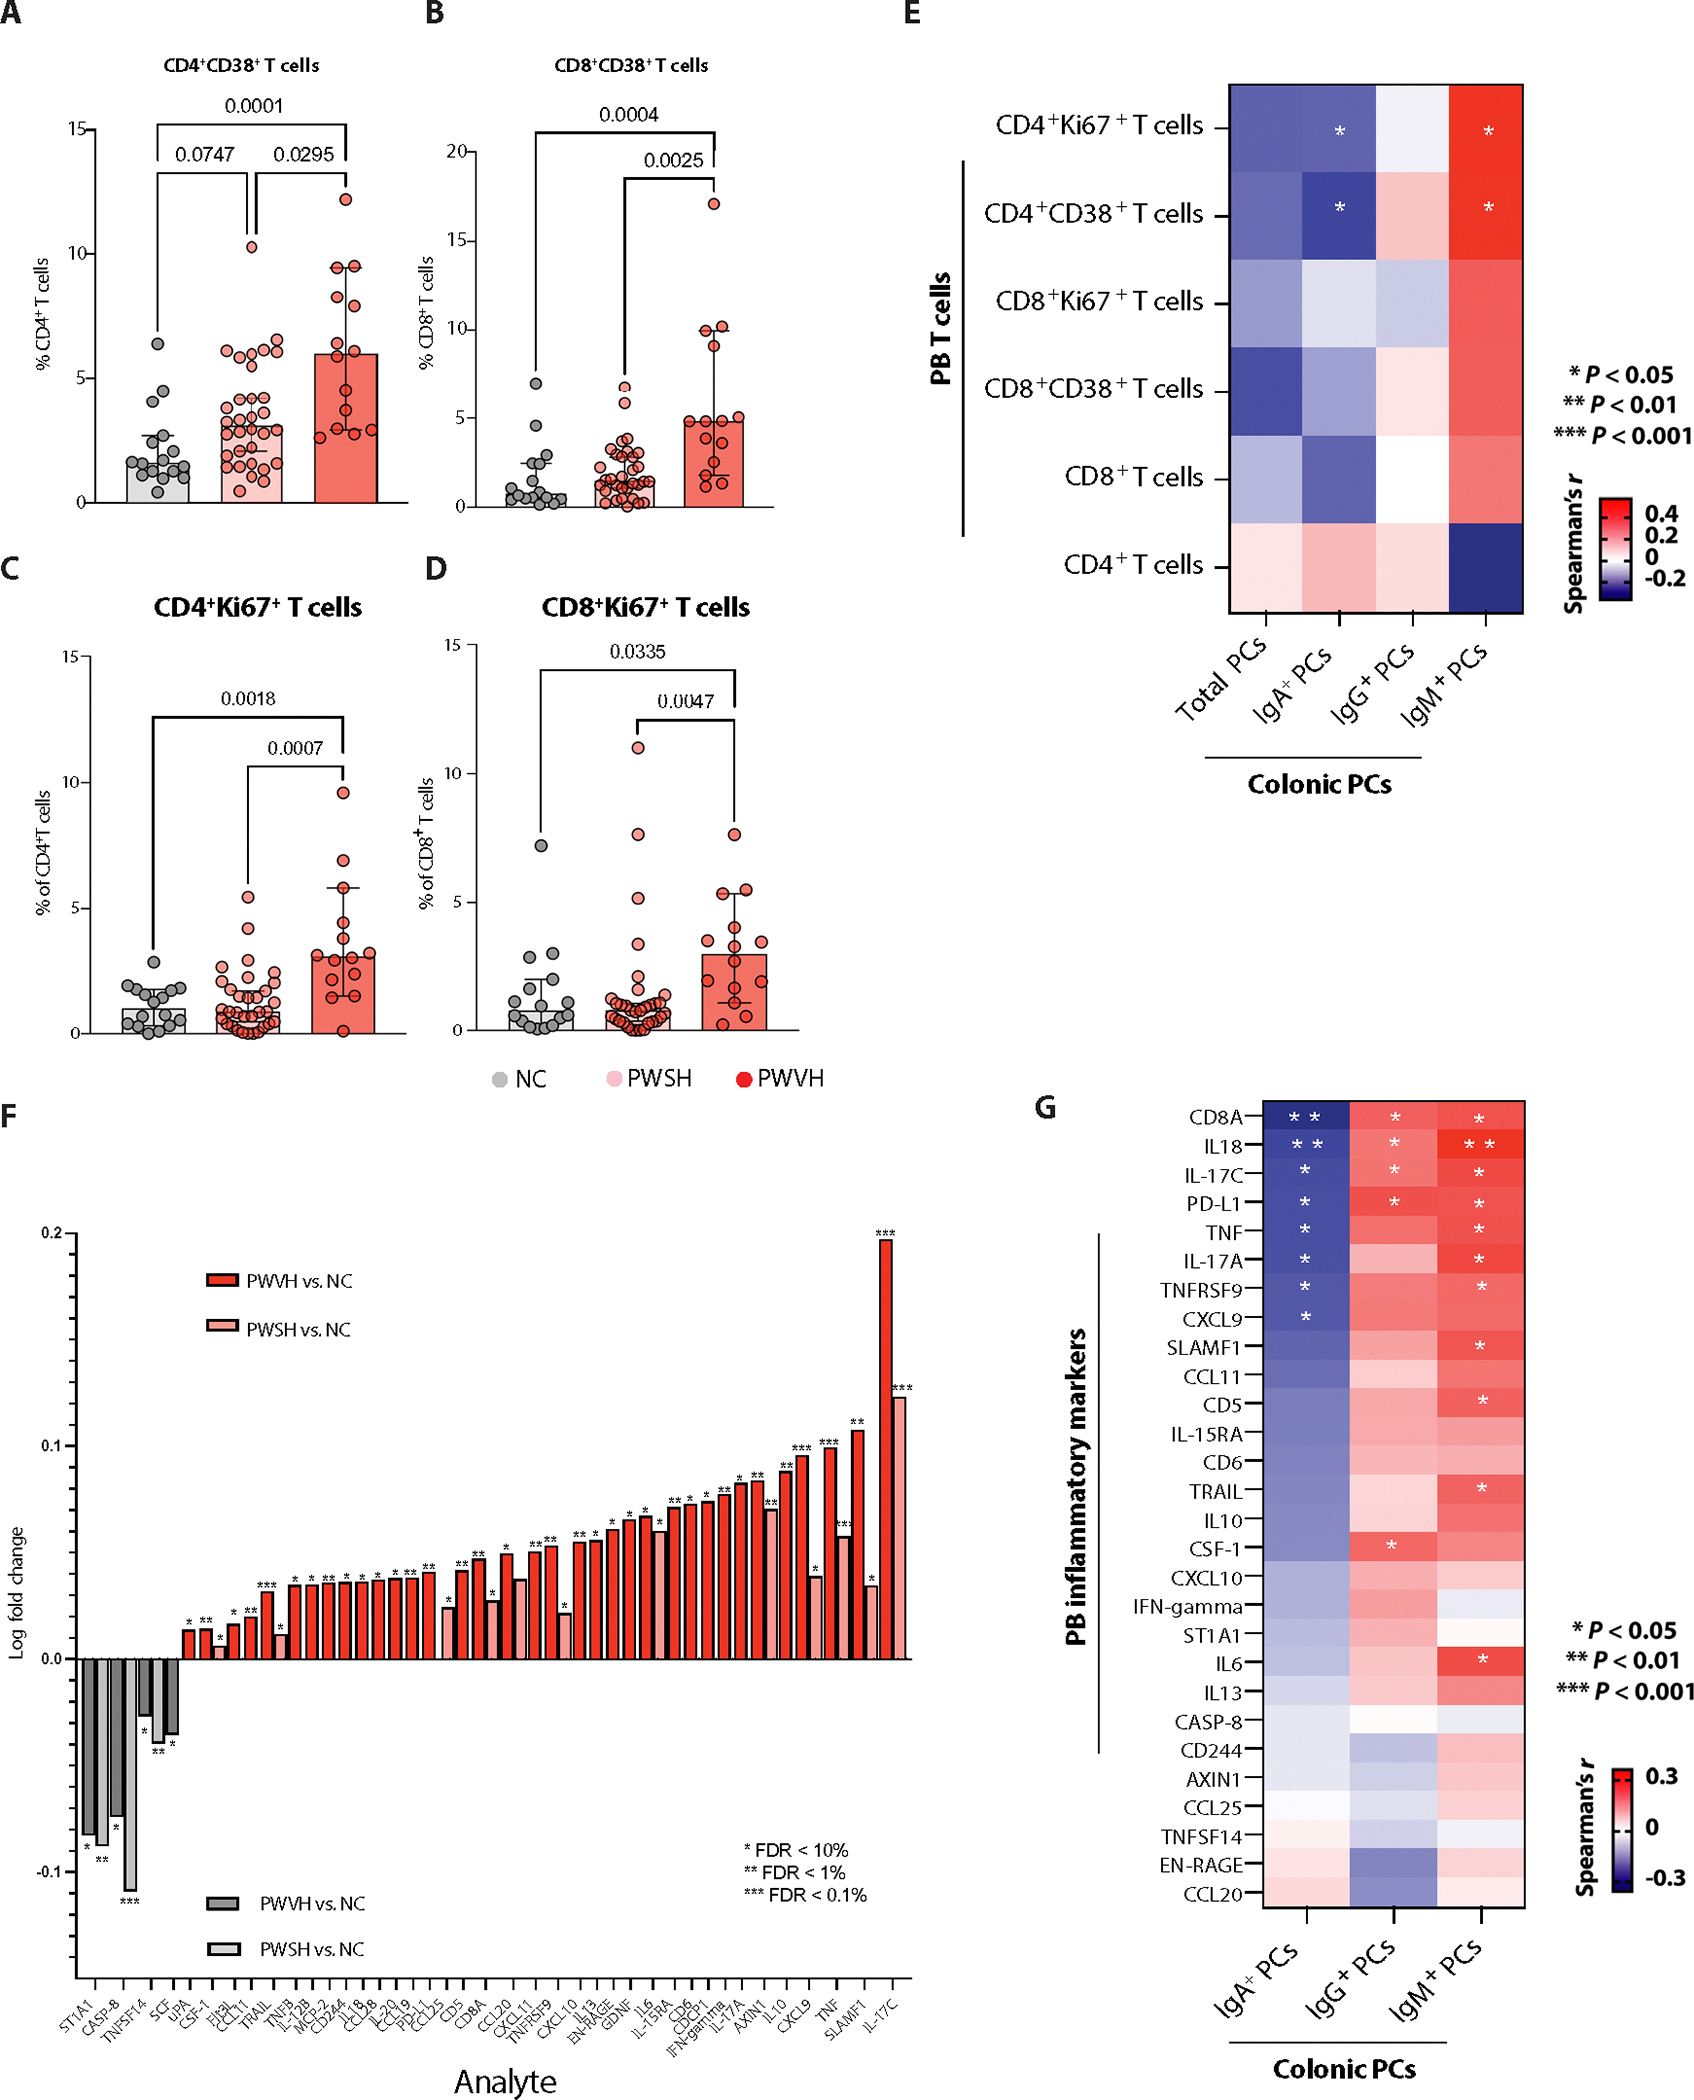
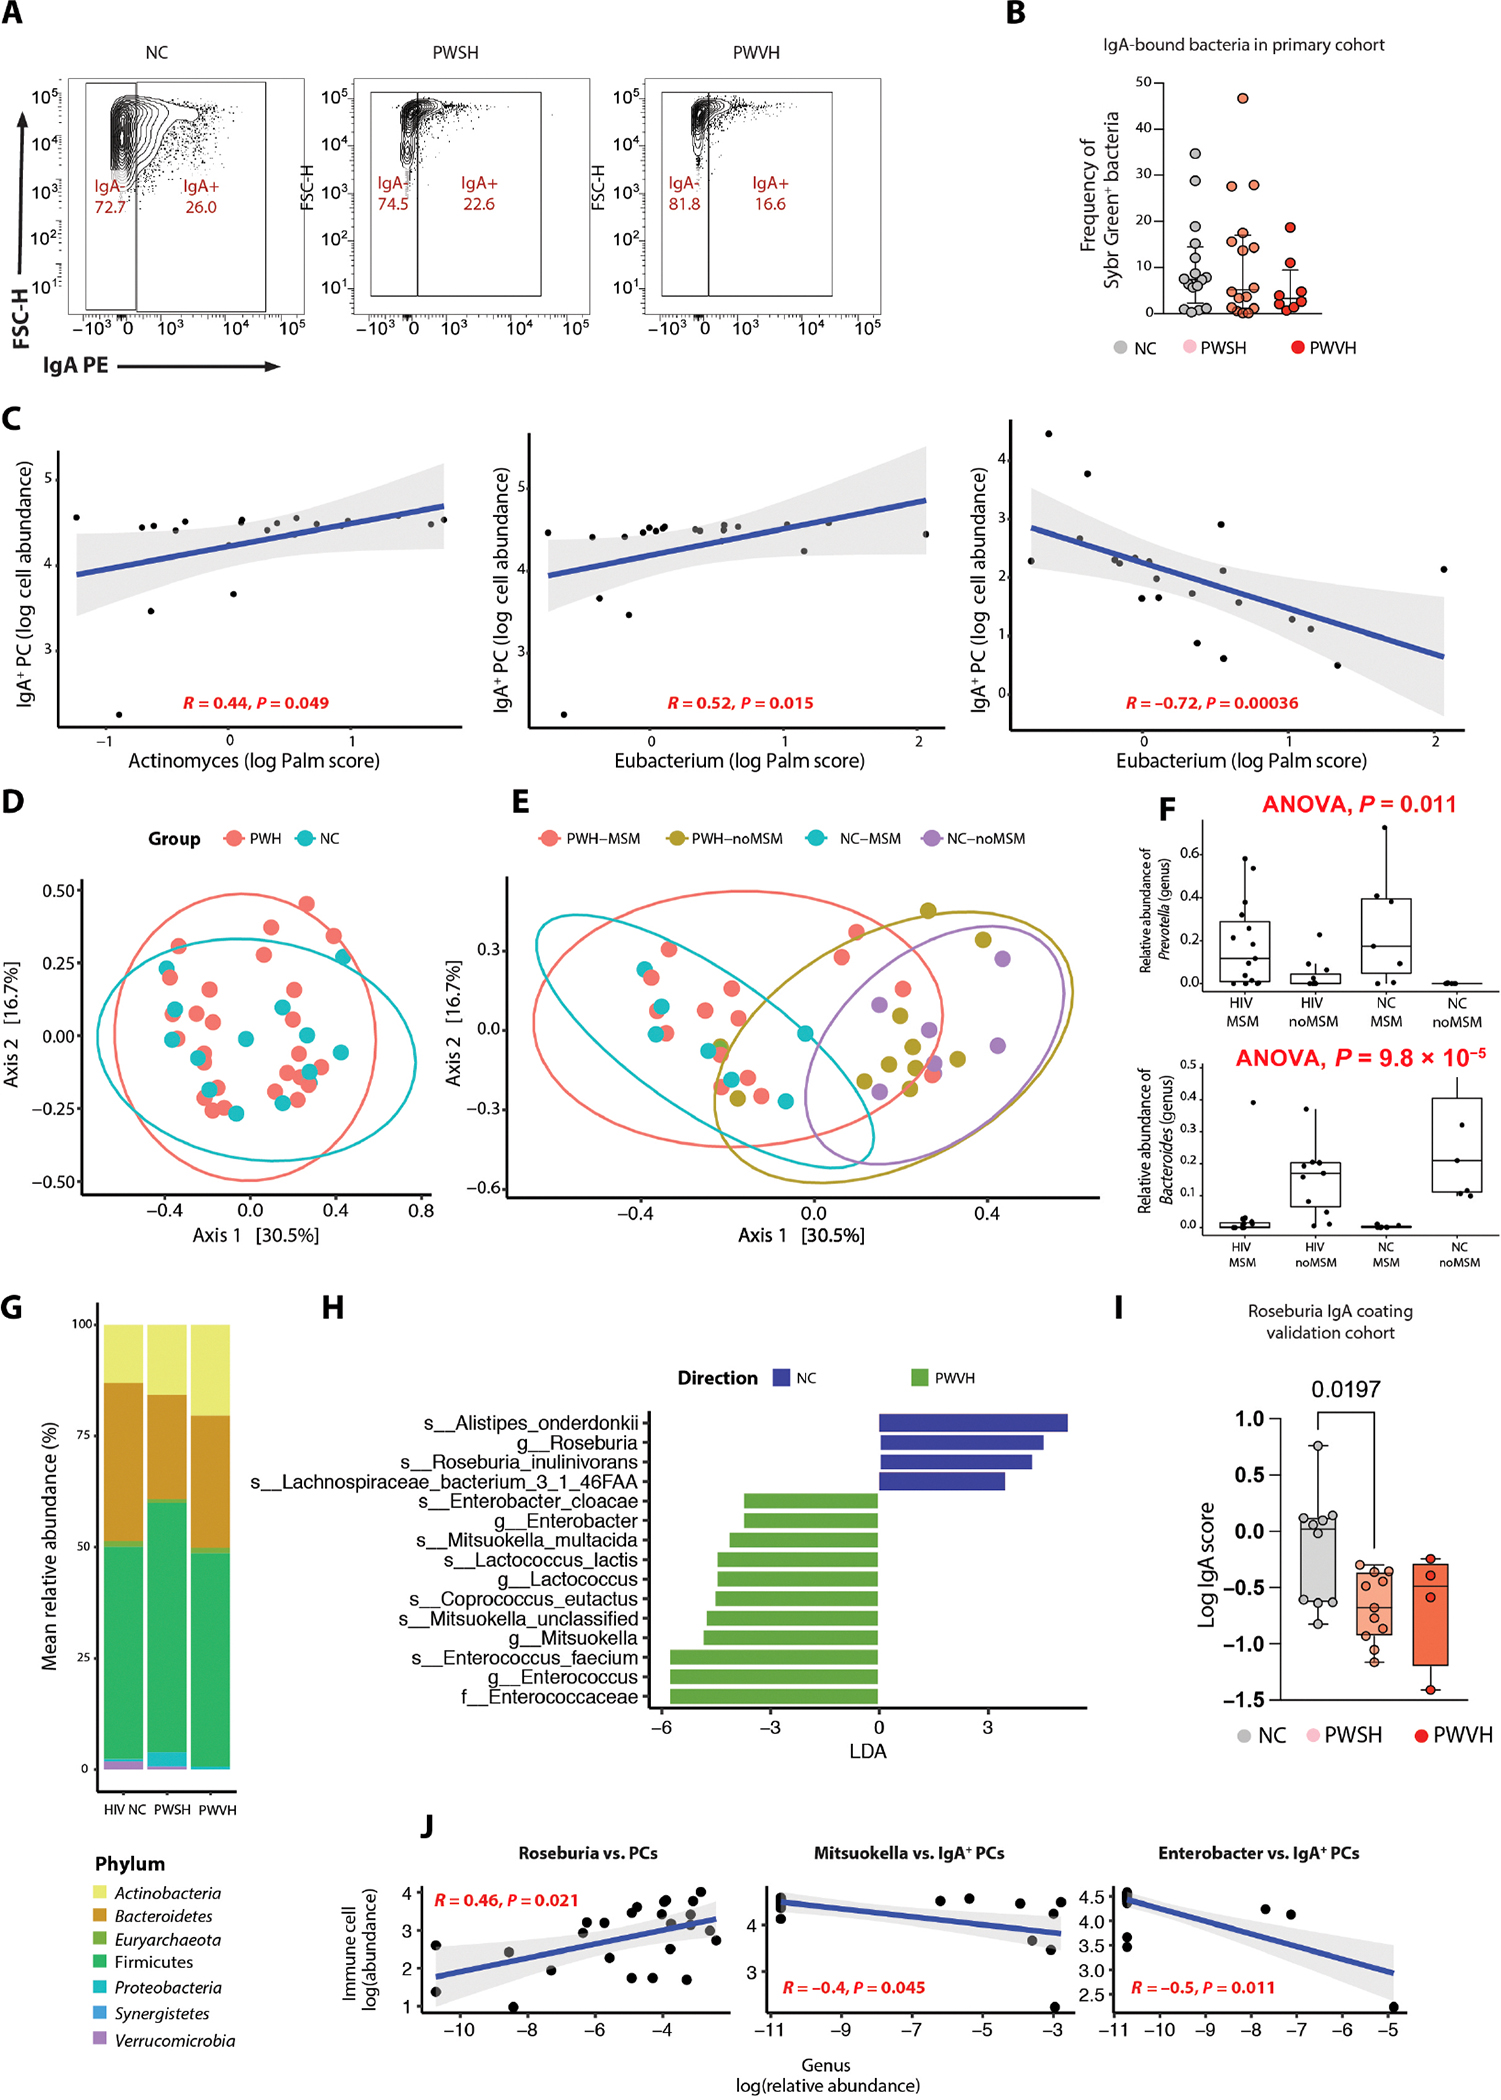
Gastrointestinal (GI) B cells and plasma cells (PCs) are critical to mucosal homeostasis and the host response to HIV-1 infection. Here, high-resolution mapping of human B cells and PCs sampled from the colon and ileum during both viremic and suppressed HIV-1 infection identified a reduction in germinal center (GC) B cells and follicular dendritic cells (FDCs) during HIV-1 viremia. Immunoglobulin A-positive (IgA+) PCs are the major cellular output of intestinal GCs and were significantly reduced during viremic HIV-1 infection. PC-associated transcriptional perturbations, including type I interferon signaling, persisted in antiretroviral therapy (ART)-treated individuals, suggesting ongoing disruption of the intestinal immune milieu during ART. GI humoral immune perturbations were associated with changes in the intestinal microbiome composition and systemic inflammation. These findings highlight a key immune defect in the GI mucosa due to HIV-1 viremia.


Conflict of interest statement

Competing interests: The authors declare that they have no competing interests.

Figures

Fig. 1.
Fig. 1.. scRNA sequencing–based identification of major immune cell types in the intestinal lamina propria during HIV infection.
(A) UMAP of scRNA-seq data from colonic lamina propria with representation of sample distribution across the groups (NCs, n = 9, green; PWSH, n = 5, orange; PWVH, n = 4, purple). (B) UMAP representing cell-type annotated clusters derived from the colonic lamina propria. (C) UMAP of ileal lamina propria–derived samples with representation of sample distribution across the groups (NCs, n = 5, green; PWSH, n = 5, orange; PWVH, n = 4, purple). (D) UMAP representing cell-type annotated clusters derived from the ileal lamina propria. (E and F) Heatmap showing the average z score–normalized log expression of canonical cell-type markers across different colonic (E) and ileum-derived (F) cell clusters. (G and H) Bar plots showing cell-type distribution within each individual for colon-derived (G) and ileum-derived (H) samples. (I) UMAPs showing reclustered, colon-derived B cell clusters using scRNA-seq. (J) Heatmap showing the average normalized log expression z score of canonical B cell markers across different colon-derived B cell subclusters. (K) UMAPs showing reclustered, ileum-derived B cell clusters using scRNA-seq. (L) Heatmap showing the average z score normalized log expression of canonical B cell markers across different ileum-derived B cell subclusters. (M and N) scRNA-seq data demonstrating the frequency of B cell subclusters derived from the colon (M) and ileum (N) across the three groups (NCs, n = 9 for colon and n = 5 for ileum; PWSH, n = 5 for both colon and ileum; PWVH, n = 4 for both colon and ileum). Bars represent median values. P values from Wilcoxon signed-rank sum test are reported.
Fig. 2.
Fig. 2.. Depletion of intestinal GC B cells during viremic HIV-1 infection.
(A and B) Flow cytometric data quantifying colon-derived (A) and ileum-derived (B) total B cells and B cell subsets. Comparisons between groups performed with one-way ANOVA with Dunn’s correction for multiple comparisons, and P values are as indicated. (C) Representative IHC images of intestinal lymphoid follicles for each of the three groups showing staining for CD4 (top), BCL6 (middle), and CD23 (bottom). Scale bar represents 100 μm. (D) Summary data for IHC (NCs, n = 6; PWSH, n = 5; PWVH, n = 4), quantifying lymphoid follicle size, GC size, the ratio between GC and lymphoid follicle size, the number of BCL6+ cells in each GC, and the % area positive for CD23 staining within each GC. (E) Correlation analysis between the area with positive CD23 staining and the number of BCL6+ cells within each GC. Comparisons between groups were performed using Kruskal-Wallis test with Dunn’s correction for multiple comparisons. Median and interquartile range were used to plot summary data, and P values <0.1 are shown as indicated (P values >0.1 are not shown). Correlation was obtained using Spearman’s r correlation coefficient, and P values are as indicated.
Fig. 3.
Fig. 3.. Colonic PCs are decreased during untreated HIV infection and show a switch in isotype expression.
(A) Representative flow cytometry plots of PCs (live CD27+CD38hicells) derived from NCs, n = 51; PWSH, n = 35; PWVH, n = 16. (B) Summary data quantifying colonic PCs for each of the three groups. (C) Representative flow cytometry plots demonstrating PC isotype expression. (D) Summary data quantifying colonic IgA+, IgG+, and IgM+ PCs. (E) Representative immunofluorescence (IF) images showing the expression of CD138 (red), IgA (blue), and DAPI (4′,6-diamidino-2-phenylindole) (gray). Top panels (10× magnification) with yellow inset are shown in the bottom panels (20× magnification). Red cells indicate IgA PCs, blue cells indicate IgA+ cells, and purple cells (merge) indicate IgA+ PCs. (F) Summary IF data showing total IgA PCs per square millimeter area (left) and ratio of IgA:IgA+ PCs per square millimeter area (right). (G) Representative flow cytometry plots of PB-derived PCs (live CD45+CD27+IgDCD38hicells) for each of the three groups. (H) Summary data quantifying PB PCs. (I) Summary data quantifying PB-derived IgA+, IgM+, and IgG+ PCs. Comparisons between groups were performed using Kruskal-Wallis test with Dunn’s correction for multiple comparisons. Median and interquartile range was used to plot summary data, and P values <0.1 are shown as indicated (P values >0.1 are not shown).
Fig. 4.
Fig. 4.. Plasma cell transcriptional profile is altered during HIV-1 infection.
(A) UMAPs (left) showing reclustered and PC clusters using scRNA-seq data and heatmaps (right) showing the average normalized log expression z score of immunoglobulin genes across different colon (top) and ileum (bottom) PC subclusters. (B) Heatmaps showing the mean pathway z score for each colon-derived PC isotype, across the three groups (NCs, n = 9 for colon and n = 5 for ileum; PWSH, n = 5 for both colon and ileum; PWVH, n = 4 for both colon and ileum). (C) Bubble plot showing the Normalized Enrichment Score (NES) of selected pathways of interest derived from the top five pathways identified with Sumer analysis (Materials and Methods) in FACS-sorted colonic PCs of each of the three groups (NCs, n = 4; PWSH, n = 5; PWVH, n = 3). The bubble size represents the NES, and the color represents the direction of the change (purple = increased, yellow = decreased). Color intensity indicates statistical significance levels, with lighter colors indicating P < 0.05, darker colors denoting P < 0.01, and the darkest colors indicating P < 0.001. Pathway names ending with “K” are from the KEGG database, “B” represents Bioplanet, and “R” stands for the Reactome database. (D) Heatmap showing the expression of selected leading edge genes (LEGs) from pathways in (C) for each participant across the three groups.
Fig. 5.
Fig. 5.. Viremic HIV-1 infection is associated with perturbations in T cell subsets including TFH-like cells.
(A and B) UMAPs showing reclustered, colon (A)– and ileum (B)–derived T cell clusters using scRNA-seq. (C and D) Heatmaps showing the average z score–normalized log expression of T cell–related genes across different colon-derived (C) and ileum-derived (D) T cell subclusters. (E and F) Boxplots showing the scRNA-seq–derived frequencies of colon-derived (E) and ileum-derived (F) CD4+ and CD8+ T cells as a fraction of all T cells (top), across the three groups (NCs, n = 9 for colon and n = 5 for ileum; PWSH, n = 5 for both colon and ileum; PWVH, n = 4 for both colon and ileum). In (E) and (F), bottom boxplots show the scRNA-seq–derived frequencies of colon-derived (E) and ileum-derived (F) subtypes of CD4+ T cells, across the three groups. In (E) and (F), comparisons were performed with Wilcoxon test; P values are as indicated. (G) Correlation matrix showing relationships between frequencies of colonic PCs and PC isotypes and frequency of colonic T cell subsets. (H) Correlation matrix showing relationships between frequencies of ileum-derived B cells and frequency of ileal T cell subsets. (G) and (H) represent data derived from the flow cytometric dataset (NCs, n = 51; PWSH, n = 35; PWVH, n = 16). (I) Heatmap representing the mean z score enrichment for selected pathways within the ileum-derived TFH-like T cell subcluster.
Fig. 6.
Fig. 6.. Altered frequency and isotype expression of colonic PCs contribute to persistent systemic inflammation and immune activation during HIV infection.
(A and B) Frequency of PB-derived, activated (CD38+) CD4 T cells (A) and CD8+ T cells (B) obtained via flow cytometry, across the three groups of study participants (NCs, n = 33; PWSH, n = 32; PWVH, n = 12). (C and D) Frequency of PB-derived cycling (Ki67+) CD4+ T cells (C) and CD8+ T cells (D) across the three groups of study participants. For (A) to (D), comparisons between groups were performed using Kruskal-Wallis test with Dunn’s correction for multiple comparisons. Median and interquartile range were used to plot summary data; P values <0.1 are shown as indicated (P values >0.1 are not shown). (E) Correlation matrix showing the correlation between colonic PCs and PC isotypes and PB-derived activated and cycling T cell subsets using flow cytometry data, and correlation was obtained using Spearman’s r correlation coefficient; P values are as indicated. (F) Bar plot showing systemic inflammatory markers in PWVH compared with NCs (dark red) and in PWSH versus NCs (light red). Dark gray bars represent systemic inflammatory markers found to be significantly higher in NCs compared with PWVH, and light gray bars indicate systemic inflammatory markers found to be significantly higher in NCs compared with PWSH. Comparisons were performed by Student’s t test with Benjamini-Hochberg correction for multiple comparisons; P values are as indicated. (G) Correlation matrix showing the relationship between flow cytometry–derived colonic PCs as well as PC isotypes and systemic inflammatory markers noted to be elevated in PWH compared with NCs. Correlation was obtained using Spearman’s r correlation coefficient; P values are as indicated.
Fig. 7.
Fig. 7.. Distinct intestinal microbiota changes and targeting by secretory IgAs during HIV infection relate to altered colonic PC isotype expression.
(A) Representative flow plots showing IgA-bound and unbound stool bacteria across the three groups (NCs, PWSH, and PWVH). (B) Summary data representing the frequency of IgA-bound bacteria across the three groups where stool samples were available for stool bacteria sorting in the primary cohort (NCs, n = 16; PWSH, n = 18; PWVH, n = 7). Bar represents median and IQR values. Statistical comparisons were performed with Mann-Whitney test; P values are as indicated. (C) Correlation plots between log Palm score and log cell abundance of IgA+ or IgG+ colonic PCs for bacteria where a significant correlation was found. (D) PCoA plot showing beta diversity (using Bray-Curtis distances) between PWH and NCs. (E) PCoA plot showing beta diversity (using Bray-Curtis distances) across PWH who are MSM or not and NCs who are MSM or not. (F) Box plots showing the relative abundance of Prevotella (top) and Bacteroides (bottom) across PWH and NCs who are MSM or not. (G) Bar plot showing the distribution of bacterial phyla across the three groups. (H) LEfSe performed on all operational taxonomic units (OTUs) comparing PWVH and NCs. (I) Log IgA score for Roseburia in the validation cohort. Bar represents median and IQR values. Statistical comparisons performed with Mann-Whitney test; P values are as indicated. (J) Correlation plots between the relative abundance of selected bacterial genera and the frequency of colonic PCs or IgA PCs.

Update of

References

    1. Corti D, Lanzavecchia A, Broadly neutralizing antiviral antibodies. Annu. Rev. Immunol. 31, 705–742 (2013). - PubMed
    1. Guadalupe M, Reay E, Sankaran S, Prindiville T, Flamm J, McNeil A, Dandekar S, Severe CD4+ T-cell depletion in gut lymphoid tissue during primary human immunodeficiency virus type 1 infection and substantial delay in restoration following highly active antiretroviral therapy. J. Virol. 77, 11708–11717 (2003). - PMC - PubMed
    1. Li Q, Duan L, Estes JD, Ma ZM, Rourke T, Wang Y, Reilly C, Carlis J, Miller CJ, Haase AT, Peak SIV replication in resting memory CD4+ T cells depletes gut lamina propria CD4+ T cells. Nature 434, 1148–1152 (2005). - PubMed
    1. Veazey RS, DeMaria M, Chalifoux LV, Shvetz DE, Pauley DR, Knight HL, Rosenzweig M, Johnson RP, Desrosiers RC, Lackner AA, Gastrointestinal tract as a major site of CD4+ T cell depletion and viral replication in SIV infection. Science 280, 427–431 (1998). - PubMed
    1. Brenchley JM, Hill BJ, Ambrozak DR, Price DA, Guenaga FJ, Casazza JP, Kuruppu J, Yazdani J, Migueles SA, Connors M, Roederer M, Douek DC, Koup RA, T-cell subsets that harbor human immunodeficiency virus (HIV) in vivo: Implications for HIV pathogenesis. J. Virol. 78, 1160–1168 (2004). - PMC - PubMed

Publication types

Substances