. 2025 Jan;12(1):e2410769.
doi: 10.1002/advs.202410769. Epub 2024 Oct 25.

Gene Therapy for Inflammatory Cascade in Intrauterine Injury with Engineered Extracellular Vesicles Hybrid Snail Mucus-enhanced Adhesive Hydrogels

Affiliations

Gene Therapy for Inflammatory Cascade in Intrauterine Injury with Engineered Extracellular Vesicles Hybrid Snail Mucus-enhanced Adhesive Hydrogels

Xiaotong Peng et al. Adv Sci (Weinh). 2025 Jan.

Abstract

Early hyper-inflammation caused by intrauterine injury triggered subsequent intrauterine adhesion (IUA). STAT1-mediated M1 macrophages are confirmed to secrete pro-inflammatory cytokines to accelerate inflammatory cascade and IUA formation by multi-omics analysis and experimental verification. However, clinically used hyaluronic acid (HA) hydrogels are prone to slip out of injury sites due to poor bio-adhesion properties. Therefore, there are still challenges in applying hydrogels for M1 macrophage intervention in IUA treatment. Herein, an engineered extracellular vesicles (EVs) hybrid snail mucus (SM)-enhanced adhesive hydrogels to improve bio-adhesion property is fabricated and M1 macrophage intervention through targeting delivery and STAT1 silencing is achieved. First, inspired by the high bio-adhesion capacity of SM, SM and gelatin methacrylate (GelMA) solution are mixed to construct GelMA/SM (GS) hydrogel. Then, folic acid-modified extracellular vesicles (FA-EVs) are synthesized for targeting the delivery of STAT1-siRNA. Upon injection of FA-EVs hybrid GS hydrogel into the uterine cavity, a protective hydrogel layer forms on the surface of injury sites and sustains the release of STAT1-siRNA-loaded FA-EVs to curtail M1 macrophages generation through inhibiting STAT1 phosphorylation, resulting in reduction of myofibroblasts activation and collagen deposition. In addition, the pregnancy rate and the number of fetuses in rats treated with this hydrogel were much higher than those in other groups, suggesting that the hydrogel could promote functional endometrial regeneration and restore fertility. Overall, this study presents a promising strategy for employing FA-EVs hybrid adhesive hydrogel with superior bio-adhesion properties and M1 macrophage targeting delivery for IUA treatment and uterus recovery.

Keywords: adhesive hydrogels; extracellular vesicles; gene therapy; intrauterine adhesions; macrophage polarization.


Conflict of interest statement

The authors declare no conflict of interest.

Figures

Scheme 1
Scheme 1
Schematic representation of siRNA@FA‐EVs/GS hydrogel inhibited M1 macrophage polarization and pro‐inflammatory cytokines production through the inhibition of STAT1 phosphorylation, which reduced the transformation of endometrial stromal cells into myofibroblasts and collagen deposition, and inhibited the formation of intrauterine adhesion.
Figure 1
Figure 1
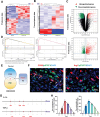
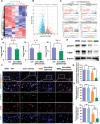
A, B) Heatmap analysis of proteomics and transcriptomic dataset. C) Volcano plot exhibited DEGs and DEPs in the transcriptomic dataset and proteomics dataset. D) Gene set enrichment analysis (GSEA) of genes altered GO and KEGG pathway analysis. E) Venn diagram analysis of the intersection of transcriptomic data and proteomics data. F) Immunofluorescence co‐localization of pSTAT1 in M1 (CD86‐labeled) and M2 (Arg1‐labeled) macrophages in IUA. G) STAT1 binding sites in the promoter region of TNF‐α and IL‐1β. H) The concentration of TNF‐α and IL‐1β in the disease course (0, 1, 3, 7, 14, 28 days after surgery), Data are presented as mean ± SD, n = 3.
Figure 2
Figure 2
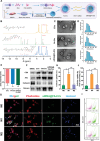
A) The synthesis process of siRNA@FA‐EVs. B) 1H‐NMR of DSPE‐PEGFA. C) The morphology of EVs and FA‐EVs were detected by TEM. D, E) Particle size and zeta potential of EVs, FA‐EVs and siRNA@FA‐EVs. F) Detection of extracellular vesicle biomarkers of BMSC, EVs, FA‐EVs, and siRNA@FA‐EVs. G,H) Fluorescence images and cellular uptake of different subtypes (M0, M1, and M2) macrophages treated with FA‐EVs. I,J) Flowcytometric assays of siRNA@FA‐EVs uptake by different subtypes of macrophages. Data are presented as mean ± SD. *p < 0.05 compared to the M0 group, **p < 0.05 compared to the M2 group, n = 6.
Figure 3
Figure 3
A) The synthesis process of GS hydrogel. B) The scheme of the lap‐shear experiment. C,D) Force‐strain curve and adhesive strength of hydrogels. E,F) Graphics indicated the 180° peeling test experiment and the peel energy of GelMA hydrogel with different contents of SM component; G) Compression properties of hydrogels; H, I) The maximum stress and strain of GelMA/SM (0, 1, 5, 10%). J) The rheological properties of GelMA/SM (0, 1, 5, 10%). G’: Storage modulus, G”: loss modulus. K) Integration of two broken hydrogel pieces after mutual interaction. L, M) Water absorption and retention of these hydrogels. N) FTIR spectrum of GS hydrogel. O) Visual experiment for the bio‐adhesion property of GS hydrogel. P, Q) Hydrogel formation and SEM images of GS and siRNA@FA‐EVs/GS hydrogel. R, S, T) The porosity, EVs release, and injectability of siRNA@FA‐EVs/GS hydrogel into the uterine cavity. U) The sustained release curve of siRNA@FA‐EVs from hydrogel. N) Probable adhesive mechanism of the hydrogel to different substrates. Data are presented as mean ± SD. *p < 0.05 compared to the GelMA/SM‐0% group, **p < 0.05 compared to the GelMA/SM‐1% group, ***p < 0.05 compared to the GelMA/SM‐10% group, n = 3.
Figure 4
Figure 4
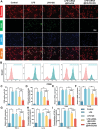
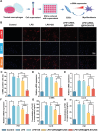
A,B) Immunofluorescence staining and flow cytometric assays for M1 macrophage polarization in diverse microenvironments. C, D) The percentage of CD86‐positive cells was calculated through immunofluorescence and flow cytometry. E, F, G) The mRNA expression of CD86, IL‐1β, and TNF‐α was detected by RT‐PCR in different groups. H, I) The concentrations of IL‐1β and TNF‐α in cell supernatant were measured by ELISA. Data are presented as mean ± SD. *p < 0.05 compared to the control group, **p < 0.05 compared to the LPS+GS group, ***p < 0.05 compared to the LPS+siRNA@EVs/GS group, n = 6.
Figure 5
Figure 5
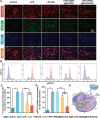
A,B) The phosphorylation level of STAT1 assessed by fluorescence microscopy and flow cytometric assays. C) The fluorescence intensity ratio of pSTAT1 in the nucleus of macrophages. D) The percentage of pSTAT1‐positive macrophages was detected by flow cytometry. E) Schematic representation of siRNA@FA‐EVs/GS inhibited M1 macrophage polarization by inhibiting STAT1 phosphorylation. Data are presented as mean ± SD. *p < 0.05 compared to the control group, **p < 0.05 compared to the LPS+GS group, ***p < 0.05 compared to the LPS+siRNA@EVs/GS group, n = 6.
Figure 6
Figure 6
A) The schematic diagram of crosstalk between treated macrophages and ESCs. B,C) The percentage of α‐SMA positive cells evaluated by immunofluorescence staining in each group. D–F) The mRNA expression of α‐SMA, Col III, and FN1 was detected by RT‐PCR in different groups. G,H) The concentrations of Col III and FN1 in cell supernatant were measured by ELISA. Data are presented as mean ± SD. *p < 0.05 compared to the control group, **p < 0.05 compared to the LPS+GS group, ***p < 0.05 compared to the LPS+siRNA@EVs/GS group, n = 6.
Figure 7
Figure 7
A) The gross observation of IUA sections after 28 days of surgery. B,C) Glands number and Endometrial thicknesses in each group. D) Representative images of H&E of rat uteri sections at 28 days postoperatively. E,F) Masson staining images and adhesion area were calculated. G, H) Immunohistochemical and immunofluorescence staining for Col III, FN1, and α‐SMA in IUA tissues. I) mRNA expression of Col III, FN1, and α‐SMA was recorded by RT‐PCR. J) The release of Col III and FN1 was evaluated by ELISA on the postoperative 28th day. Data are presented as mean ± SD. *p < 0.05 compared with IUA; **p < 0.05 compared with IUA+GS group. ***p < 0.05 compared to the IUA+siRNA@EVs/GS group, n = 6.
Figure 8
Figure 8
A,B) Immunohistochemical staining of ER and PR in regenerated endometrium. C,D) The semi‐quantitative analysis of ER and PR protein expression. E,F) mRNA expression of ER and PR was detected by RT‐PCR. G‐I‐) The pregnant uterus and SD rat fetuses in different groups. J,K) The conception time and pregnancy rate of SD rats with different treatments. L) The number of fetuses. M,N) Photographic images of newborn rats and after feeding 14 days. O, P) The fetal weight on the first day and 14th day. Data are presented as mean ± SD. *p < 0.05 compared with IUA; **p < 0.05 compared with IUA+GS; ***p < 0.05 compared with IUA+siRNA@EVs/GS group, ns, no significance between two groups, n = 6.
Figure 9
Figure 9
A) The gross observation of injury sites after 3 days of surgery. B) Representative images of H&E of injury sites at 3 days postoperatively. C) The immunofluorescence staining for CD86/CD68 in IUA tissues. D) The percentage of CD86/CD68 positive cells evaluated by immunofluorescence staining in each group. E–G) The mRNA expression of CD86, IL‐1β, and TNF‐α was recorded by RT‐PCR. H, I) The release of IL‐1β and TNF‐α was evaluated by ELISA on the postoperative 28th day. Data are presented as mean ± SD. *p < 0.05 compared with IUA+GS; **p < 0.05 compared with IUA+siRNA@EVs/GS group, ns, no significance between two groups, n = 6.
Figure 10
Figure 10
A,B) Heatmap and volcano plots of DEGs. C) GSEA analysis was applied to perform function annotation. D) The normalized count values of the STAT1, IL‐1β, and TNF‐α E) The protein bands of pSTAT1 and CD86. F) The immunofluorescence images of pSTAT1/CD86 in IUA tissues. G) The percentage of pSTAT1/CD86 positive cells evaluated by immunofluorescence staining in each group. H, I) The protein expression of pSTAT1 and CD86 was detected. Data are presented as mean ± SD. *p < 0.05 compared with IUA+GS; **p < 0.05 compared with IUA+siRNA@EVs/GS group, ns, no significance between two groups, n = 6.

Similar articles

Cited by

References

    1. a) Peng X., Zhu Y., Wang T., Wang S., Sun J., Aging 2023, 15, 8275; - PMC - PubMed
    2. b) Wu F., Lei N., Yang S., Zhou J., Chen M., Chen C., Qiu L., Guo R., Li Y., Chang L., Front. Bioeng. Biotechnol. 2023, 11, 1264006; - PMC - PubMed
    3. c) Kou L., Jiang X., Xiao S., Zhao Y. Z., Yao Q., Chen R., J. Control. Rel. 2020, 318, 25. - PubMed
    1. a) Leung R. K., Lin Y., Liu Y., Reprod. Sci. 2021, 28, 1812; - PMC - PubMed
    2. b) Ang C. J., Skokan T. D., McKinley K. L., Annu. Rev. Cell Dev. Biol. 2023, 39, 197. - PMC - PubMed
    1. Yi X., Liu F., Gao K., Chen F., Wang Y., Li H., Wang X., Huang Y., Fu H., Zhou W., Fan J. B., Wang S., Gao Y., Adv. Mater. 2022, 34, 2106510. - PubMed
    1. a) Li C., Cai A., Sun C., Wu B., Chen X., Mao Y., Zhang Y., Gou Y., Yu J., Wang Y., Yu H., Wang J., Genes Dis. 2020, 7, 266; - PMC - PubMed
    2. b) Yu D., Wong Y. M., Cheong Y., Xia E., Li T. C., Fertil. Steril. 2008, 89, 759. - PubMed
    1. Yu‐Hung L., Tsrang‐Neng J., Jiann‐Loung H., Lee‐Wen H., Kok‐Min S., Bih‐Chwen H., Chien‐Hsien H., Fertil. Steril. 2015, 103, 513. - PubMed

LinkOut - more resources