. 2024 Nov:109:105409.
doi: 10.1016/j.ebiom.2024.105409. Epub 2024 Oct 24.

Yellow fever disease severity and endothelial dysfunction are associated with elevated serum levels of viral NS1 protein and syndecan-1

Affiliations

Yellow fever disease severity and endothelial dysfunction are associated with elevated serum levels of viral NS1 protein and syndecan-1

Francielle T G de Sousa et al. EBioMedicine. 2024 Nov.

Abstract

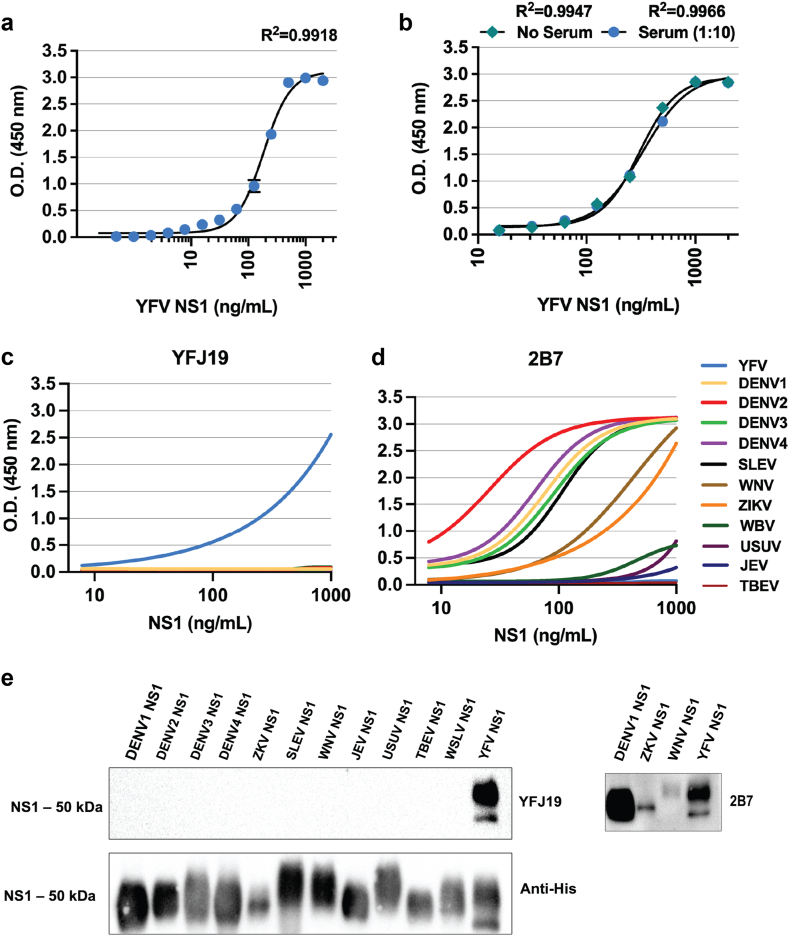
Background: Yellow fever virus (YFV) infections are a major global disease concern with high mortality in humans, and as such it is critical to identify clinical correlates of disease severity. While nonstructural protein 1 (NS1) of the related dengue virus is implicated in contributing to vascular leak, little is known about the role of YFV NS1 in severe YF and mechanisms of vascular dysfunction in YFV infections.

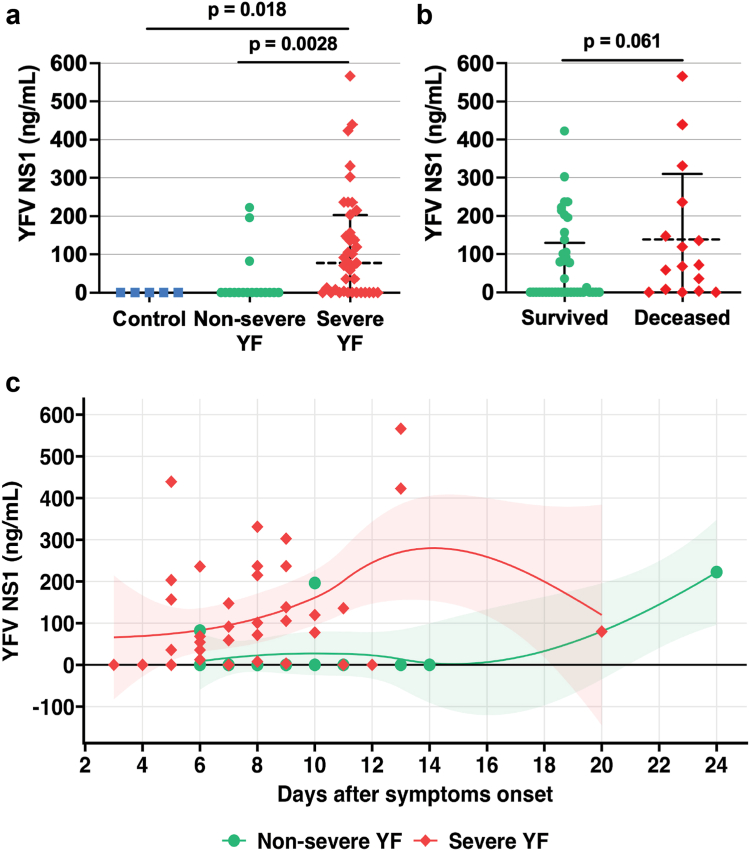
Methods: Using serum samples from laboratory-confirmed YF patients with severe (n = 39) or non-severe (n = 18) disease in a well-defined hospital observational cohort in Brazil, plus samples from healthy uninfected controls (n = 11), we investigated factors associated with disease severity and endothelial dysfunction.

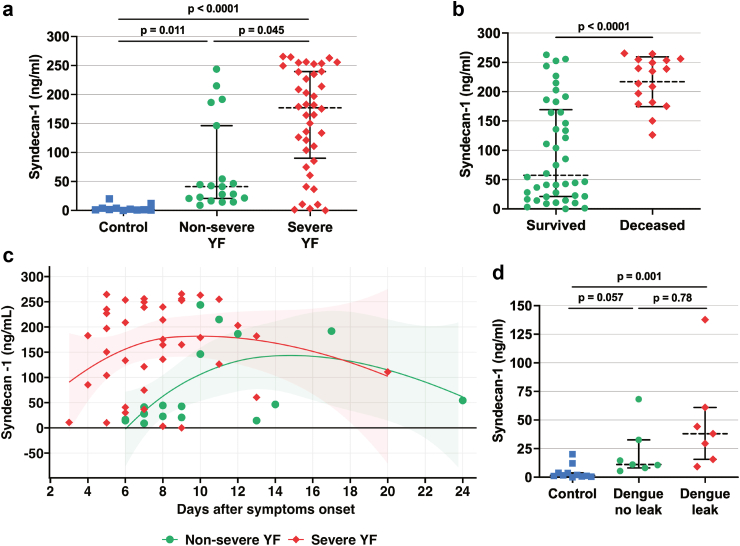
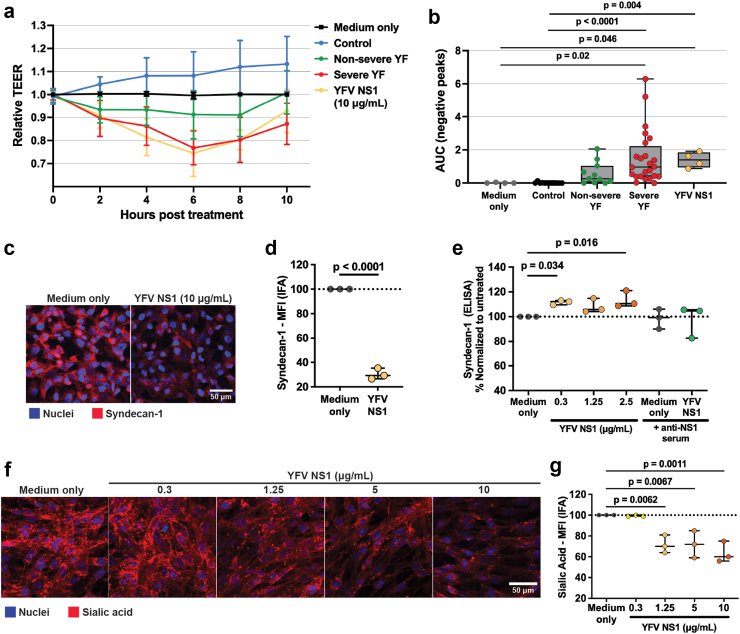
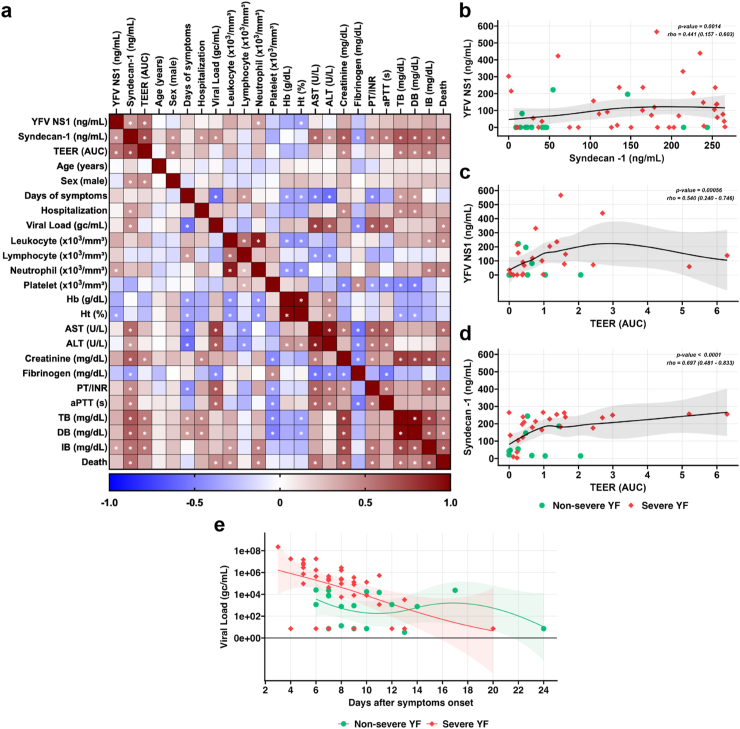
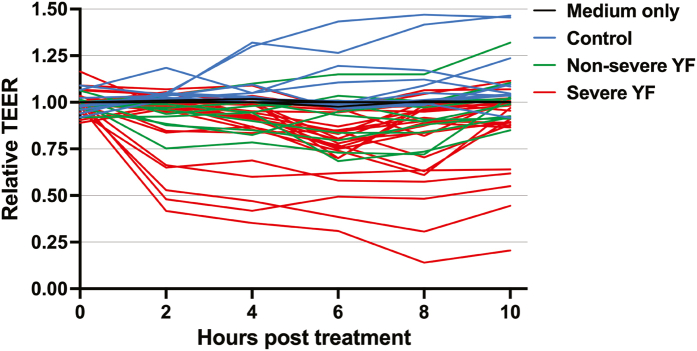
Findings: We found significantly increased levels of NS1, as well as syndecan-1, a marker of vascular leak, in serum from severe YF as compared to non-severe YF or control groups. We also showed that hyperpermeability of endothelial cell monolayers treated with serum from severe YF patients was significantly higher compared to non-severe YF and control groups, as measured by transendothelial electrical resistance (TEER). Further, we demonstrated that YFV NS1 induces shedding of syndecan-1 from the surface of human endothelial cells. Notably, YFV NS1 serum levels significantly correlated with syndecan-1 serum levels, TEER values, and signs of disease severity. Syndecan-1 levels also significantly correlated with clinical laboratory parameters of disease severity, viral load, hospitalization, and death.

Interpretation: This study provides further evidence for endothelial dysfunction as a mechanism of YF pathogenesis in humans and suggests serum quantification of YFV NS1 and syndecan-1 as valuable tools for disease diagnosis and/or prognosis.

Funding: This work was supported by the US NIH and FAPESP.

Keywords: Endothelial dysfunction; NS1; Pathogenesis; Syndecan-1; Yellow fever.


Conflict of interest statement

Declaration of interests The authors declare no conflict of interests.

Figures

Fig. 1
Fig. 1
Development of quantitative YFV NS1 ELISA. (a) Sigmoidal standard curve of YFV NS1 capture ELISA performed with in-house-produced YFJ19 mAb and thirteen different concentrations of recombinant YFV NS1. The graph depicts mean absorbance values ± standard deviation (SD). (b) Comparison of standard curve of YFV NS1 diluted or not in normal human serum (1:10). The graph depicts mean absorbance values ± SD. (c) Specificity of mAb YFJ19 by direct ELISA performed with NS1 (5 μg/mL) from 12 different flaviviruses as follows: YFV; dengue virus serotypes 1 (DENV1), 2 (DENV2), 3 (DENV2), and 4 (DENV4); Saint Louis encephalitis virus (SLEV); West Nile virus (WNV); Zika virus (ZIKV); Wesselsbron virus (WBV); Usutu virus (USUV); Japanese encephalitis virus (JEV); Tick-borne encephalitis virus (TBEV). (d) Cross-reactivity of anti-flavivirus NS1 mAb (2B7) by direct ELISA performed with NS1 (5 μg/mL) from the 12 different flaviviruses as in c. (e) Western blot analysis showing specificity of mAb YFJ19 for YFV NS1 and cross-reactivity of mAb 2B7.
Fig. 2
Fig. 2
YFV NS1 serum levels in severe and non-severe YF patients. (a) YFV NS1 levels were determined using an in-house sandwich ELISA, as described in Materials and Methods. Studied individuals were classified in three different groups as described in Materials and Methods: Severe YF (n = 39); Non-severe YF (n = 17, missing data for 1 sample); Controls, healthy individuals (n = 5, missing data for 6 samples). Groups were compared by Kruskal–Wallis + Dunn’s multiple comparisons test. (b) YFV NS1 levels in survivors and deceased YFV-infected groups. Groups were compared by Mann–Whitney test. The dashed lines indicate the median of the data, and the error bars represent the interquartile range (IQR) in a and b. (c) YFV NS1 serum levels in individuals with acute YF according to days since symptom onset, visualized using LOESS curves with 95% confidence intervals (shaded areas). Acute disease was defined by detection of viral RNA by RT-qPCR in serum. Samples were run in duplicate.
Fig. 3
Fig. 3
Syndecan-1 levels in sera of individuals with acute YF and dengue. (a) Syndecan-1 levels in sera were determined by the human syndecan-1 ELISA Kit. Studied individuals were classified in three different groups as described in Materials and Methods: Severe YF (n = 39); Non-severe YF (n = 18); Controls (n = 11): healthy individuals. Groups were compared by Kruskal–Wallis + Dunn’s multiple comparisons test. (b) Syndecan-1 serum levels in survivors and deceased individuals from the YFV-infected groups, compared by Mann Whitney test. (c) Syndecan-1 serum levels in individuals with acute YF according to days since symptom onset, visualized using LOESS curves with 95% confidence intervals (shaded areas). (d) Syndecan-1 serum levels in individuals with acute DENV infection. Dengue no leak (n = 7): individuals with acute dengue who did not display plasma leakage; Dengue leak (n = 7): individuals with acute dengue who displayed plasma leakage; Controls (n = 11): same healthy individuals as shown in panel A. Soluble syndecan-1 levels in dengue groups were compared by Kruskal–Wallis + Dunn’s multiple comparisons test. The dashed lines indicate the median of the data, and the error bars represent the interquartile range (IQR) in a, b, and d. Acute disease was defined by detection of viral RNA by RT-qPCR in serum. Samples were run in duplicate.
Fig. 4
Fig. 4
Relative TEER of human endothelial cells treated with acute YF human serum samples and effects of YFV NS1 treatment on endothelial glycocalyx. (a) Confluent monolayers of human endothelial cells cultured in Transwell inserts were treated or not with 10% serum from three different groups: Severe YF (n = 24, missing data for 15 samples); Non-severe YF (n = 10, missing data for 8 samples); Controls (n = 11): healthy individuals. YFV NS1 (10 μg/mL) was used as positive control. The transendothelial electrical resistance (TEER) was measured from 2 to 10 h post-treatment. Graph shows mean ± SD of relative TEER for each treatment group. (b) Area under the curve (AUC) of negative peaks for the effects of the different treatments on TEER. AUC values represent the sum of the trapezoidal areas (taking into account only the negative peaks) under the curve formed by the data points. Median values of AUC for each group were compared using Kruskal–Wallis’ test. Error bars represent interquartile range (IQR). Outliers were defined according to Tukey’s method, which identifies outliers using the interquartile range (IQR; i.e., the difference between the first and third quartiles [Q3 - Q1]) as any data point below the first quartile (25th percentile) minus 1.5 times the IQR (Q1 - 1.5∗IQR) or above the third quartile (75th percentile) plus 1.5 times the IQR (Q3 + 1.5∗IQR). (c, d) Human endothelial cell monolayers grown on gelatin-coated coverslips were treated with medium only or 10 μg/mL of YFV NS1 for 3 h. After fixation, cell surface syndecan-1 was stained in red and nuclei in blue (Hoechst). (c) Representative figures of cell monolayers stained for syndecan-1 in red and nuclei in blue. (d) Quantification of syndecan-1 protein on the cells surface expressed as mean fluorescence intensity (MFI). NS1 treatment was compared to medium-only treatment by unpaired t-test. Error bars present SD of the mean. (e, f, g) Human endothelial cell monolayers grown on gelatin-coated coverslips were treated with medium only or with different concentrations of YFV NS1 for 6 h. (e) Quantification of syndecan-1 in cell supernatants by ELISA. An in-house-produced mouse anti-YFV NS1 polyserum with or without 2.5 μg/mL of YFV NS1 was used as a control. Treatments were compared with medium-only treatment by one-way ANOVA + Dunnett’s test. Error bars present SD of the mean. (f) Representative figures of cell monolayers stained for sialic acid in red and nuclei in blue. (g) Quantification of sialic acid on the cell surface expressed as MFI. NS1 treatments were compared to medium-only treatment by one-way ANOVA + Dunnett’s multiple comparison test. Error bars present SD of the mean. Significant p-values are shown in the graphs. Acute YF disease was defined by detection of viral RNA by RT-qPCR in serum. Samples were run in duplicate for the TEER assays. IFA and ELISA data are the results of three independent experiments (n = 3).
Fig. 5
Fig. 5
Correlation analysis of clinical and laboratory data of study participants during acute YF and viral load according to days of symptoms. (a) Correlation matrix analyzed by Spearman rank correlation. Asterisks indicate significant correlations (p < 0.05, Spearman r > 0.35). Categorical variables (e.g., sex [male] and death) were entered as coded variables. (b) Correlation between serum levels of YFV NS1 and syndecan-1. (c) Correlation between serum levels of YFV NS1 and TEER AUC values. (d) Correlation between serum levels of syndecan-1 and TEER AUC values. The gray shaded area represents the 95% confidence interval for the fitted LOESS curve in b, c, and d. Abbreviations: TEER, transendothelial electrical resistance; AUC, area under the curve; Hb, hemoglobin; Ht, hematocrit; AST, aspartate transaminase; ALT, alanine aminotransferase; TPI/INR thrombin potential index/international normalized ratio; aPTT, activated partial thromboplastin time; TB, total bilirubin; DB, direct bilirubin; IB, indirect bilirubin. (e) Viral load of YF patients from severe and non-severe cases. Viral load, determined in YF patients serum at the time of admission by RT-qPCR, is expressed as genomic copies per mL. Results were plotted according to days since symptom onset reported at the time of hospital admission. Acute disease was defined by detection of viral RNA by RT-qPCR in serum.
Supplementary Fig. S1
Fig. S1. Comparison of standard curve of a capture YFV NS1 ELISA performed with different monoclonal antibodies combinations. Standard curves of capture ELISA performed with different combinations of anti-YFV NS1 monoclonal antibodies for capture and biotinylated (Bio) antibodies for detection. Eight different concentrations (5000 to 39.06 ng/mL) of recombinant YFV NS1 were quantified showing that YFJ19 + bioYFJ19 was the best combination with higher signal.
Supplementary Fig. S2
Fig. S2. Full-length blot image for Figure 1e. Western blot analysis showing specificity of mAb YFJ19 for YFV NS1 and cross-reactivity of mAb 2B7 with different flaviviruses.
Supplementary Fig. S3
Fig. S3. Relative TEER of human endothelial cells treated with acute YF human samples. Confluent monolayers of human endothelial cells cultured in Transwell inserts were treated or not with 10% serum from three different groups: 1) Severe YF (n = 24); Non severe YF (n = 10); Control (n = 11): healthy individuals. The transendothelial electrical resistance (TEER) was measured from 2 to 10h post-treatment. Graph shows data for each tested sample separately.

Update of

References

    1. Kraemer M.U., Faria N.R., Reiner R.C., et al. Spread of yellow fever virus outbreak in Angola and the Democratic Republic of the Congo 2015–16: a modelling study. Lancet Infect Dis. 2017;17:330–338. - PMC - PubMed
    1. Kallas E.G., D'Elia Zanella L.G.F.A.B., Moreira C.H.V., et al. Predictors of mortality in patients with yellow fever: an observational cohort study. Lancet Infect Dis. 2019;19:750–758. - PubMed
    1. Gardner C.L., Ryman K.D. Yellow fever: a reemerging threat. Clin Lab Med. 2010;30:237–260. - PMC - PubMed
    1. Glasner D.R., Puerta-Guardo H., Beatty P.R., Harris E. The good, the bad, and the shocking: the multiple roles of dengue virus nonstructural protein 1 in protection and pathogenesis. Annu. Rev. Virol. 2018;5:227–253. - PMC - PubMed
    1. Libraty D.H., Young P.R., Pickering D., et al. High circulating levels of the dengue virus nonstructural protein NS1 early in dengue illness correlate with the development of dengue hemorrhagic fever. J Infect Dis. 2002;186:1165–1168. - PubMed