. 2024 Oct 31;187(22):6393-6410.e16.
doi: 10.1016/j.cell.2024.09.044. Epub 2024 Oct 24.

Method of moments framework for differential expression analysis of single-cell RNA sequencing data

Affiliations

Method of moments framework for differential expression analysis of single-cell RNA sequencing data

Min Cheol Kim et al. Cell. .

Abstract

Differential expression analysis of single-cell RNA sequencing (scRNA-seq) data is central for characterizing how experimental factors affect the distribution of gene expression. However, distinguishing between biological and technical sources of cell-cell variability and assessing the statistical significance of quantitative comparisons between cell groups remain challenging. We introduce Memento, a tool for robust and efficient differential analysis of mean expression, variability, and gene correlation from scRNA-seq data, scalable to millions of cells and thousands of samples. We applied Memento to 70,000 tracheal epithelial cells to identify interferon-responsive genes, 160,000 CRISPR-Cas9 perturbed T cells to reconstruct gene-regulatory networks, 1.2 million peripheral blood mononuclear cells (PBMCs) to map cell-type-specific quantitative trait loci (QTLs), and the 50-million-cell CELLxGENE Discover corpus to compare arbitrary cell groups. In all cases, Memento identified more significant and reproducible differences in mean expression compared with existing methods. It also identified differences in variability and gene correlation that suggest distinct transcriptional regulation mechanisms imparted by perturbations.

Keywords: Bootstrap method; CD4 T cells; CELLxGENE Discover; Differential expression; Gene expression variance; Gene-regulatory networks; Memento; Single-cell transcriptomics; Spatial genomics; scRNA-seq analysis.


Conflict of interest statement

Declaration of interests C.J.Y. is founder for and holds equity in DropPrint Genomics (now ImmunAI) and Survey Genomics; a Scientific Advisory Board member for and holds equity in Related Sciences and ImmunAI; and a consultant for and holds equity in Maze Therapeutics. C.J.Y. has received research support from the Chan Zuckerberg Initiative, Chan Zuckerberg Biohub, Arc Institute, Parker Institute for Cancer Immunotherapy, Genentech, BioLegend, ScaleBio, and Illumina. A.M. is a co-founder of Site Tx, Arsenal Biosciences, Spotlight Therapeutics, and Survey Genomics; serves on the boards of directors of Site Tx, Spotlight Therapeutics, and Survey Genomics; and is a member of the scientific advisory boards of Site Tx, Arsenal Biosciences, Cellanome, Spotlight Therapeutics, Survey Genomics, NewLimit, Amgen, and Tenaya. A.M. owns stock in Arsenal Biosciences, Site Tx, Cellanome, Spotlight Therapeutics, NewLimit, Survey Genomics, Tenaya, and Lightcast and has received fees from Site Tx, Arsenal Biosciences, Cellanome, Spotlight Therapeutics, NewLimit, Gilead, Pfizer, 23andMe, PACT Pharma, Juno Therapeutics, Tenaya, Lightcast, Trizell, Vertex, Merck, Amgen, Genentech, GLG, ClearView Healthcare, AlphaSights, Rupert Case Management, Bernstein, and ALDA. A.M. is an investor in and informal advisor to Offline Ventures and a client of EPIQ. The Marson laboratory has received research support from the Parker Institute for Cancer Immunotherapy, the Emerson Collective, Arc Institute, Juno Therapeutics, Epinomics, Sanofi, GlaxoSmithKline, Gilead, and Anthem and reagents from Genscript and Illumina.

Figures
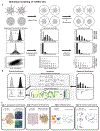
Figure 1:
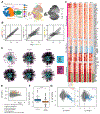
Figure 1:. memento workflow for differential mean, variability, and gene correlation testing.
(A) Experimental workflow for single-cell RNA-sequencing (scRNA-seq) samples RNA transcripts inside each cell during library preparation and sequencing. After scRNA-seq sampling, patterns of mean, variability, and correlation of gene expression in the observed transcript counts no longer resemble the actual distribution. (B) memento models scRNA-seq as a hypergeometric sampling process, estimates expression distribution parameters (mean, residual variance, and correlation) using method of moments estimators, implements efficient bootstrapping for estimating confidence intervals, and tests for differences in expression parameters between two groups of cells. (C) Four applications of memento to characterize the response of ~70k human tracheal epithelial cells to extracellular cytokines, reconstruct gene regulatory networks from ~170k human CD4+ T cells perturbed by CRISPR-Cas9, map the genetic determinants of gene expression in 1.2M peripheral blood mononuclear cells (PBMCs) from 162 Systemic Lupus Erythematosus (SLE) patients and 99 healthy controls, and comparisons of arbitrary groups of cells within the CELLxGENE Discover data corpus.
Figure 2:
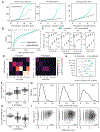
Figure 2:. Performance of memento in simulation and on real data.
(A) Lin’s concordance of estimates of mean using 10 cells (left), variability using 100 cells (middle), and gene correlation using 100 cells (right) with simulated ground truth values (y-axis) for a range of overall transcript capture efficiencies (x-axis). (B) Pearson correlation of memento estimates from DropSeq data versus smFISH estimates of the same population of melanoma cells (y-axis) for mean (left), variability (middle), and gene correlation (right) across different numbers of DropSeq cells used (x-axis). (C) Power (y-axis) vs False Discovery Rate (FDR) (x-axis) comparing existing methods with memento for DM (left), DV (middle), and DC (right) analyses. (D) Concordance AUC (x-axis) of single-cell DM analysis (green) compared to pseuobulk DM analysis (red) using datasets in [19] (left) and [17]. (E) Runtime (y-axis) of three methods across number of cells (x-axis) for DM and DV analyses.
Figure 3:
Figure 3:. Mapping transcriptional response of human trachial epithelial cells (HTEC) to extracellular interferon using memento.
(A) UMAPs of the entire HTEC dataset colored by identified cell types (left), zoomed in ciliated cells colored by stimulation (center), and time labels (right). (B) Log fold-change (LFC) of mean expression in response to IFN-α (x-axis) against LFC in response to IFN-β (left), IFN-γ (middle), and IFN-λ (right) after 6 hours. (C) Hierarchically clustered heatmaps of LFC in response to the four types of interferons (columns within each heatmap) across 5 timepoints. Type-1- (green) and type-2-specific (blue) responses are highlighted. (D) Gene coexpression network over time where cyan nodes depict canonical ISGs and magenta nodes depict noncanonical ISGs. Pairs of genes with high correlation (memento >0.6) are connected. (E) Baseline expression variability (y-axis) versus mean (x-axis) in ciliated cells. (F) Tonic sensitivity (y-axis) for canonical and non-canonical ISGs (x-axis). *** indicates P<0.001. (G) Change in variability (y-axis) versus the change in the mean (x-axis) in response to IFN-β (left) and IFN-γ (right). Blue dots represent canonical ISGs.
Figure 4:
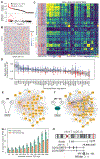
Figure 4:. Reconstructing gene regulatory networks of T cell activation using Perturb-seq and memento.
(A) Selection criteria for perturbed regulators in this study, based on expression (top) and binding site enrichment (bottom). (B) Heatmap of average gene expression for each gene (row) across cells perturbed by the corresponding sgRNA (columns). (C) Left: Heatmap of average gene expression for DMGs (row) across cells perturbed by each sgRNA (columns). Right: Gene-gene correlation matrix for the same DMGs estimated from WT cells. (D) Correlation between each regulator and its downstream targets in WT cells. (E) Bipartite gene regulatory network that do not account for interactions between regulators constructed from DM analysis of Perturb-Seq data. (F) Gene regulatory network including genetic interactions between regulators constructed utilizing both DM and DC analysis. (G) Number of genes with binding sites for pairs of interacting or non-interacting regulators across varying windows around the TSS. (H) Chromosomal location of LGALS3BP and binding sites for IRF1 and PRDM1, predicted to interact using DM and DC analysis.
Figure 5:
Figure 5:. Mapping of mean QTL (eQTL), variability QTL (vQTL), and correlation QTL (cQTL) using memento
(A) Quantile-quantile (QQ) plots for expected p-values (y-axis) computed by memento versus theoretical p-values (x-axis) for eQTLs, vQTLs, and cQTLs. For eQTLs, QQ-plot of p-values from pseudobulk approach (Matrix eQTL) is overlayed. (B) Receiver operating characteristic (ROC) curves for recovery of eQTLs identified from a much larger cohort (OneK1K) for memento and pseudobulk-based Matrix eQTL. (C) Power of eQTL recovery (y-axis) of memento and Matrix eQTL across different numbers of individuals. Analyses were performed on CD4+ T cells (T4), B cells (B), classical monocytes (cMs) and natural killer cells (NKs). (D) Enrichment of cell-type specific eQTLs in cell-type specific ATAC-peaks. Each entry represents the enrichment for eQTLs detected in one cell type (column) in ATAC-peaks detected in another cell type (row). Intensity is −log10 (p-value). (E) Enrichment of eQTLs detected in each cell type for cell-type-specific ATAC-peaks detected in the same cell type. (F) An example of a vQTL. Expression variability (y-axis) for each individual of varying genotypes at chr6:31326612. (G) Histogram showing distribution of HLA-C expression for a representative individual of each genotype. (H) An example of a cQTL. JUNB-LYZ gene correlation (y-axis) for individuals of varying genotypes at chr12:69688073. (I) Scatterplot of expression of LYZ (y-axis) against the expression of JUNB (x-axis) across single cells from all donors (grey) and a representative individual (black).
Figure 6:
Figure 6:. Extending memento for near real-time differential expression analysis within CZI CELLxGENE Discover.
(A) UMAP of the SLE PBMC dataset within CELLxGENE. (B) Enumeration of different comparisons that can be made within and between groups of cells. Comparisons of significance (P-value) between the precomputed and full modes for (C) differential mean and (D) differential variability analyses. (D) Runtime as a function of number of comparisons made, at query time (excluding precomputation). (F) Schematic of multiple datasets analyzed with CELLxGENE identifying DMGs between pDCs and cDCs. (G) QQ-plot of P-values from comparing pDCs and cDCs combining many datasets (cyan) and using each dataset alone (grey).

References

    1. McAdams HH and Arkin A (1997). “Stochastic mechanisms in gene expression”. en. Proc. Natl. Acad. Sci. U. S. A 94.3, pp. 814–819. - PMC - PubMed
    1. Raj A and van Oudenaarden A (2008). “Nature, nurture, or chance: stochastic gene expression and its consequences”. en. Cell 135.2, pp. 216–226. - PMC - PubMed
    1. Guo J and Zhou X (2015). Regulatory T cells turn pathogenic. - PMC - PubMed
    1. Newman JRS, Ghaemmaghami S, Ihmels J, Breslow DK, Noble M, DeRisi JL, and Weissman JS (2006). “Single-cell proteomic analysis of S. cerevisiae reveals the architecture of biological noise”. en. Nature 441.7095, pp. 840–846. - PubMed
    1. Raj A, Rifkin SA, Andersen E, and Van Oudenaarden A (2010). “Variability in gene expression underlies incomplete penetrance”. Nature 463.7283, pp. 913–918. - PMC - PubMed

LinkOut - more resources