. 2024 Nov 5;36(11):2419-2436.e8.
doi: 10.1016/j.cmet.2024.09.014. Epub 2024 Oct 24.

Metabolic regulation of the glioblastoma stem cell epitranscriptome by malate dehydrogenase 2

Affiliations

Metabolic regulation of the glioblastoma stem cell epitranscriptome by malate dehydrogenase 2

Deguan Lv et al. Cell Metab. .

Abstract

Tumors reprogram their metabolism to generate complex neoplastic ecosystems. Here, we demonstrate that glioblastoma (GBM) stem cells (GSCs) display elevated activity of the malate-aspartate shuttle (MAS) and expression of malate dehydrogenase 2 (MDH2). Genetic and pharmacologic targeting of MDH2 attenuated GSC proliferation, self-renewal, and in vivo tumor growth, partially rescued by aspartate. Targeting MDH2 induced accumulation of alpha-ketoglutarate (αKG), a critical co-factor for dioxygenases, including the N6-methyladenosine (m6A) RNA demethylase AlkB homolog 5, RNA demethylase (ALKBH5). Forced expression of MDH2 increased m6A levels and inhibited ALKBH5 activity, both rescued by αKG supplementation. Reciprocally, targeting MDH2 reduced global m6A levels with platelet-derived growth factor receptor-β (PDGFRβ) as a regulated transcript. Pharmacological inhibition of MDH2 in GSCs augmented efficacy of dasatinib, an orally bioavailable multi-kinase inhibitor, including PDGFRβ. Collectively, stem-like tumor cells reprogram their metabolism to induce changes in their epitranscriptomes and reveal possible therapeutic paradigms.

Keywords: ALKBH5; MDH2; PDGFRβ; alpha-ketoglutarate; cancer stem cell; epitranscriptomics; glioblastoma; m6A; malate-aspartate shuttle; metabolism.


Conflict of interest statement

Declaration of interests The authors declare no competing interests.

Figures

Figure 1.
Figure 1.. Glioblastoma stem cells display distinct steady state metabolic profiles.
(A) Schema of the experimental design of steady state metabolic profiling in matched GSC/DGC pairs. (B) Heatmap of metabolite enrichment between 387 and 3565 GSCs and matched DGCs. (C) Volcano plot of differential metabolites detected by LC-MS in two CD133-positive GSCs and paired CD133-negative DGCs. Red dots indicate metabolites enriched in GSCs and blue dots indicate metabolites enriched in DGCs. (D) Pathway impact analysis and identification of the most relevant metabolic pathways based on metabolite enrichment. (E) Venn Diagram of enriched metabolites in 387 and 3565 GSCs, with an overlap of 107 metabolites in common. (F) Malate levels in 387 and 3565 GSCs and paired DGCs, as measured by LC-MS. Multiple unpaired t-tests, mean + SD, n=4 biological replicates. **p<0.01, ****p<0.0001 (G) Integrated analysis of gene expression and metabolite abundance in GSCs. (H) Hierarchical clustering of malate-aspartate shuttle member genes between GSCs and DGCs. (I) H3K27ac signal peaks in enhancer and promoter regions of malate-aspartate shuttle genes in GSCs and DGCs from GSC4 and GSC6 xenografts. (J) Violin plots depicting MDH2 expression in various molecular sub-groups of GSCs compared with NSCs, derived from RNA-seq data (Pro: proneural; Cla: classical; Mes: mesenchymal; NSC: neural stem cell). *p<0.05. (K) Violin plots depicting GLAST expression in various molecular sub-groups of GSCs compared with NSCs, derived from RNA-seq data. *p<0.05. See also Figure S1.
Figure 2.
Figure 2.. MDH2 regulates the viability and stemness of GSCs.
(A) Representative immunoblot showing MDH2, SOX2, OLIG2, and GFAP protein levels in matched GSC/DGC pairs of 387 and 738. (B) Densitometry graphs showing the protein levels of MDH2, SOX2, OLIG2, and GFAP in matched GSC/DGC pairs of 387 and 738. Two-tailed unpaired t-tests, mean + SD, n=3 biological replicates. (C) Cell viability of 387 GSCs following transduction with either shCONT, shGLAST, or MDH2 at different time points (1, 3, and 5 days). Two-way ANOVA with Dunnett’s post-hoc correction, mean ± SD, n=8 biological replicates with 3 technical replicates. ****p<0.0001. (D) Cell viability of 738 GSCs following transduction with shCONT, shGLAST, or shMDH2 at different time points (1, 3, and 5 days). Two-way ANOVA with Dunnett’s post-hoc correction, mean ± SD, n=5 biological replicates with 3 technical replicates. ****p<0.0001. (E and F) Stem-cell frequency using an ELDA of GSCs transduced with non-targeting, MDH2-targeting, or GLAST-targeting shRNA. (G) Representative immunoblot showing MDH2 and OLIG2 protein levels after transduction of GSCs, with shCONT or shMDH2. (H) Densitometry graphs showing the quantification of MDH2 and OLIG2 protein levels upon MDH2 knockdown in 387 and 738 GSCs. Two-way ANOVA with Dunnett’s post-hoc correction, mean + SD, n=3 biological replicates. ****p<0.0001. (I) Quantification of Annexin V/PI staining for apoptosis of GSC 387 and DGC 387 cells, respectively, transduced with MDH2-targeting or non-targeting shRNAs. mean + SD, n=4 biological replicates. (J and K) Cell viability of GSCs following transduction with either a nontargeting control sgRNA (sgCONT) or one of two independent, nonoverlapping sgRNAs targeting MDH2 at different time points (1, 3, and 5 days). Two-way ANOVA with Dunnett’s post-hoc correction, mean ± SD, n=5 biological replicates with 3 technical replicates. ***p<0.001. (L and M) Sphere formation using an ELDA of GSCs transduced with either non-targeting or one of two independent, nonoverlapping sgRNAs targeting MDH2. See also Figure S2.
Figure 3.
Figure 3.. MDH2 depletion hinders TCA cycle and accumulates α-ketoglutarate in GSCs.
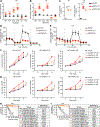
(A and B) Quantitative metabolomics analysis measuring various TCA cycle and anaplerotic metabolites in 387and 738 GSCs transduced with non-targeting or MDH2-targeting shRNA. Two-way ANOVA with Dunnett’s post-hoc correction, median and IQR, **p<0.01, ****p<0.0001, n=6 biological replicates with 2 technical replicates. (C) αKG concentration in 387 and 738 GSCs transduced with non-targeting or MDH2-targeting shRNAs. Two-way ANOVA with Dunnett’s post-hoc, median and IQR, n=4 biological replicates. ****p<0.0001. (D and E) Oxygen consumption rates of 387 and 738 GSCs expressing non-targeting or MDH2-targeting shRNAs. Mean ± SD, n=4 biological replicates with 3 technical replicates. (F and G) In vitro cell proliferation of GSCs transduced with shCONT or shMDH2 with indicated aspartate treatment. Two-way ANOVA with Dunnett’s post-hoc correction, mean ± SD, n=3 biological replicates with 3 technical replicates. **p<0.01, ****p<0.0001. (H and I) ELDA of 387 and 738 GSCs transduced with non-targeting or MDH2-targeting shRNAs and supplemented with indicated aspartate concentrations. See also Figure S2.
Figure 4.
Figure 4.. MDH2 depletion reduces RNA m6A methylation in GSCs.
(A) Correlation between MDH2 mRNA expression and MSigDB Molecular Function signatures in GSCs . (B) Correlation between MDH2 mRNA expression and MSigDB Biological Processes signatures in GSCs . (C) A schema of potential mechanisms underlying MDH2-deficient GSC phenotypes. MDH2 depletion in GSCs resulted in increased levels of α-ketoglutarate which promotes the 2-OG-dependent RNA demethylase activity. (D) Relative mRNA m6A levels in 387 and 738 GSCs transduced with non-targeting or MHD2-targeted shRNAs. Two-way ANOVA with Dunnett’s post-hoc, mean + SD, n=3 biological replicates. ****p<0.0001. (E) Measurement of mRNA m6A levels by LC-MS in 387 and 738 GSCs transduced with non-targeting or MHD2-targeted shRNAs. Two-way ANOVA with Dunnett’s post-hoc, mean + SD, n=4 biological replicates with 2 technical replicates. **p<0.01. (F) Relative mRNA m6A levels in 387 and 738 GSCs treated with different concentrations of dimethyl αKG. Two-way ANOVA with Dunnett’s post-hoc, mean + SD, n=3 biological replicates. ****p<0.0001. (G) Relative mRNA m6A levels in 387 and 738 GSCs treated either alone or in combination of dimethyl αKG (100 μM) and dimethyl fumarate (100 μM). Two-way ANOVA with Dunnett’s post-hoc, mean + SD, n=4 biological replicates. *p<0.05, **p<0.01, ****p<0.0001. (H) Measurement of mRNA m6A methylation levels by LC-MS in 387 and 738 GSCs treated either alone or in combination of dimethyl αKG (100 μM) and dimethyl fumarate (100 μM). Two-way ANOVA with Dunnett’s post-hoc, mean + SD, n=4 biological replicates with 2 technical replicates. **p<0.01. (I) Relative mRNA m6A levels in 387 and 738 GSCs transduced with control or MHD2 overexpression construct, in presence or absence of dimethyl αKG (100 μM) treatment. One-way ANOVA with Dunnett’s post-hoc correction, mean + SD, n=3 biological replicates. ****p<0.0001. (J) Immunoblots depicting MDH2, METTL3, ALKBH5, and FTO protein levels in 387 and 738 GSCs with MDH2 overexpression or dimethyl αKG (100 μM) treatment. (K) Relative ALKBH5 activity in 387 and 738 GSCs transduced with non-targeting or MHD2-targeted shRNAs, in presence or absence of dimethyl αKG treatment (100 μM) combined with or without ALKBH5 inhibitor (10 μM). One-way ANOVA with Dunnett’s post-hoc correction, mean + SD, n=3 biological replicates. ****p<0.0001. (L) Relative m6A levels in 387 and 738 GSCs transduced with control or MHD2 overexpression construct, in presence or absence of dimethyl αKG (100 μM). One-way ANOVA with Dunnett’s post-hoc correction, mean + SD, n=3 biological replicates. ***p<0.001, ****p<0.0001. (M) Relative m6A level in 387 and 738 GSCs transduced with non-targeting, MHD2-targeted and ALKBH5-targeted shRNAs. Two-way ANOVA with Dunnett’s post-hoc correction, mean + SD, n=3 biological replicates. ****p<0.0001. See also Figure S3.
Figure 5.
Figure 5.. MDH2 affects m6A methylation of GSC stemness associated factors.
(A) Global RNA m6A methylation signal profile across pseudogene regions in 387 GSCs transduced with MDH2-targeting or control shRNA vectors. (B) Volcano plot of differential m6A peaks detected by meRIP-seq in 387 GSCs, transduced with non-targeting or MHD2-targeted shRNAs. Red dots indicate m6A peaks gained upon MDH2 depletion, and blue dots indicate m6A peaks downregulated upon MDH2 depletion. Note that multiple peaks may map to the same gene. (C) Profile and heatmap of m6A meRIP-seq peaks differentially enriched in 387 GSCs transduced with MDH2-targeting or control shRNA vectors. (D) Gene ontology analysis of differential RNA m6A methylation peaks downregulated following MDH2 knockdown in 387 GSCs. (E) Gene ontology analysis of differential RNA m6A methylation peaks upregulated following MDH2 knockdown in 387 GSCs. (F) Relative PDGFRB m6A levels in 387 and 738 GSCs transduced with non-targeting or MHD2-targeted shRNAs. One-way ANOVA with Dunnett’s post-hoc correction, mean + SD, n=3 biological replicates. ****p<0.0001. (G) Relative PDGFRB RNA levels in 387 and 738 GSCs transduced with non-targeting or MHD2-targeted shRNAs. One-way ANOVA with Dunnett’s post-hoc correction, mean + SD, n=3 biological replicates with 3 technical replicates. ****p<0.0001. (H) Immunoblots depicting MDH2 and PDGFRB protein levels in 387 and 738 GSCs transduced with non-targeting or MHD2-targeted shRNAs. (I) Graphs showing changes in the mRNA levels of PDGFRB at different time points following actinomycin-D treatment in 387 and 738 GSCs transduced with non-targeting or MHD2-targeted shRNAs. Two-way ANOVA with Dunnett’s post-hoc correction, mean ± SD, n=3 biological replicates with 3 technical replicates. **p<0.01, ***p<0.001, ****p<0.0001. (J) Immunoblots depict PDGFRB protein levels in 387 and 738 GSCs transduced with non-targeting or MHD2-targeted shRNAs along with PDGFRB overexpression. (K) Relative cell numbers of 387 and 738 GSCs transduced with non-targeting or MDH2-targeting shRNA and PDGFRB overexpression. Two-way ANOVA with Dunnett’s post-hoc correction, mean ± SD, n=3 biological replicates with 3 technical replicates. ****p<0.0001. See also Figure S4.
Figure 6.
Figure 6.. MDH2 supports gene expression of important cancer-specific pathways in GSCs.
(A) Kaplan-Meier survival analysis of TCGA GBM HG-U133A patient cohorts stratified into high vs. low MDH2 mRNA expression. HR = 0.81 (0.68–0.98), log-rank p <0.05, Wilcoxon p <0.05. (B) Kaplan-Meier survival analysis of TCGA GBMLGG patient cohorts stratified into high vs. low MDH2 mRNA expression. HR = 0.38 (0.29–0.5), log-rank p <0.0001, Wilcoxon p <0.0001. (C) Volcano plot of gene expression changes in MDH2 depleted vs. control, obtained from 387 GSCs. Blue indicates genes downregulated in MDH2 knockdown at an FDR < 0.05 and log2 fold change < −1. Red indicates genes upregulated following MDH2 knockdown at an FDR < 0.05 and log2 fold change > 1. (D) GSEA of genes perturbed upon MDH2 depletion in 387 GSCs for a “glioma stem cell” signature. (E) GSEA of gene ontology (GO) pathways enriched or depleted following MDH2 knockdown in 387 GSCs. (F) Gene set enrichment analysis of genes downregulated following MDH2 knockdown in GSC 387. Enriched gene signatures are plotted with normalized enrichment score. (G) Gene set enrichment analysis of genes upregulated following MDH2 knockdown in GSC 387. Enriched gene signatures are plotted with normalized enrichment score. (H) GSEA of ELVIDEG gene sets using a pre-ranked gene list weighted by gene expression in MDH2 knockdown vs. control in 387 GSCs. (I) GSEA of Hallmark gene sets using a pre-ranked gene list weighted by gene expression in MDH2 knockdown vs. control in 387 GSCs. (J) GSEA of REACTOME gene sets using a pre-ranked gene list weighted by gene expression in MDH2 knockdown vs. control in 387 GSCs. (K) Kaplan–Meier survival curves of immunocompromised mice bearing intracranial 387 GSCs transduced with shCONT, shMDH2.217, or shMDH2.455. Log-rank p <0.0001, Wilcoxon p <0.001. (L) Kaplan–Meier survival curves of immunocompromised mice bearing intracranial 738 GSCs transduced with shCONT, shMDH2.217, or shMDH2.455. Log-rank p <0.0001, Wilcoxon p <0.001. See also Figure S5.
Figure 7.
Figure 7.. In vivo synergy of MDH2 inhibition and dasatinib treatment in glioblastoma xenograft models
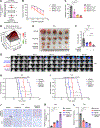
(A) Therapeutic efficacy prediction using expression-sensitivity correlations for dasatinib based on mRNA expression of MDH2. (B) In vitro viability assay of GSCs co-treated with indicated concentrations of LW6 and titrated concentrations of dasatinib. (C) Bar graph showing the IC50 concentration of dasatinib and titrated concentrations of LW6. (D) Synergy score analysis of GSCs treated with dasatinib and LW6. (E) Image of subcutaneous tumors in Dasatinib, Amb5965675 treatment or control groups. (F) Tumor mass (g) of 7E (One-way ANOVA with Dunnett’s post-hoc correction, mean + SD, n=5 mice each group. ***p<0.001, ****p<0.0001). (G) Representative In vivo bioluminescent images of immunocompromised NSG mice bearing IC xenografts derived from 387 GSCs at different time points in different treatment groups. Dasatinib (20 mg/kg), MDH2 inhibitor (20 mg/kg), their combination, and vehicle control were administered i.p. for 21 days daily after tumor formation. (H and I) Kaplan-Meier survival curves of tumor bearing mice from orthotopic intracranial xenograft implantation of 387 and 738 GSCs treated with vehicle, dasatinib, MDH2 inhibitor, or their combinatorial treatment. N=5 mice per experimental group. Log-rank p <0.0001, Wilcoxon p <0.0001. (J) Cleaved CASPASE-3 and KI67 immunostaining in intracranial tumors obtained from 738 GSCs, treated with dasatinib (20 mg/kg), MDH2 inhibitor (20 mg/kg), their combination, and vehicle control. (K) Fold change in cleaved CASPASE 3 levels in intracranial tumors obtained from 738 GSCs, treated with Dasatinib (20 mg/kg), MDH2 inhibitor (20 mg/kg), their combination, and vehicle control. One-way ANOVA with Dunnett’s post-hoc correction, mean + SD, n=5 mice per group. ****p<0.0001. (L) Fold change in Ki-67 levels in intracranial tumors obtained from 738 GSCs, treated with Dasatinib (20 mg/kg), MDH2 inhibitor (20 mg/kg), their combination, and vehicle control. One-way ANOVA with Dunnett’s post-hoc correction, mean + SD, n=5 mice per group. ****p<0.0001. See also Figures S6 and S7.

References

    1. Hegi ME, Diserens AC, Gorlia T, Hamou MF, de Tribolet N, Weller M, Kros JM, Hainfellner JA, Mason W, Mariani L, et al. (2005). MGMT gene silencing and benefit from temozolomide in glioblastoma. N.Engl.J.Med 352, 997–1003. 10.1056/NEJMoa043331. - DOI - PubMed
    1. Gatenby RA, and Gillies RJ (2004). Why do cancers have high aerobic glycolysis? Nat Rev Cancer 4, 891–899. 10.1038/nrc1478. - DOI - PubMed
    1. Michealraj KA, Kumar SA, Kim LJY, Cavalli FMG, Przelicki D, Wojcik JB, Delaidelli A, Bajic A, Saulnier O, MacLeod G, et al. (2020). Metabolic Regulation of the Epigenome Drives Lethal Infantile Ependymoma. Cell 181, 1329–1345 e1324. 10.1016/j.cell.2020.04.047. - DOI - PMC - PubMed
    1. Lu C, and Thompson CB (2012). Metabolic regulation of epigenetics. Cell metabolism 16, 9–17. 10.1016/j.cmet.2012.06.001. - DOI - PMC - PubMed
    1. Vander Heiden MG, Cantley LC, and Thompson CB (2009). Understanding the Warburg effect: the metabolic requirements of cell proliferation. Science 324, 1029–1033. 10.1126/science.1160809. - DOI - PMC - PubMed