. 2024 Dec;300(12):107924.
doi: 10.1016/j.jbc.2024.107924. Epub 2024 Oct 23.

STIM1 functions as a proton sensor to coordinate cytosolic pH with store-operated calcium entry

Affiliations

STIM1 functions as a proton sensor to coordinate cytosolic pH with store-operated calcium entry

Yilan Chen et al. J Biol Chem. 2024 Dec.

Abstract

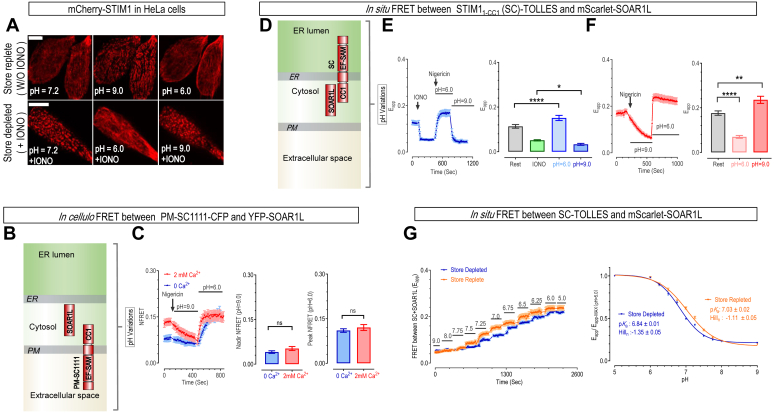
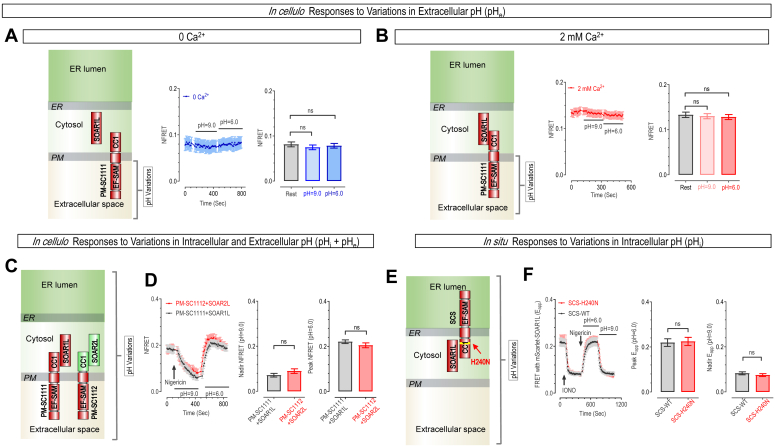
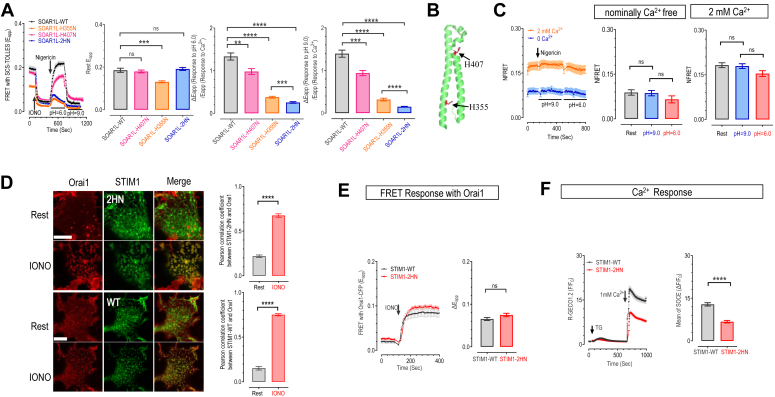
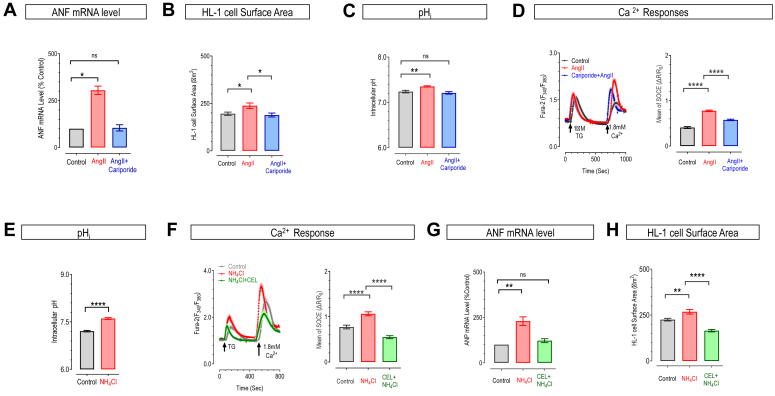
The meticulous regulation of intracellular pH (pHi) is crucial for maintaining cellular function and homeostasis, impacting physiological processes such as heart rhythm, cell migration, proliferation, and differentiation. Dysregulation of pHi is implicated in various pathologies such as arrhythmias, cancer, and neurodegenerative diseases. Here, we explore the role of STIM1, an ER calcium (Ca2+) sensor mediating Store Operated Ca2+ Entry (SOCE), in sensing pHi changes. Our study reveals that STIM1 functions as a sensor for pHi changes, independent of its Ca2+-binding state. Through comprehensive experimental approaches including confocal microscopy, FRET-based sensors, and mutagenesis, we demonstrate that changes in pHi induce conformational alterations in STIM1, thereby modifying its subcellular localization and activity. We identify two conserved histidines within STIM1 essential for sensing pHi shifts. Moreover, intracellular alkalization induced by agents such as Angiotensin II or NH4Cl enhances STIM1-mediated SOCE, promoting cardiac hypertrophy. These findings reveal a novel facet of STIM1 as a multi-modal stress sensor that coordinates cellular responses to both Ca2+ and pH fluctuations. This dual functionality underscores its potential as a therapeutic target for diseases associated with pH and Ca2+ dysregulation.

Keywords: FRET imaging; SOCE; STIM1; calcium signaling; cardiac hypertrophy; intracellular pH (pH(i)).


Conflict of interest statement

Conflict of interest The authors declare that they have no conflicts of interest with the contents of this article.

Figures

Figure 1
Figure 1
STIM1 dose-dependently responds to changes in intracellular pH (pHi), with minimal dependence on adjacent Ca2+levels in HeLa cells. Nigericin (10 μM), a H+/K+ ionophore, was used with high K+ buffer solutions at different extracellular pH (pHe) to adjust pHi. This allows pHi to be controlled by matching it with pHe. A, typical confocal imaging results showing effects of pHi changes on subcellular distribution of mCherry-STIM1 transiently expressed in HeLa cells at basal or ER Ca2+ depleted conditions. Top: cells under basal, or ER Ca2+ store replete conditions. Bottom: cells with ER Ca2+ store depleted by 5-min bath using 2.5 μM ionomycin (IONO), a Ca2+ ionophore (Scale bar: 10 μm, n = 3). B and C, in cellulo responses of PM-localized STIM1 to concurrent alterations in pHe and pHi. Schematic representation of the subcellular distribution of the two STIM1 constructs tested for FRET imaging: YFP-STIM1343-491(SOAR1L) and engineered PM-localized STIM11-CC1 (PM-SC1111)-CFP. Cartoon illustration of the subcellular distribution of these two constructs within cells (Refer to Fig. S1 for detailed description of these constructs). B, left: representative curves of FRET responses between YFP-SOAR1L and PM-SC1111–CFP monitored in nominally 0Ca2+ and 2 mM Ca2+ solution. Middle and left, statistics (C) (ns, p > 0.05, unpaired Student's t test, error bars denote SEM, n = 3). D–F, in situ responses of STIM1 to pHi changes. Cartoon representation of acid-resistant FRET tools employed for monitoring the activation status of STIM1: mScarlet-SOAR1L and STIM11-CC1 (SC)-Tolerance of Lysosomal Environments (TOLLES). TOLLES is an acid-resistant CFP variant (D). FRET responses between SC-TOLLES and mScarlet-SOAR1L in HeLa STIM1-STIM2 double knock-out (SK) cells. The measurements were conducted before altering pHi, with two conditions represented: with IONO treatment (E) left, representative curve; right, statistics (two-way ANOVA, F (3, 132) = 126.7, p < 0.0001;) (Rest versus pH = 6.0, p < 0.0001; IONO versus pH = 9.0, p = 0.049).and without IONO treatment (one-way ANOVA, F (2, 165) = 53.35, p < 0.0001) (pH = 6.0, p < 0.0001; pH = 9.0, p = 0.001). F, left, representative curve; right, statistics (error bars denote SEM, n = 3). G, in situ H+ titrations of FRET responses between transiently co-expressed SC-TOLLES and mScarlet-SOAR1L in HeLa SK cells. Left: typical traces; right: dose-response curves (n = 3).
Figure 2
Figure 2
Mapping critical regions essential for STIM1 in sensing changes in pHiwithin HeLa SK cells.A and B, perturbations in pHe adjacent to EF-SAM region of PM-SC1111–CFP had no substantial impact on its FRET responses with YFP-SOAR1L. Recordings were carried out using cells immersed in nominally Ca2+ free solution (A) left: cartoon depiction of constructs used; Middle: representative curves; right: statistics (one-way ANOVA, F (2, 390) = 0.39, p = 0.67) (pH = 6.0, p = 0.65; pH = 9.0, p = 0.91), (error bars denote SEM, n = 3) or buffers containing 2 mM Ca2+ (B). Left: cartoon depiction; middle: representative curves; right: statistics (one-way ANOVA, F (2, 333) = 0.19, p = 0.83) (pH = 6.0, p = 0.92; pH = 9.0, p = 0.83), (error bars denote SEM, n = 3). C and D, under extracellular conditions with a high concentration of Ca2+ (30 mM), replacing the CC1-domain and SOAR1L with those of STIM2 (PM-SC1112-CFP and YFP-SOAR2L) had minimal impact on STIM1's response to changes in adjacent pH (Plasmid construction strategy: see Fig. S1). Schematic representation of STIM1/2 constructs tested (PM-SC1111-CFP + YFP-SOAR2L or PM-SC1112-CFP + YFP-SOAR1L). C, typical traces (left) and statistics (middle and right) (D) (ns, p > 0.05, unpaired Student's t test, error bars denote SEM, n = 3). E and F, STIM1-H240N mutation had no effect on in situ FRET responses between STIM11-261(SCS)-TOLLES and mScarlet-SOAR1L. Schematic representation of STIM1 constructs tested (E). Representative traces (left) and statistics (middle and right) (F) (ns, p > 0.05, unpaired Student's t test, error bars denote SEM, n = 3).
Figure 3
Figure 3
Mutations at SOAR1L-H355-H407 minimally impact STIM1's coupling with Orai1 but significantly diminish its pH-sensing ability.A, FRET responses between SCS-TOLLES and mScarlet-SOAR1L WT (black), or its H407N (pink), H355N (orange), H355N-H407N mutant (2HN) (blue) in HeLa SK cells. Left most: typical curves; bar charts on the right: statistics of FRET signals. Middle left, basal FRET; middle right and rightmost, changes in FRET signals induced by acidification or alkalization, normalized against those resulting from store depletion. (Middle left: one-way ANOVA, F (3, 238) = 9.88, p < 0.0001) (H355N, p = 0.006; H407N, p = 0.922; 2HN, p = 0.91), (middle right: one-way ANOVA, F (3, 242) = 80.36, ∗∗∗∗p < 0.0001; ∗∗∗p = 0.0001, ∗∗p = 0.0096), (right: one-way ANOVA, F (3, 238) = 110.2, ∗∗∗∗p < 0.0001; ∗∗∗p = 0.0003) (error bars denote SEM, n = 3). B, a diagram illustrating the location of H355 and H407 residue on SOAR1 structure. C, FRET responses mediated by PM-SC1111-CFP and YFP-SOAR1L-2HN in HeLa SK cells. Left, representative traces; middle & right, statistics of pH-induced changes in FRET signal (middle: one-way ANOVA, F (2, 102) = 1.615, p = 0.2) (rest versus pH = 9.0, p = 0.99; pH = 9.0 versus pH = 6.0, p = 0.31) (left: one-way ANOVA, F = 3.14 p = 0.0453, rest versus pH = 9.0, p = 0.9643; pH = 9.0 versus pH = 6.0, p = 0.1074) (error bars denote SEM, n = 3). D–F, effects of 2HN mutation on the coupling of STIM1 with Orai1 and corresponding Ca2+ responses examined in HEK SK cells stably expressing Orai1-CFP (SKO cells). D, co-localization between Orai1-CFP (red) and transiently expressed STIM1-YFP or STIM1-H355N-H407N (2HN)-YFP (green) with Orai1-CFP (red) in HEK SKO cells pre- and post-store depletion. Store depletion induced by a 5-min bath application of 2.5 μM IONO. Left, typical confocal images. (Uppermost and lower middle row on the left: Store repleted; upper middle lowest row: Store depleted). (Scale bar: 10 μm, n = 3). Bar chart on the right, statistics. (n = 3, ∗∗∗∗p < 0.0001, unpaired Student's t test, error bars represent SEM). E, FRET responses mediated by Orai1-CFP and YFP-STIM1 or YFP-STIM1-2HN. Store depletion was induced by 2.5 μM IONO (C). Left, representative traces; right, statistics of IONO-induced increases in FRET signal (ns, p > 0.05, unpaired Student's t test, error bars denote SEM, n = 3). F, Ca2+ responses induced by thapsigargin (TG, 1 μM) in SKO cells transiently co-expressing R-GECO1.2, a low affinity red GECI, and YFP-STIM1 or YFP-STIM1-2HN. TG is a blocker of the ER Ca2+ pump to induce depletion of ER Ca2+ store and subsequent SOCE. Left, typical traces; right, statistics of TG-induced SOCE (n = 3, ∗∗∗∗p < 0.0001, unpaired Student's t test, error bars represent SEM).
Figure 4
Figure 4
Angiotensin II (Ang II) or NH4Cl may induce cardiac hypertrophy by enhancing STIM1-mediated SOCE through pHialkalization in HL-1 Cells.A–D, Ang II-induced cardiac hypertrophy was accompanied with pHi alkalization and enhancement of SOCE. Hypertrophy was induced by 24 h-incubation with 0.1 μM Ang II in serum-free medium. Control cells were compared with those treated with 0.1 μM Ang II alone, or with the combination of 1 μM cariporide, an inhibitor of Na+/H+ exchange inhibitor 1 (NHE1). Statistics of mRNA level of atrial natriuretic factor (ANF) (one-way ANOVA, F (2, 6) = 29.89, p = 0.0039) (Ctrl versus Ang II, p = 0.01; Ctrl versus AngII + cariporide, p = 0.986) (A) and cell surface area (B) mRNA levels were normalized to GAPDH (one-way ANOVA, F (2, 6) = 4.952, p = 0.0085) (Ctrl versus Ang II, p = 0.0231; Ang II versus AngII + cariporide, p = 0.260). Statistics of pHi, measured with a genetically encoded ratiometric pH sensor, pHmScarlet-mTurquoise2 (C). (One-way ANOVA, F (2, 166) = 9.283, p = 0.0002) (Ang II, p = 0.0016; AngII + cariporide, p = 0.6532). TG-induced Ca2+ responses showed by a cytosolic Ca2+ indicator, Fura-2. Left, typical traces; right, statistics of SOCE responses (D) (one-way ANOVA, F (2, 321) = 105.6, p < 0.0001) (Ctrl versus Ang II, p < 0.0001; Ang II versus AngII + cariporide, p < 0.0001). (n = 3, error bars denote SEM). E, statistics showing effects of 24 h-treatment with 40 mM NH4Cl on pHi. pHi was measured using pHmScarlet-mTurquoise2. (n = 3, ∗∗∗∗p < 0.0001, unpaired Student's t test, error bars represent SEM). F–H, TG-induced Ca2+ responses or cardiac hypertrophic responses in controls, or cells following 24 h-treatment with 40 mM NH4Cl alone, or in combination with 1.5 μM celastrol (CEL), a specific inhibitor of SOCE. TG-induced Ca2+ signals left: representative curves; right: statistics of SOCE responses (one-way ANOVA, F (2, 389) = 43.78, p < 0.0001) (Ctrl versus NH4Cl, p < 0.0001; Ctrl versus NH4Cl + CEL, p < 0.0001) (F). Statistics of ANF mRNA level (one-way ANOVA, F (2, 8) = 17.58, p = 0.0012) (Ctrl versus NH4Cl, p < 0.0013; Ctrl versus NH4Cl + CEL, p = 0.5735) (G), cell surface area (one-way ANOVA, F (2, 282) = 33.04, p < 0.0001) (Ctrl versus NH4Cl, p = 0.002; Ctrl versus NH4Cl + CEL, p < 0.0001) (H). (n = 3, error bars denote SEM).

Similar articles

References

    1. Lyu Y., Thai P.N., Ren L., Timofeyev V., Jian Z., Park S., et al. Beat-to-beat dynamic regulation of intracellular pH in cardiomyocytes. iScience. 2022;25 - PMC - PubMed
    1. Stock C. pH-regulated single cell migration. Pflugers Arch. 2024;476:639–658. - PMC - PubMed
    1. Schreiber R. Ca2+ signaling, intracellular pH and cell volume in cell proliferation. J. Membr. Biol. 2005;205:129–137. - PubMed
    1. Berridge M.J., Bootman M.D., Roderick H.L. Calcium signalling: dynamics, homeostasis and remodelling. Nat. Rev. Mol. Cell Biol. 2003;4:517–529. - PubMed
    1. Vaughan-Jones R.D., Spitzer K.W., Swietach P. Intracellular pH regulation in heart. J. Mol. Cell Cardiol. 2009;46:318–331. - PubMed

Publication types

LinkOut - more resources