. 2024 Dec;300(12):107929.
doi: 10.1016/j.jbc.2024.107929. Epub 2024 Oct 24.

TFEB agonist clomiphene citrate activates the autophagy-lysosomal pathway and ameliorates Alzheimer's disease symptoms in mice

Affiliations

TFEB agonist clomiphene citrate activates the autophagy-lysosomal pathway and ameliorates Alzheimer's disease symptoms in mice

Jieru Lin et al. J Biol Chem. 2024 Dec.

Abstract

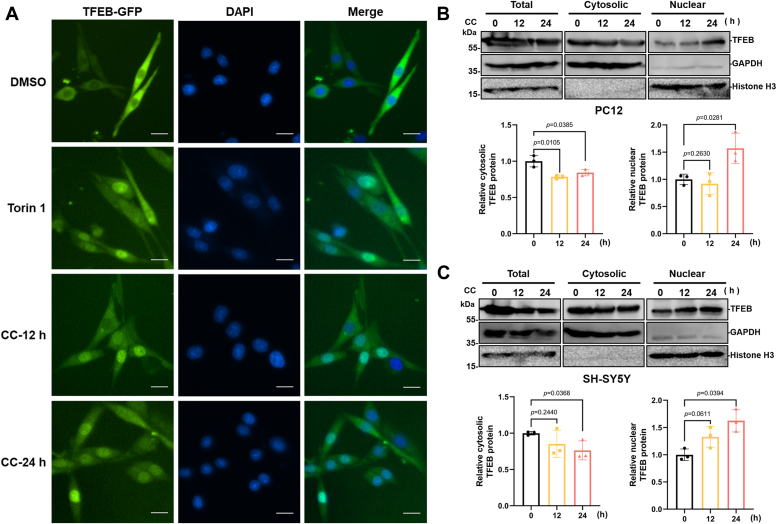
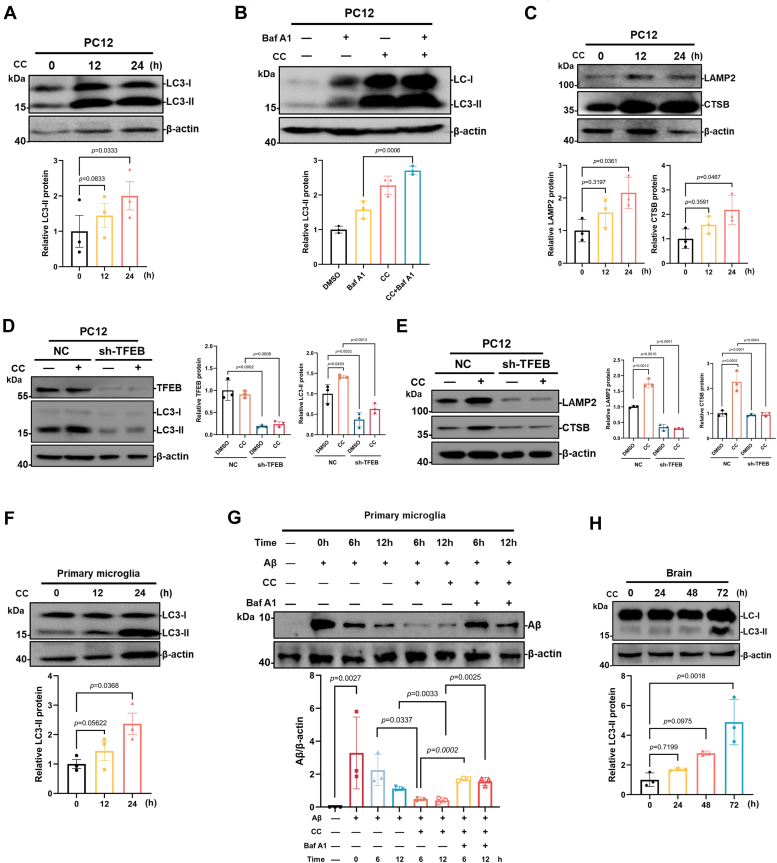
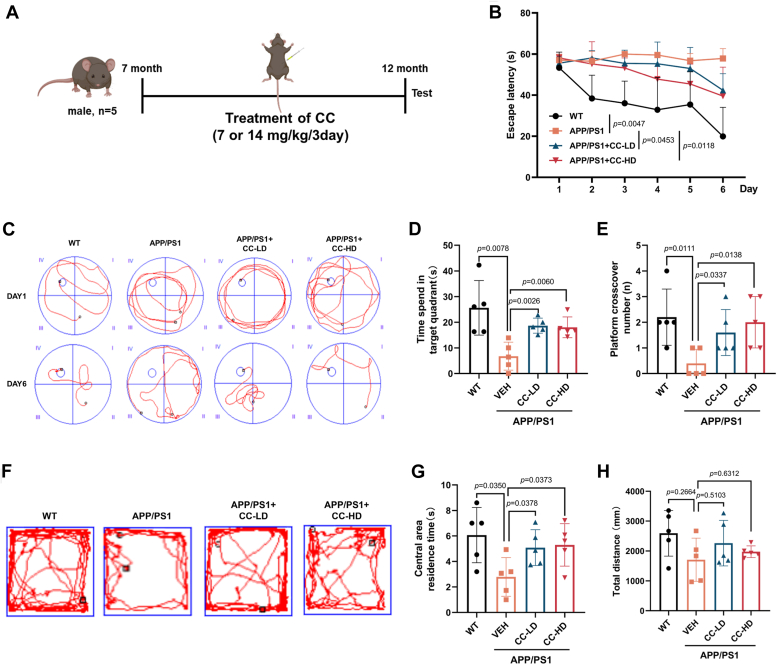
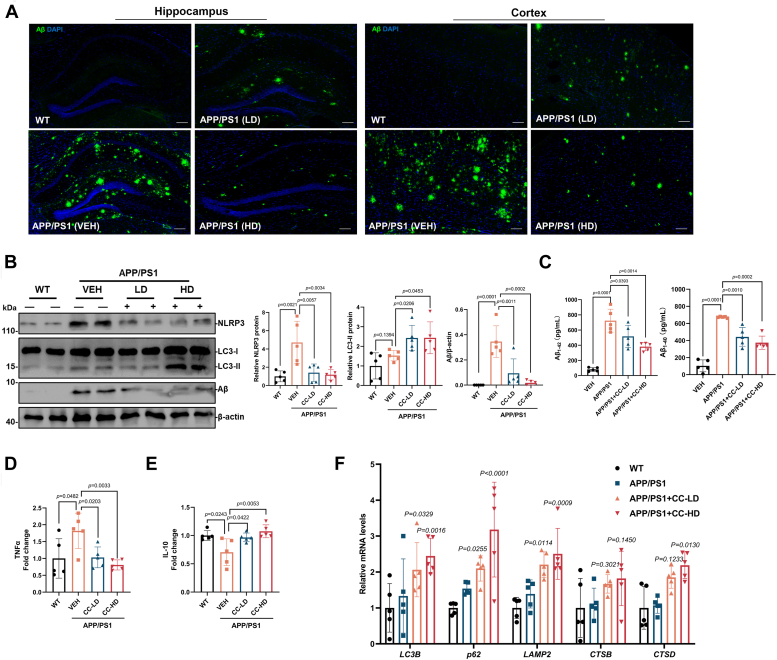
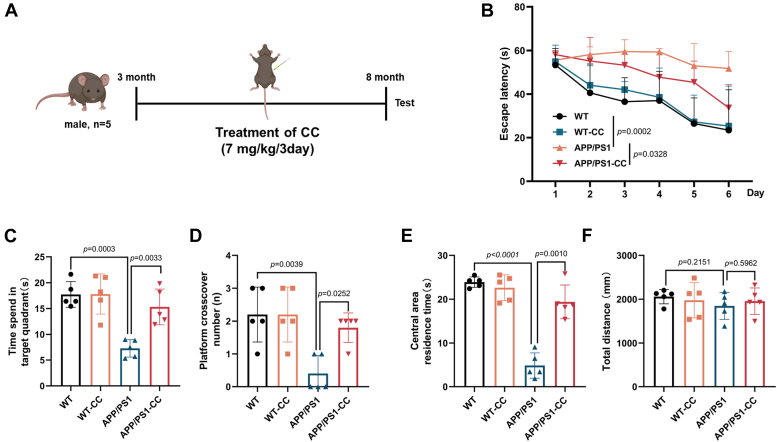
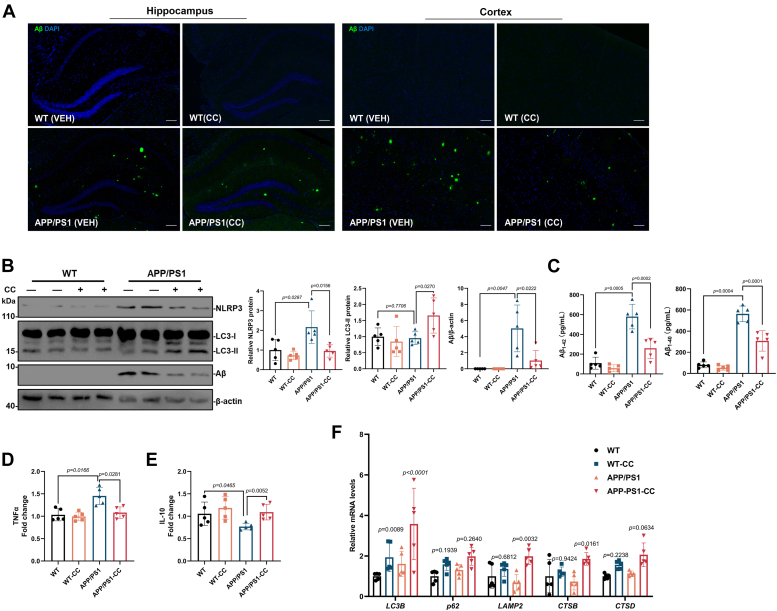
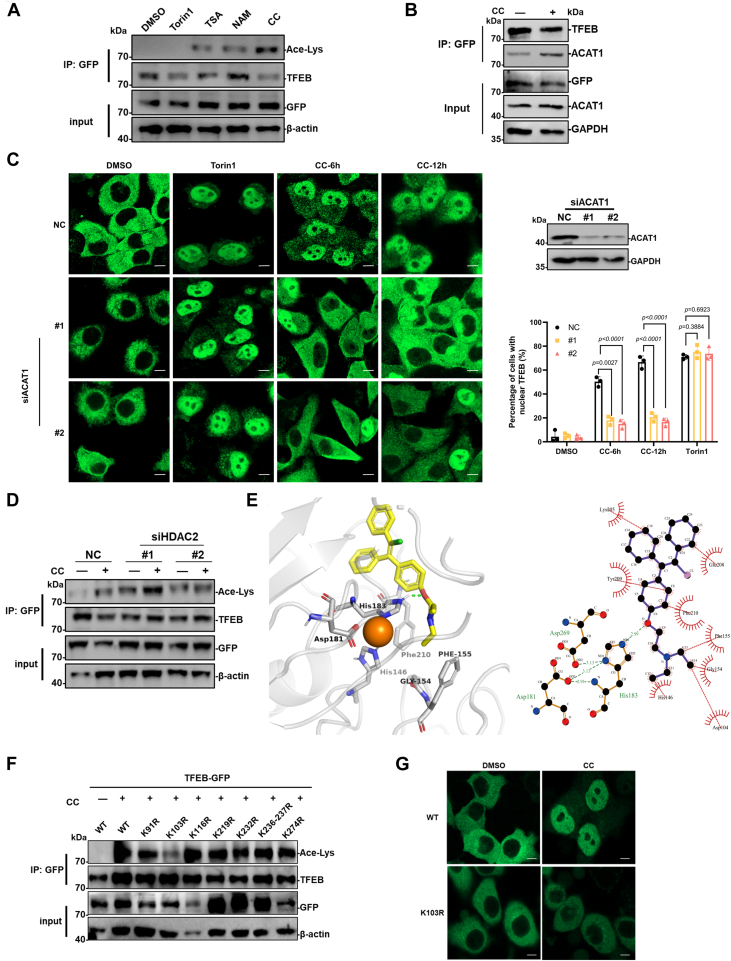
Autophagy is a conserved eukaryotic cellular clearance and recycling process through the lysosome-mediated degradation of damaged organelles and protein aggregates to maintain homeostasis. Impairment of the autophagy-lysosomal pathway is implicated in the pathogenesis of Alzheimer's disease (AD). Transcription factor EB (TFEB) is a master regulator of autophagy and lysosomal biogenesis. Therefore, activating TFEB and autophagy provides a novel strategy for AD treatment. We previously described that clomiphene citrate (CC) promotes nuclear translocation of TFEB and increases autophagy and lysosomal biogenesis. In this study, 7- and 3-month-old APP/PS1 mice were treated with TFEB agonist CC and assessed. The behavioral tests were performed using Morris water maze and open field test. Additional changes in amyloid-β pathology, autophagy, and inflammatory response were determined. We found that CC activated TFEB and the autophagy-lysosomal pathway in neuronal cells. Moreover, using mouse model of Alzheimer's disease, CC treatment promoted clearance of amyloid-β plaques and ameliorated cognitive function in both 7- and 3-month-old APP/PS1 mice. The CC-induced activation of TFEB occurs by promoting acetylation of TFEB for nuclear translocation. These findings provide a molecular mechanism for the TFEB-mediated activation of the autophagy-lysosome pathway by CC, which has the potential to be repurposed and applied in the treatment or prevention of AD.

Keywords: Alzheimer's disease; TFEB; autophagy; clomiphene citrate; lysosome.


Conflict of interest statement

Conflict of interest The authors declare that they have no conflicts of interest with the contents of this article.

Figures

Figure 1
Figure 1
CC induces TFEB nuclear translocation in PC12 and SH-SY5Y cells. A, analysis of TFEB-GFP nuclear translocation. PC12 cells stably expressing a TFEB-GFP were cultured in medium with or without 10 μM CC for indicated time points, and observed using fluorescence microscopy. Nuclei were stained using DAPI (blue). Torin1 (200 nM, 1 h) was used as a positive control. The scale bar represents 20 μm. To detect the effect of CC on intracellular localization of endogenous TFEB, PC12 (B), or SH-SY5Y (C) cells were treated with or without 10 μM CC for indicated time points. Western blot was used to detect endogenous TFEB protein levels in the nuclear and cytosolic fractions. GAPDH and histone H3 were used as the loading controls. Lower panels indicate densitometric analysis of Western blot using ImageJ software. The protein levels of TFEB were normalized to levels of the cytosolic marker GAPDH or nuclear marker histone H3. Data are presented as mean ± SD of three independent experiments. CC, clomiphene citrate; DAPI, 4′,6-diamidino-2-phenylindole; TFEB, transcription factor EB.
Figure 2
Figure 2
CC activates the autophagy-lysosome pathway. A, effects of CC on the protein levels of LC3-II. PC12 cells were treated with 10 μM CC for 12 h or 24 h. The levels of LC3 were measured by Western blot using antibodies against LC3. LC3-II protein level was quantified using ImageJ analysis and represented as the mean band intensity normalized to β-actin. B, following 10 μM CC treatment for 12 h, the cells were treated with or without 200 nM Baf A1 for an additional 2 h. LC3 protein levels were detected by Western blot. LC3-II protein level was quantified using ImageJ analysis and represented as the mean band intensity normalized to β-actin. C, expression of LAMP2, CTSB in 10 μM CC treated PC12 cells were measured by Western blot. Quantitative analysis of the immunoblotted proteins was performed using ImageJ and represented as the mean band intensity normalized to β-actin. D, PC12 cells stably expressing TFEB shRNA (sh-TFEB) or negative control shRNA (NC) were treated with or without 10 μM CC for 24 h. The levels of TFEB and LC3-II were measured by Western blot using antibodies against TFEB and LC3-II. β-actin was used as a loading control. E, the protein levels of LAMP2 and CTSB were detected by Western blot in the NC or sh-TFEB expressing PC12 cells. ImageJ was performed for quantitative analysis of Western blot, and β-actin was used as loading control. F, primary microglia cells isolated from mouse brain were treated with 10 μM CC for 12 or 24 h and analyzed by Western blot using antibodies against LC3. LC3-II protein level was quantified using ImageJ analysis and represented as the mean band intensity normalized to β-actin. G, primary microglia cells were pretreated with 0.3 μg/μl Aβ42 peptides for 24 h to allow endocytosis of Aβ42, after washing, cells were further treated with or without 10 μM CC for 6, 12 h, then analyzed by Western blot using antibodies against Aβ. Aβ protein level was quantified using ImageJ analysis and represented as the mean band intensity normalized to β-actin. H, mice were administered intraperitoneally with CC (7 mg/kg), 24, 48 and 72 h after treatment, brains were extracted and used for Western blot analysis. LC3-II expression was quantified using ImageJ analysis and represented as the mean band intensity normalized to β-actin. Data are presented as mean ± SD of three independent experiments. Aβ, amyloid-β; Baf A1, bafilomycin A1; CC, clomiphene citrate; CTSB, cathepsin B; LC3, microtubule-associated protein light chain-3; TFEB, transcription factor EB.
Figure 3
Figure 3
CC treatment of 7-month-old APP/PS1 AD mice improves cognitive impairment. The Morris water maze (MWM) and open field test were used for behavioral tests. A, schedule of animal treatments and experimental protocols. Briefly, 7-month-old male APP/PS1 mice were administered intraperitoneally with CC (7, 14 mg/kg body weight) or vehicle (0.9% normal saline) every 3 days to the 12 months of age before testing. CC-LD: 7 mg/kg, CC-HD: 14 mg/kg. The C57BL/6 mice were used as the WT control. n = 5. B, latency to escape to a hidden platform during a 6-days MWM training trial period. C, representative moving patterns of mice in each group during the MWM training trial (Day 1 and Day 6). Further MWM probe trial analysis, time spent in the target quadrant (D), and number of times that mice passed through the platform location (E). F, representative paths of mice in each group using the open field test. Quantification of the open field test for time stayed in the center area (G), and total distance traveled in the open field (H). Data are presented as mean ± SD of three independent experiments. AD, Alzheimer’s disease; APP, Aβ precursor protein; CC, clomiphene citrate; MWM, Morris water maze.
Figure 4
Figure 4
CC treatment of 7-month-old APP/PS1 AD mice promotes clearance of Aβ plaques and improves Alzheimer's disease symptoms. A, representative images of the hippocampus and cortex in mouse brain sections immunostained with an antibody against Aβ and DAPI. The scale bar represents 50 μm. B, mouse brains were extracted and used for Western blot analysis using antibodies against Aβ, LC3 and NLRP3, β-actin was used as a loading control. C, the Aβ1-42 and Aβ1-40 contents in the mice brain tissues were detected using ELISA. The detected protein levels were quantified by densitometric analysis and are represented as mean band intensity normalized to β-actin. The levels of the cytokines including TNF-α (D) and IL-10 (E) in the brain tissues were detected using ELISA. F, the mRNA levels of genes encoding LC3B, p62, LAMP2, CTSB, and CTSD in the brain tissue were detected by qRT-PCR analysis (n = 5). Data are presented as mean ± SD of three independent experiments. Aβ, amyloid-β; AD, Alzheimer’s disease; APP, Aβ precursor protein; CC, clomiphene citrate; CTSB, cathepsin B; CTSD, cathepsin B; DAPI, 4′,6-diamidino-2-phenylindole; LC3, microtubule-associated protein light chain-3; NLRP3, NOD-like receptor family pyrin domain-containing 3; qRT-PCR, quantitative reverse transcription PCR; TNF-α, tumor necrosis factor-alpha.
Figure 5
Figure 5
CC treatment of 3-month-old APP/PS1 AD mice ameliorates cognitive decline. The Morris water maze (MWM) and open field test were used for behavioral tests. A, schedule of animal treatments and experimental protocols. Three-month-old male APP/PS1mice or C57BL/6 mice (WT) were administered intraperitoneally with CC (7 mg/kg body weight) or vehicle (0.9% normal saline) every 3 days up to 8 months of age before testing. n = 5. B, latency to escape to a hidden platform during a 6-day MWM training trial period. Further MWM probe trial analysis, time spent in the target quadrant (C), and number of times that mice passed through the platform location (D). Quantification of the open field test for time stayed in the center area (E), and total distance traveled in the open field (F). Data are presented as mean ± SD of three independent experiments. AD, Alzheimer’s disease; APP, Aβ precursor protein; CC, clomiphene citrate.
Figure 6
Figure 6
CC treatment of 3-month-old APP/PS1 AD mice reduces Aβ and improves Alzheimer's disease symptoms. A, representative images of the hippocampus and cortex in mice brain sections immunostained with antibody against Aβ and DAPI. The scale bar represents 50 μm. B, mouse brains were extracted and used for Western blot analysis using antibodies against Aβ, LC3, and NLRP3, β-actin was used as a loading control. C, the protein levels of Aβ1-42 and Aβ1-40 in mice brain were detected using ELISA. The detected protein levels were quantified by densitometric analysis and are represented as mean band intensities normalized to β-actin. The levels of the cytokines including TNF-α (D) and IL-10 (E) in the brain tissues were detected using ELISA. F, The mRNA levels of genes encoding LC3B, p62, LAMP2, CTSB, f4and CTSD in brain tissue were detected by quantitative reverse transcription PCR analysis (n = 5). Data are presented as mean ± SD of three independent experiments. Aβ, amyloid-β; AD, Alzheimer’s disease; APP, Aβ precursor protein; CC, clomiphene citrate; CTSB, cathepsin B; CTSD, cathepsin B; DAPI, 4′,6-diamidino-2-phenylindole; LC3, microtubule-associated protein light chain-3; NLRP3, NOD-like receptor family pyrin domain-containing 3; TNF-α, tumor necrosis factor-alpha.
Figure 7
Figure 7
CC treatment promotes acetylation of TFEB and its nuclear translocation. A, HeLa cells stably expressing a TFEB-GFP were treated with 10 μM CC, 10 μM TSA, 4 mM NAM for 24 h, and 250 nM Torin1 for 6 h, cells were extracted and immuno-precipitated using antibody against GFP, then analyzed by Western blot using acetylated-lysine Mouse mAb (Ace-Lys) and antibodies against TFEB, GFP, β-actin. B, HeLa cells stably expressing a TFEB-GFP were treated with or without 10 μM CC for 24 h, cells were extracted and immunoprecipitated using antibody against GFP, then analyzed by Western blot using antibodies against TFEB, ACAT1, GFP, and GAPDH. C, HeLa cells stably expressing TFEB-GFP were transfected with two siRNAs targeting ACAT1, 3 days after transfection, 10 μM CC was added and further treated for 6, 12 h, then observed using confocal fluorescence microscopy. Torin1 (200 nM, 1 h) was used as a positive control. The percentage of cells with nuclear TFEB-GFP fluorescence was quantified. The scale bar represnts 10 μm. D, HeLa cells stably expressing TFEB-GFP were transfected with two siRNAs targeting ACAT1, 3 days after transfection, 0 or 10 μM CC was added and further treated for 12 h. Cells were extracted and immunoprecipitated using antibody against GFP, then analyzed by Western blot using acetylated-lysine Mouse mAb (Ace-Lys) and antibodies against TFEB, GFP, β-actin. E, the molecular docking analysis of En-cc with HDAC2 using AutoDock version 4.2 software (https://autodock.scripps.edu/download-autodock4). The binding modes were visualized in both three- and two-dimensional representations using PyMOL software (version 3.0.0) and Ligplot software (version 2.2.8), respectively. The zinc-binding active sites of HDAC2 were shown as His146, Gly154, Phe155, Asp181, His183, and Phe210. Orange ball represents the zinc ion. Interaction plot by LIGPLOT (right) (Dotted red and dotted green lines represent hydrophobic contacts and hydrogen bonds with its length, respectively). F, HeLa cells stably expressing a TFEB-GFP (WT) and a series of mutants (KR) were generated and treated with 10 μM CC for 24 h. Cells were extracted and immunoprecipitated using antibody against GFP, then analyzed by Western blot using acetylated-lysine mouse mAb (Ace-Lys) and antibodies against TFEB, GFP, and β-actin. G, HeLa cells stably expressing a TFEB-GFP (WT) and mutant (K103R) were treated with or without 10 μM CC for 24 h, then observed using confocal fluorescence microscopy. The scale bar represents 10 μm. ACAT1, acetyl-CoA acetyltransferase 1; CC, clomiphene citrate; En-CC, enclomiphene citrate; HDAC, histone deacetylase; NAM, nicotinamide; TFEB, transcription factor EB; TSA, trichostatin A.

Similar articles

References

    1. Finkbeiner S. The autophagy lysosomal pathway and neurodegeneration. Cold Spring Harb Perspect. Biol. 2020;12:a033993. - PMC - PubMed
    1. Srinivasa Reddy B., Fengjuan W., Sylviane M. Lysosomes as a therapeutic target. Nat. Rev. Drug Discov. 2019;18:923–948. - PMC - PubMed
    1. Beth L., Guido K. Biological functions of autophagy genes: a disease perspective. Cell. 2019;176:11–42. - PMC - PubMed
    1. Insup C., Minghui W., Seungyeul Y., Peng X., Steven P.S., Xianting L., et al. Autophagy enables microglia to engage amyloid plaques and prevents microglial senescence. Nat. Cell Biol. 2023;25:963–974. - PMC - PubMed
    1. Zhichao F., Lin-Xi W., Wei J., Bo L., Dongbo W. Targeting autophagy with small-molecule activators for potential therapeutic purposes. Eur. J. Med. Chem. 2023;260:115722. - PubMed

Publication types

MeSH terms

Substances

LinkOut - more resources