. 2024 Oct 24;12(10):e009416.
doi: 10.1136/jitc-2024-009416.

Targeting CDCP1 boost CD8+ T cells-mediated cytotoxicity in cervical cancer via the JAK/STAT signaling pathway

Affiliations

Targeting CDCP1 boost CD8+ T cells-mediated cytotoxicity in cervical cancer via the JAK/STAT signaling pathway

Hua Huang et al. J Immunother Cancer. .

Abstract

Background: Cervical cancer remains a global health challenge. The identification of new immunotherapeutic targets may provide a promising platform for advancing cervical cancer treatment.

Objective: This study aims to investigate the role of CUB domain-containing protein 1 (CDCP1) in cervical cancer progression and evaluate its potential as a therapeutic target.

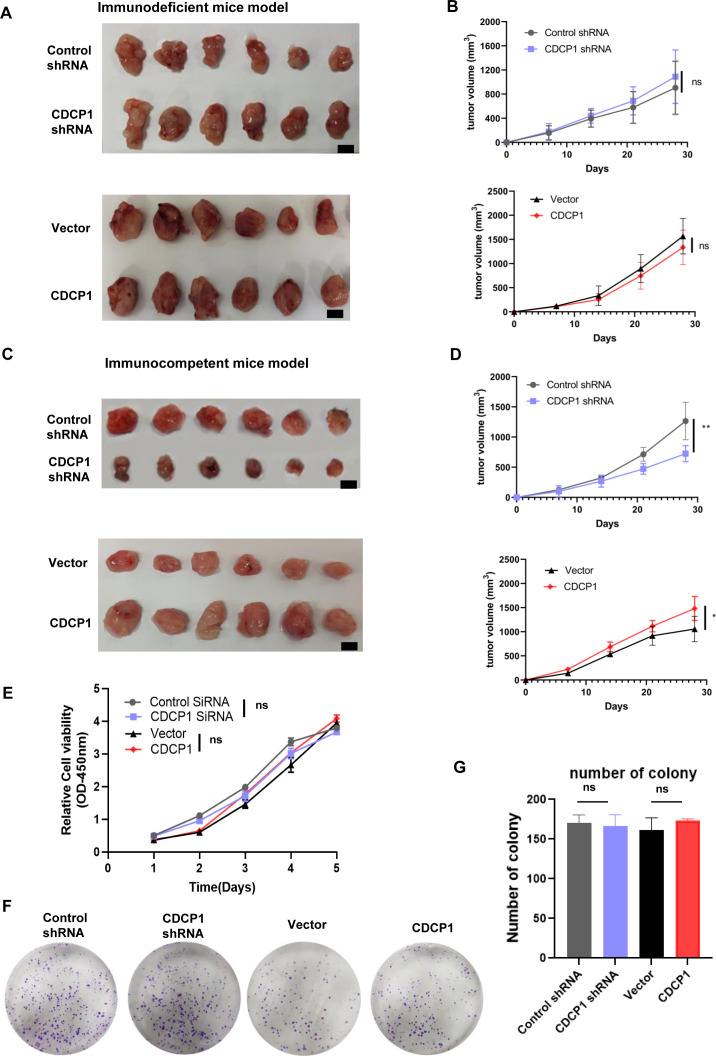
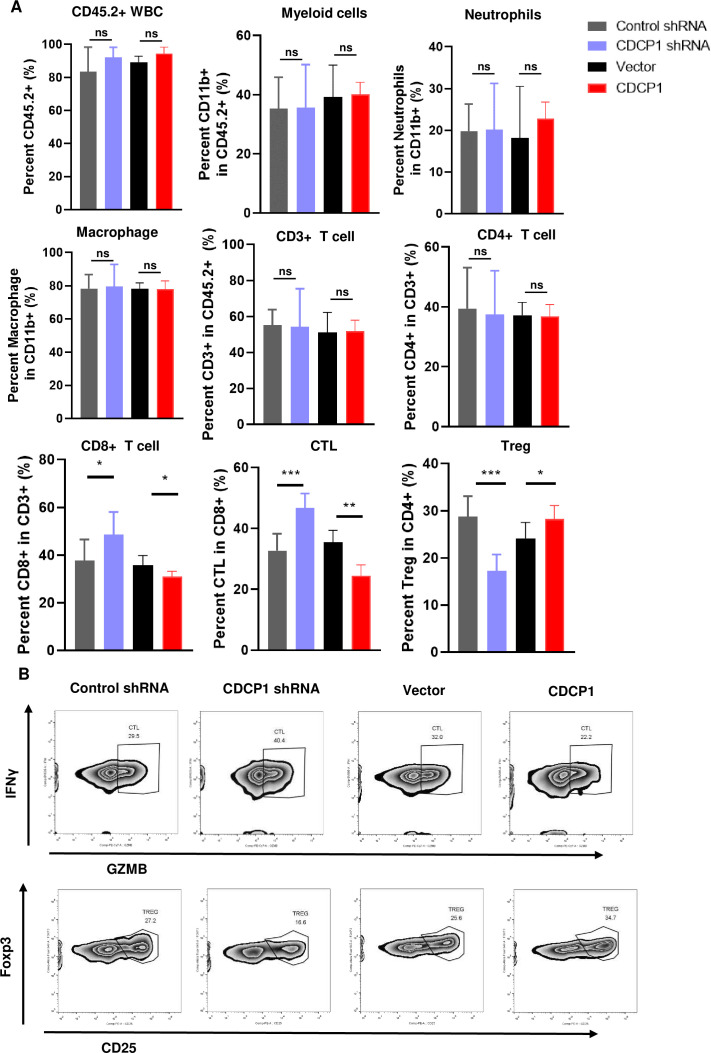
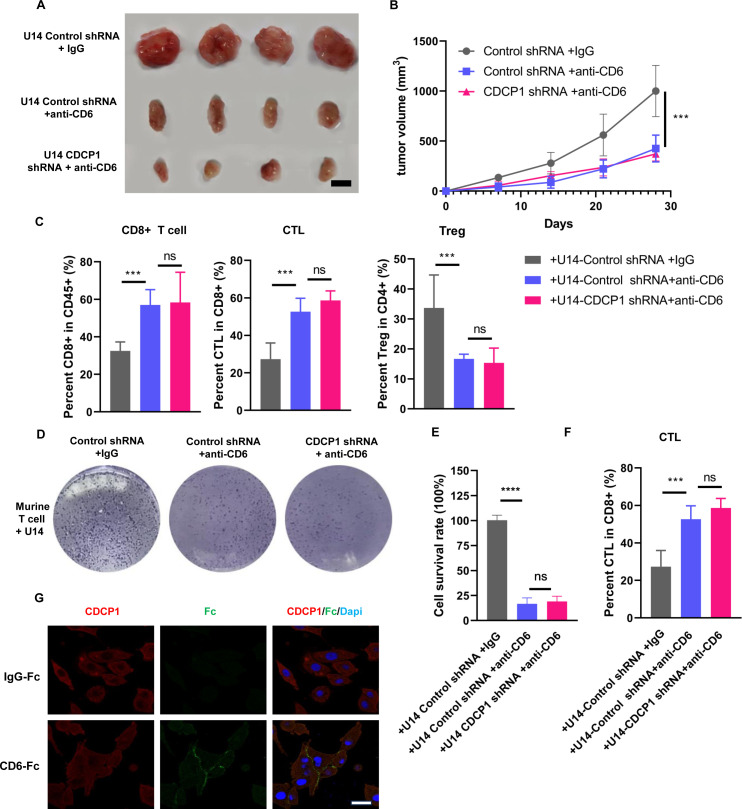
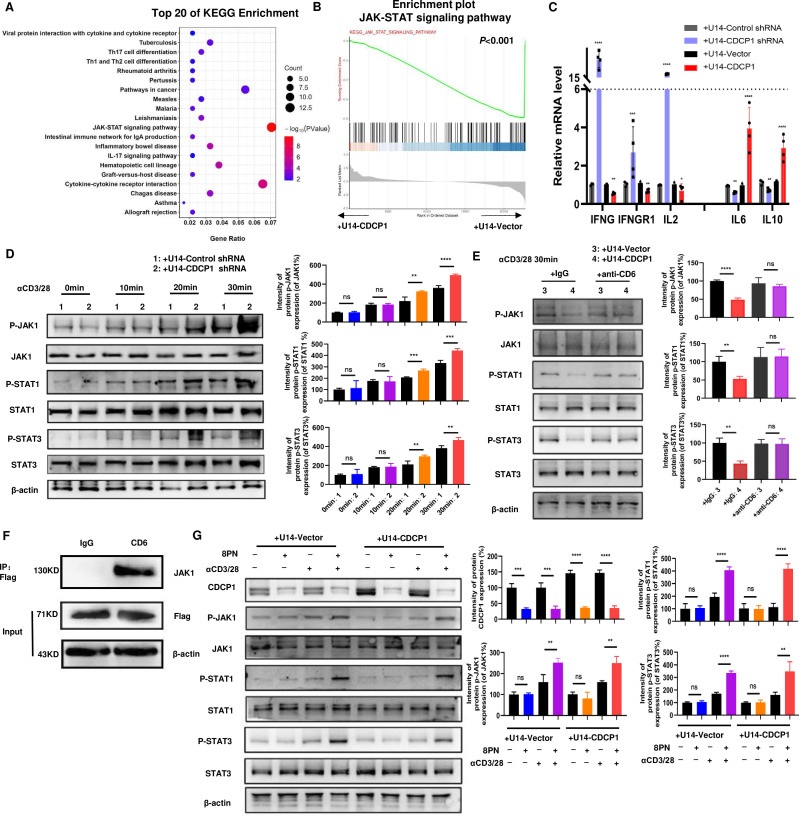
Methods: We performed comprehensive analyses using patient cohorts and preclinical models to examine the association between CDCP1 expression and cervical cancer prognosis. Then in immunodeficient and immunocompetent mouse models, we further investigated the impact of CDCP1 on the tumor immune microenvironment, focusing on its effects on tumor-infiltrating T cells, including cytotoxic T lymphocytes (CTLs) and regulatory T cells (Tregs). Mechanistic studies were performed to elucidate the pathways involved in CDCP1-mediated immune modulation, in particular its interaction with the T cell receptor CD6 and the activation of the JAK-STAT signaling pathway.

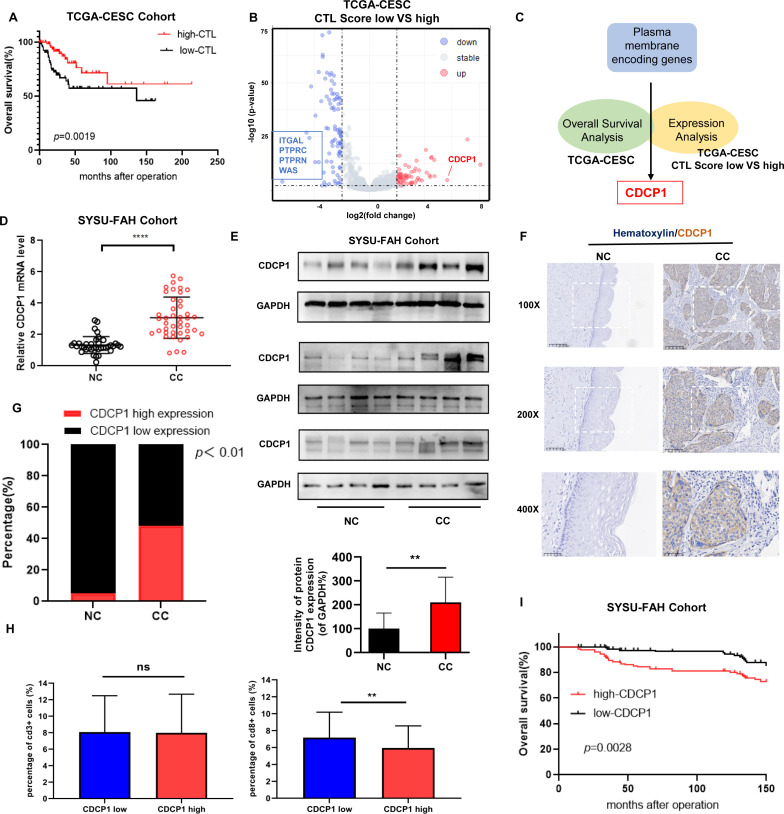
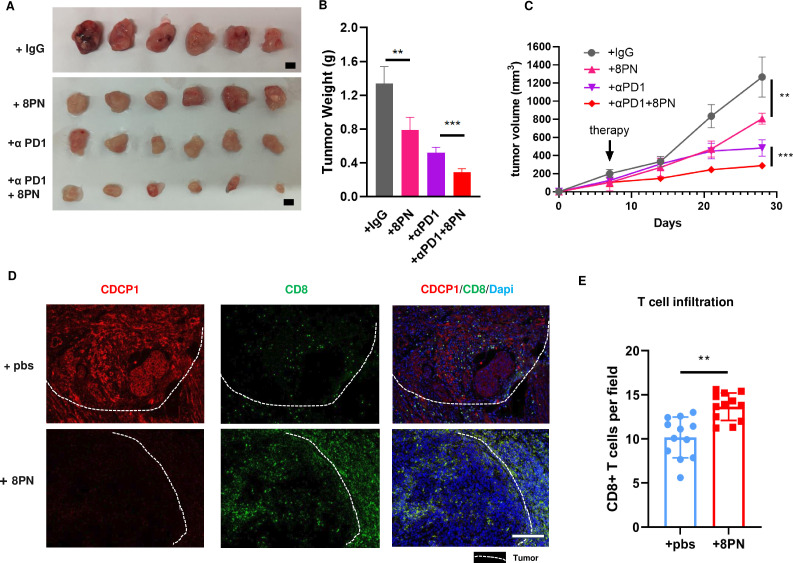
Results: Our results show that CDCP1 overexpression is associated with poor prognosis and T cell infliction in cervical cancer. Specifically, it affects the activity of CTLs and Tregs. Mechanistically, CDCP1 binds to CD6 and inhibits the JAK-STAT pathway of T cells. The study further demonstrates that targeting CDCP1 with the inhibitor 8-prenylnaringenin (8PN) effectively suppresses tumor growth in vivo and enhances antitumor immunity.

Conclusions: CDCP1 plays a critical role in cervical cancer progression by modulating the tumor immune microenvironment. Targeting CDCP1 offers a promising therapeutic strategy to improve the outcome of patients with cervical cancer.

Keywords: Cervical Cancer; Immunotherapy.


Conflict of interest statement

Competing interests: None declared.

Figures

Figure 1
Figure 1. Identified CDCP1 correlated with poor prognosis and involved in regulating CTL function in cervical cancer. (A) Kaplan-Meier survival curves showing the overall survival of patients based on CTL scores (average expression of CD8A, CD8B, GZMA, GZMB, and PRF1) in TCGA-CESC(The Cancer Genome Atlas-Cervical squamous cell carcinoma and endocervical adenocarcinoma) Cohort. The log-rank test was used to determine the statistical significance of the difference between CDCP1 high/low expression groups, with p<0.05 considered statistically significant. (B) Volcano plot depicting the analysis of differentially expressed proteins between the CTL low-score group and the CTL high-score group. Each point corresponds to a gene, with genes exhibiting significant differential expression highlighted in red (upregulated in the CTL low-score group) and blue (downregulated in the CTL low-score group). Genes with |log2FC| greater than 2 and p<0.01 are considered significantly differentially expressed. Genes encoding membrane proteins that show significant differential expression are specifically labeled, including ITGAL, PTPRC, PTPRN, WAS, and CDCP1. (C) Schematic representation of systematic screening for immunotherapy targets in cervical cancer using the TCGA database. Through survival analysis and differential gene analysis based on immune scores from the TCGA cervical cancer dataset, membrane protein-coding genes associated with patient prognosis and low CTL scores were identified as potential targets for immunotherapy. (D) qRT-PCR analysis of CDCP1 mRNA expression levels in various patients sample.(E) Western blot analysis of NC (n=12) and CC (n=12) tissue samples. (F) Representative IHC images of CDCP1 staining in the NC and CC tissue samples. Bar in ×100, ×200, ×400 magnifications=200 µm, 100 µm, 50 µm, respectively. (G) Quantification of low and high CDCP1 expression percentages in the NC (n=30) and CC (n=176) groups based on the IHC staining results. Data are mean±SEM. Significance was determined using Student’s t-test, “ns”: not significant, **p<0.01, ****p<0.0001. CC, cervical cancer (n=56); CTL, cytotoxic T lymphocyte; IHC, immunohistochemistry; NC, normal cervix (n=35).
Figure 2
Figure 2. The expression level of CDCP1 effected xenograft tumor growth in an immune-dependent manner. (A, B) Subcutaneous injection of control cells, CDCP1 knockdown, and CDCP1 overexpression U14 cells into 5-week-old female BALB/c-nu immunodeficiency mice (n=8 for each group). Representative images are shown in A, B. The line graph depicts the tumor growth curve of mice. Scale bar:50 mm. Values are presented as the mean±SD. *p<0.05, **p<0.01. (C, D) Subcutaneous injection of control cells, CDCP1 knockdown, and CDCP1 overexpression U14 cells into 6-week-old female C57BL/6J immunocompetent mice (n=8 for each group). Representative images are shown in (C, D). The line graph shows the tumor growth curve of mice. Scale bar:50 mm. Values are presented as the mean±SD ns, not significant. *p<0.05, **p<0.01. (E–G) Proliferation of control cells, CDCP1 knockdown, and CDCP1 overexpression U14 cells analyzed by CCK-8 assay (E) and colony formation assay (F, G). Data represent at least three independent experiments. Values are presented as the mean±SEM. Significance was determined using one way ANOVA test, *p<0.05, **p<0.01. ANOVA, analysis of variance; ns, not significant.
Figure 3
Figure 3. Analysis of different expression level of CDCP1 affection on tumor-infiltrating immune cells in immunocompetent mice models. (A) Control cells, CDCP1 knockdown and overexpression U14 cells formatted xenograft tumors in immunocompetent mice. Tumors were harvested and analyzed using flow cytometry. Myeloid cells, neutrophils, macrophages (n=4) and T cells (n=4) were analyzed. Statistics were performed using a Student’s t-test between groups. *p<0.05, **p<0.01, ***p<0.001. (B) Representative flow cytometry images frequencies of IFNγ+GZMB+ CTLs, Foxp3+CD25+Treg between groups. ns, not significant.
Figure 4
Figure 4. CDCP1 impair T-cell-mediated antitumor immunity through CD6. (A, B) Subcutaneous injection of control and CDCP1 knockdown U14 cells into 6-week-old female C57BL/6J immunocompetent mice (n=4 for each group). When tumors reaching a volume of 100 mm3, mice were randomly divided into groups and were intravenously injected with anti-CD6 monoclonal antibody or IgG control. Representative images are shown in A. Scale bar:50 mm. (B) The line graph illustrates the tumor growth curve of mice. Data are presented as the mean±SD. *p<0.05, **p<0.01, ***p<0.001, ****p<0.0001. (C) Frequencies of CD8+T cell, IFNγ+ GZMB+ CTLs and Foxp3+CD25+Treg in xenografts were analyzed. Data are presented as the mean±SD. Statistics were performed using a Student’s t-test between groups. *p<0.05, **p<0.01, ***p<0.001. (D–F) Murine U14 cells with different CDCP1 level were co-cultured with activated T cells (tumor-to-T cell ratio=1:2) for 48 hours with anti-CD6 monoclonal antibody or IgG control in vitro. Cells were subjected to crystal violet staining. Relative fold ratios of surviving tumor cell intensities are shown in E. Frequencies of IFNγ+ and GZMB+CTLs were quantified, as in F. Data are presented as the mean±SD. Statistics were performed using a Student’s t-test between groups. ns, not significant,***p<0.001. (G) Representative immunofluorescence labeling images indicated the interaction between CDCP1 and exogenous CD6 protein. Following incubation with recombinant human CD6-Fc fusion protein or human IgG, CDCP1 was diffusely distributed across the membrane and cytoplasm of SiHa cells (red signal). In the group treated with the exogenous CD6-Fc recombinant protein, CDCP1 binding to CD6 resulted in Fc staining positivity on the SiHa cell membrane (green signal). Scale bar: 5 µm.
Figure 5
Figure 5. CDCP1 inhibits the JAK-STATs signaling of T cells. (A) Kyoto Encyclopedia of Genes and Genomes (KEGG) analysis of RNA-seq data of active T cells co-cultured with of CDCP1 overexpressing U14 cell vs control U14 cells for 24 hours. (B) GSEA analysis of the differentially expressed genes (from RNA-seq datasets) involved in the suppression of JAK-STAT signaling pathway in T cells co-cultured with CDCP1 overexpressing U14 cells compared with T cells co-cultured with control U14 cells. p<0.001. (C) qPCR validation of the expression of genes downstream JAK-STAT signaling pathway in active T cells co-cultured with different CDCP1 expression level U14 cells. (D) The activation of the JAK-STAT pathway was assessed in the lysates of T cells co-cultured with control and CDCP1 knockdown U14 cells, following stimulation with anti-CD3 and anti-CD28 antibodies for 10–30 min. (E) The activation of the JAK-STAT pathway was assessed in the lysates of T cells co-cultured with control and CDCP1-overexpressing U14 cells, with or without anti-CD6 blockade. (F) Immunoprecipitation assay identified the interaction between CD6 and JAK1 in T cells. Murine T cell were transfected with CD6-3xFlag plasmid. Cell lysates were immunoprecipitated with Flag antibody and analyzed by immunoblot with anti-JAK1 and anti-Flag. (G) CDCP1 inhibitor 8PN activates the JAK1-STAT1/3 signaling pathway in T cells. After pretreated with 8PN or DMSO for 24 hours, the activation of the JAK-STAT pathway was assessed in the lysates of T cells co-cultured with control and CDCP1-overexpressing U14 cells. Significance was determined using Student’s t-test. *p<0.05, **p<0.01, ***p<0.001, ****p<0.0001. ns, not significant.
Figure 6
Figure 6. Targeting CDCP1 suppressed cervical cancer growth. (A–C) Subcutaneous injection of U14 cells into 6-week-old female C57BL/6J immunocompetent mice. When tumors reaching a volume of 100 mm3, mice were randomly divided into groups and were intravenously injected with anti-CD6 monoclonal antibody, anti-PD1 antibody, anti-CD6 antibody plus anti-PD1 antibody or IgG control. Representative images are shown in A. Scale bar: 50 mm. (B) of the resected tumor at day 28 after inoculation. Data are representative of two independent experiments. Values are presented as the mean±SEM. (C) The line graph illustrates the tumor growth curve of mice. Values are presented as the mean±SEM. Statistical significance was determined by Student’s t-test. **p<0.01, ***p<0.001. (D–E) The infiltration of CD8+T cell in cervical cancer xenograft specimen of CDCP1 inhibitor 8PN treatment group and control group. (D). Representative immunofluorescence images of two groups. White dashed line marks the boundary between the tumor tissue and the adjacent non-cancerous tissue. Scale bar: 50 µm. (E). Data are shown as mean±SEM. Statistical significance was determined by Student’s t-test. ns, not significant. *p<0.05, **p<0.01, ***p<0.001. ns, not significant.

Similar articles

Cited by

References

    1. Sung H, Ferlay J, Siegel RL, et al. Global Cancer Statistics 2020: GLOBOCAN Estimates of Incidence and Mortality Worldwide for 36 Cancers in 185 Countries. CA Cancer J Clin. 2021;71:209–49. doi: 10.3322/caac.21660. - DOI - PubMed
    1. Ferlay J, Ervik M, Lam F, et al. Lyon, France:: International Agency for Research on Cancer; 2024. Cancer observatory: cancer today; p. 8.https://gco.iarc.who.int/today Available.
    1. WHO Cervical cancer. 2023. https://www.who.int/zh/news-room/fact-sheets/detail/cervical-cancer Available.
    1. Poddar P, Maheshwari A. Surgery for cervical cancer: consensus & controversies. Indian J Med Res. 2021;154:284–92. doi: 10.4103/ijmr.IJMR_4240_20. - DOI - PMC - PubMed
    1. Vavassori A, Riva G, Spoto R, et al. High precision radiotherapy including intensity-modulated radiation therapy and pulsed-dose-rate brachytherapy for cervical cancer: a retrospective monoinstitutional study. J Contemp Brachytherapy. 2019;11:516–26. doi: 10.5114/jcb.2019.90478. - DOI - PMC - PubMed