. 2024 Nov 20;44(47):e1109242024.
doi: 10.1523/JNEUROSCI.1109-24.2024.

Spatiotemporal Mapping of Auditory Onsets during Speech Production

Affiliations

Spatiotemporal Mapping of Auditory Onsets during Speech Production

Garret Lynn Kurteff et al. J Neurosci. .

Abstract

The human auditory cortex is organized according to the timing and spectral characteristics of speech sounds during speech perception. During listening, the posterior superior temporal gyrus is organized according to onset responses, which segment acoustic boundaries in speech, and sustained responses, which further process phonological content. When we speak, the auditory system is actively processing the sound of our own voice to detect and correct speech errors in real time. This manifests in neural recordings as suppression of auditory responses during speech production compared with perception, but whether this differentially affects the onset and sustained temporal profiles is not known. Here, we investigated this question using intracranial EEG recorded from seventeen pediatric, adolescent, and adult patients with medication-resistant epilepsy while they performed a reading/listening task. We identified onset and sustained responses to speech in the bilateral auditory cortex and observed a selective suppression of onset responses during speech production. We conclude that onset responses provide a temporal landmark during speech perception that is redundant with forward prediction during speech production and are therefore suppressed. Phonological feature tuning in these "onset suppression" electrodes remained stable between perception and production. Notably, auditory onset responses and phonological feature tuning were present in the posterior insula during both speech perception and production, suggesting an anatomically and functionally separate auditory processing zone that we believe to be involved in multisensory integration during speech perception and feedback control.

Keywords: auditory perception; intracranial electrophysiology; language; speech; speech motor control; speech production.


Figures

Figure 1.
Figure 1.
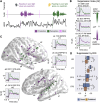
Coverage map. Individual electrodes for all included subjects with imaging (n = 15; excluding TC1 and DC4) plotted on the cvs_avg35_inMNI152 atlas brain, color-coded by anatomical region of interest. The cortical surface inflated for better visualization of insular electrodes. Electrode visualization in native subject space is available in Extended Data Figure 1-1.
Figure 2.
Figure 2.
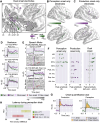
Auditory onset responses are suppressed during speech production. A, Schematic of reading and listening task. Participants read a sentence aloud (purple) and then passively listened to a playback of themselves reading the sentence (green). Pink spikes in the beginning and middle of the audio waveform indicate intertrial click tones, used as a cue and an auditory control. B, Single-electrode plots showing different profiles of response selectivity across the cortex. Color gradient represents normalized SI values. A more positive SI indicates an electrode is more responsive to speech perception stimuli (e1) while a more negative SI means an electrode is more responsive to production stimuli (e3). e2 and e3 are examples of response profiles described in subsequent figures (Figs. 3 and 4, respectively). Subplot titles reflect the participant ID and electrode name from the clinical montage. C, Whole-brain and single-electrode visualizations of perception and production selectivity (SI). Electrodes are plotted on a template brain with an inflated cortical surface; the dark gray indicates sulci while the light gray indicates gyri. Single-electrode plots of high-gamma activity demonstrate suppression of onset response relative to the acoustic onset of the sentence (vertical black line). D, Box plot of suppression index during onset (blue) and sustained (orange) time windows separated by an anatomical region of interest in primary and nonprimary auditory cortex. Brackets indicate significance (* = p < 0.05; ** = p < 0.01). Additional single-subject electrode profiles are shown in Extended Data Figures 2-1 and 2-2. Abbreviations: HG, Heschl's gyrus; PT, planum temporale; STG, superior temporal gyrus; STS, superior temporal sulcus; MTG, middle temporal gyrus; CS, central sulcus; Post. Ins., posterior insula.
Figure 3.
Figure 3.
A functional region of interest in the posterior insula shows onset responses to both speaking and listening. A, Whole-brain and visualization of dual onset electrodes. Electrodes are plotted on a template brain with an inflated cortical surface; the dark gray indicates sulci while the light gray indicates gyri. The black outline on the template brain highlights the functional region of interest in the posterior insula with anatomical structures labeled. Electrode color indicates the difference in Z-scored high-gamma peaks during the speaking and listening conditions (ΔZ). The right hemisphere is cropped to emphasize insula ROI, while the left hemisphere is shown in its entirety due to lower number of electrodes. B, Whole-brain visualization of electrodes with onset responses only during speech perception. Electrode color indicates the peak high-gamma amplitude during the onset response. C, Whole-brain visualization of electrodes with onset responses only during speech production. Electrode color indicates the peak high-gamma amplitude during the onset response. D, Single-electrode activity from posterior insular electrodes highlighting dual onset responses during speech production and perception. The vertical black line indicates the acoustic onset of a sentence. Subplot titles reflect the participant ID, electrode name from the clinical montage, and anatomical ROI. E, Grayscale heatmaps of single-trial electrode activity during a nonspeech motor control task, separated by no vocalization (e.g., “stick your tongue out”) and vocalization (e.g., “say ‘aaaa’”). For vocalization trials, the onset of acoustic activity is visualized relative to the click accompanying the presentation of instructions (pink) and the onset of vocalization (red). F, Strip plot showing the distribution of channel-by-channel onset response peak amplitudes separated by an anatomical region of interest and whether onset responses occur only during perception (left), only during production (center), or during perception and production (right). Electrodes are colored according to the colormaps of (AC). G, Schematic of quantification of onset response for an example electrode (e2, DC5 PSF-PI3). The first contiguous peak of activity >1.5 SD above the mean response constitutes the onset response and is shaded in orange. Peak amplitude values displayed in B, C, and G are indicated. H, Bar plot showing the estimated marginal mean latency of the onset response in three regions of interest: auditory primary (HG + PT), auditory nonprimary (STG + STS), and posterior and inferior insular. Insular onset latency is comparable to primary auditory latency. Brackets indicate significance (* = p < 0.05; ** = p < 0.01). Abbreviations: HG, Heschl's gyrus; STG, superior temporal gyrus; STS, superior temporal sulcus; MTG, middle temporal gyrus; Inf/Sup/Ant/PostCrS, inferior/superior/anterior/posterior circular sulcus of the insula; LGI, long gyrus of the insula; SGI, short gyrus of the insula; PT, planum temporale.
Figure 4.
Figure 4.
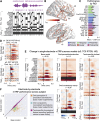
Anatomically distinct onset suppression and dual onset clusters represent a subclass of response profiles to continuous speech production and perception. A, Percent variance explained by cNMF as a function of the total number of clusters in factorization. Threshold of k = 9 factorization plotted as the vertical black line. B, cNMF identifies three response profiles of interest: (c1) onset suppression electrodes, characterized by a suppression of onset responses during speech production and localized to STG/HG; (c2) dual onset electrodes, characterized by the presence of onset responses during perception and production and localized to posterior insula; (c3) prearticulatory motor electrodes, characterized by activity prior to the acoustic onset of stimulus during speech production and localized to ventral sensorimotor cortex. Left, Cluster basis functions for speaking sentences (purple), listening to sentences (green), and intertrial click (pink) for c1, c2, and c3. Center, Right, Two example electrodes from the top 16 weighted electrodes. Subplot titles reflect the participant ID and electrode name from the clinical montage. C, Cropped template brain showing top 50 weighted electrodes for individual clusters (c1, c2, c3). A darker red electrode indicates higher within-cluster weight. D, Individual electrode contribution to dual onset and onset suppression cNMF clusters in both hemispheres. The top 50 weighted electrodes for each cluster are plotted on a template brain with an inflated cortical surface; the dark gray indicates sulci while the light gray indicates gyri. The red electrodes contribute more weight to the “onset suppression” cluster while blue electrodes contribute more to the “dual onset” cluster; the purple electrodes contribute equally to both clusters while the white electrodes contribute to neither. E, Percent similarity of onset suppression (c1) and dual onset (c2) clusters’ top 50 electrodes. The majority of the electrode weighting across these two clusters is nonoverlapping. Abbreviations: STG, superior temporal gyrus; CS, central sulcus. Inf. Ins., inferior insula; Post. Ins, posterior insula.
Figure 5.
Figure 5.
Average response of all clusters in reported cNMF analysis. Nine presented clusters explaining 86% of the variance in the data (Fig. 5A). “Onset suppression” and “dual onset” clusters presented (Fig. 5B) here are labeled as Clusters 2 and 1, respectively, and “prearticulatory motor” cluster presented (Fig. 5B) here is labeled as Cluster 3. The responses plotted are the cluster basis functions of individual clusters relative to either sentence onset (production and perception conditions) or the intertrial click tone (click condition).
Figure 6.
Figure 6.
Playback consistency manipulation yields separate, weaker effects than onset suppression. A, Task schematic showing playback consistency manipulation. Participants read a sentence aloud (purple) and then passively listened to a playback of that sentence (blue) or randomly selected playback of a previous trial (orange). B, Whole-brain visualization of responsiveness to playback consistency. Electrodes are plotted on an inflated template brain; the dark gray indicates sulci while the light gray indicates gyri. Electrodes are colored using a 2D colormap that represents high-gamma amplitude during consistent and inconsistent playback; blue indicates a response during consistent playback but not during inconsistent, orange indicates a response during inconsistent playback but not during consistent playback, pink indicates a response to both playback conditions, and white indicates a response to neither. Most electrodes are pink, indicating strong responses to both conditions. Example electrodes from D are indicated. C, Scatter plot of channel-by-channel peak high-gamma activity during consistent playback (y-axis) and inconsistent playback (x-axis). The vertical black line indicates unity. Color corresponds to a gross anatomical region. Example electrodes from D are indicated. D, Single-electrode plots of high-gamma activity relative to sentence onset (vertical black line). Left column (e1 and e2), Electrodes in the temporal cortex demonstrating a slight preference for inconsistent playback. Right column (e3 and e4), Electrodes in the frontal/parietal cortex demonstrating a slight preference for consistent playback and a larger preference for speech production trials. Abbreviations: HG, Heschl's gyrus; STG, superior temporal gyrus; PreCS, precentral sulcus; Supramar, supramarginal gyrus.
Figure 7.
Figure 7.
Phonological feature tuning is stable during speaking and listening across brain regions. A, Regression schematic. Fourteen phonological features corresponding to place of articulation, manner of articulation, and presence of voicing alongside four features encoding task-specific information (i.e., whether a phoneme took place during a speaking or listening trial, the playback condition during the phoneme) were binarized sample by sample to form a stimulus matrix for use in temporal receptive field modeling. B, Model performance as measured by the linear correlation coefficient (r) between the model's prediction of the held-out sEEG and the actual response plotted at an individual electrode level on an inflated template brain; the dark gray indicates sulci while the light gray indicates gyri. Example electrodes from D and E are indicated. C, Model performance by region of interest. Color corresponds to a gross anatomical region. D, Temporal receptive fields of two example electrodes in the temporal and insular cortex. E, Temporal receptive fields of an example electrode for the four models presented in F. F, Scatter plot of channel-by-channel linear correlation coefficients (r) colored by model comparison. The x-axis shows performance for the “base” model whose schematic is presented in A. The y-axis for each scatterplot shows performance for a modified version of the base model: task features encoding production and perception were removed from the model (yellow); task features encoding consistent and inconsistent playback conditions were removed from the model (cyan); phonological features were separated into production-specific, perception-specific, and combined spaces (magenta). Abbreviations: HG, Heschl's gyrus; PT, planum temporale; STG/S, superior temporal gyrus/sulcus; MTG/S, middle temporal gyrus/sulcus; PreCG/S, precentral gyrus/sulcus; CS, central sulcus; SFG/S, superior frontal gyrus/sulcus; MFG/S, middle frontal gyrus/sulcus; IFG/S, inferior frontal gyrus/sulcus; OFC, orbitofrontal cortex; SPL, superior parietal lobule; PostCG, postcentral gyrus; Ant./Post./Sup./Inf. Ins., anterior/posterior/superior/inferior insula.

Update of

References

    1. Ackermann H, Riecker A (2004) The contribution of the insula to motor aspects of speech production: a review and a hypothesis. Brain Lang 89:320–328. 10.1016/S0093-934X(03)00347-X - DOI - PubMed
    1. Aertsen AM, Johannesma PI (1981) The spectro-temporal receptive field. A functional characteristic of auditory neurons. Biol Cybern 42:133–143. 10.1007/BF00336731 - DOI - PubMed
    1. Appelbaum I (1996) The lack of invariance problem and the goal of speech perception. Proceeding of Fourth International Conference on Spoken Language Processing. ICSLP ‘96, 3, 1541–1544 vol.3. 10.1109/ICSLP.1996.607912 - DOI
    1. Arnal LH, Kleinschmidt A, Spinelli L, Giraud A-L, Mégevand P (2019) The rough sound of salience enhances aversion through neural synchronisation. Nat Commun 10:3671. 10.1038/s41467-019-11626-7 - DOI - PMC - PubMed
    1. Astheimer LB, Sanders LD (2011) Predictability affects early perceptual processing of word onsets in continuous speech. Neuropsychologia 49:3512–3516. 10.1016/j.neuropsychologia.2011.08.014 - DOI - PMC - PubMed

LinkOut - more resources