. 2024 Nov 27;44(48):e0594242024.
doi: 10.1523/JNEUROSCI.0594-24.2024.

Oculomotor Contributions to Foveal Crowding

Affiliations

Oculomotor Contributions to Foveal Crowding

Ashley M Clark et al. J Neurosci. .

Abstract

Crowding, the phenomenon of impaired visual discrimination due to nearby objects, has been extensively studied and linked to cortical mechanisms. Traditionally, crowding has been studied extrafoveally; its underlying mechanisms in the central fovea, where acuity is highest, remain debated. While low-level oculomotor factors are not thought to play a role in crowding, this study shows that they are key factors in defining foveal crowding. Here, we investigate the influence of fixational behavior on foveal crowding and provide a comprehensive assessment of the magnitude and extent of this phenomenon (N = 13 human participants, four males). Leveraging on a unique blend of tools for high-precision eyetracking and retinal stabilization, we show that removing the retinal motion introduced by oculomotor behavior with retinal stabilization, diminishes the negative effects of crowding. Ultimately, these results indicate that ocular drift contributes to foveal crowding resulting in the same pooling region being stimulated both by the target and nearby objects over the course of time, not just in space. The temporal aspect of this phenomenon is peculiar to crowding at this scale and indicates that the mechanisms contributing to foveal and extrafoveal crowding differ.

Keywords: foveola; ocular drift; temporal crowding.


Conflict of interest statement

The authors declare no competing financial interests.

Figures

Figure 1.
Figure 1.
Foveal crowding and the retinal modulations introduced by ocular drift. (A) An example of everyday crowding. While crowding has been mostly studied in the visual periphery, often, as shown here, the input to the central fovea is also cluttered with objects. (B) An example of a typical drift during a 500 ms fixation period. (C) Whereas in the absence of retinal motion the same set of RFs are stimulated by the visual input throughout fixation, as a result of the physiological instability of the eye, a larger number of foveal RGC RFs/cones are stimulated by the same object (in this example a 5′ × 5′ stimulus surrounded by flankers with 1.5′ edge-to-edge spacing, over a 500 ms time period). An eye movement trace from a representative observer in the main experiment was used. Colored regions mark the RGC RFs stimulated by flankers and target, respectively. (D) Probability of each foveal cone being stimulated by both the target and flanker across time. In the absence of retinal motion (left), no cones are stimulated by both the target and flanker as they remain spatially segregated. However, with the introduction of eye jitter, the total number of stimulated cones increases from 300 to 971 and a significant number of cones (25% of the stimulated cones) have high probability of being stimulated by both target and either of the flankers. These estimates have been obtained by recording ocular drift at high resolution with a digital Dual Purkinje-Image (DPI) eyetracker and by shifting the same stimulus used in C according to the recorded drift motion, over the cone mosaic of the observer’s 1 deg retinal region around the preferred retinal locus. The estimates are averages across 500 drift segments of 500 ms each. The retinal image was acquired using a high-resolution Adaptive Optics Scanning Laser Ophthalmoscope (Roorda et al., 2002).
Figure 2.
Figure 2.
Experimental Setup and Paradigm. (A) A digital Dual Purkinje Image eyetracker was used to measure eye motion (Wu et al., 2023). (B) Subjects were instructed to identify high-acuity stimuli presented at the center of the display for 500 ms. Stimuli appeared after a brief period of fixation followed by a 400 ms period in which the display was blank to avoid possible after effects of the central fixation dot. Stimuli, digits in Pelli font (Pelli et al., 2016), varied in size from 0.3′ to 4′. Observers were asked to identify the central digit (the target) among four possible choices. See also Figure 3 showing that with the stimuli used in this experiment critical spacing is constant across a range of different spacing-to-size ratios.
Figure 3.
Figure 3.
Threshold Spacing for different spacing-to-size ratios. In the main experimental setup flanker spacing was a multiple of the stimulus stroke-width. For example, a spacing-to-size ratio of 1.2 indicates that flanker spacing corresponded to the stimulus strokewidth multiplied by 1.2. Here we replicate Pelli et al. (2016) findings, according to which, critical center-to-center spacing remains constant across a range of different spacing-to-size ratios. The same experimental setup as the main experiment was used, with the exception of eyetracking. Different spacing-to-size ratios were tested in blocks. Black dots represent across subjects averages with standard errors and gray dots represent individual subjects (N = 9). As illustrated in this graph, threshold spacing was independent from the spacing-to-size ratio used. Similarly to Pelli et al. (2016), for each observer, we fit a linear regression line for the thresholds measured at each spacing-to-size ratio tested. We find that spacing thresholds and spacing-to-size ratios yield an average slope near 0 (b = 0.005).
Figure 4.
Figure 4.
Behavioral Results. Individual psychometric functions fits for the (A) uncrowded and (B) crowded condition. See also Figure 5 for individual data points on which the psychometric fits were based on and individual threshold comparisons between crowded and uncrowded psychometric fits. Dashed lines indicate the stimulus size width required to perform at threshold (62.5%) performance. Inset Es illustrate the average relative threshold size in terms of Snellen acuity using the tumbling E; average acuity dropped ≈2 lines on the eye chart. (C) Average stimulus size thresholds in the crowded and uncrowded condition. Colored dots represent single subjects. The vertical axis on the right indicates critical spacing thresholds (i.e., center-to-center distance between target and flanker) for the crowded condition. (D) Performance in the crowded and uncrowded conditions expressed as percentage correct responses for a stimulus of the same size.
Figure 5.
Figure 5.
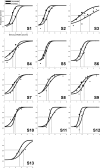
Individual Observers Psychometric Fits. Psychometric fits and performance in the uncrowded (black) and crowded (gray) condition are shown for each individual subject. Dashed lines mark 62.5% thresholds. Markers’ size on the plots is proportional to the number of trials.
Figure 6.
Figure 6.
The effects of retinal stabilization on crowding and acuity. (A) Under conditions of retinal stabilization stimuli are moved on the display (red trace) with minimal delay to compensate for the observer’s fixational eye movements (blue trace), effectively stabilizing the stimulus on the retina (see Methods for detail). (B) Stimulus size at threshold performance under normal viewing and retinally stabilized conditions with an isolated target. Threshold strokewidth values for individual participants (N = 7) in the two conditions are shown in gray. Averages across subjects are shown in black. Error bars are s.e.m. Stimulus size was chosen so that performance was comparable in the stabilized and normal condition ( 73%±9% and 74%±9%, respectively). The asterisk marks a statistically significant difference (paired two-sided t-test, P = 0.007). (C) Nominal critical spacing thresholds plotted for stabilized and unstabilized (normal) viewing conditions. Conventions are the same as in B. When a crowded array is stabilized, critical spacing, the spatial extent of crowding, decreases. Critical spacing is expressed as a multiplier of the stimulus width (nominal spacing) because of the different acuity thresholds characterizing the stabilized and normal viewing conditions. The asterisk indicates a statistically significant difference (two-tailed paired t-test, P = 0.01, N = 7, d = 1.07). See also Figure 7 comparing critical spacing in arcminutes as edge-to-edge and center-to-center.
Figure 7.
Figure 7.
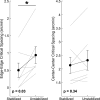
Non-normalized critical spacing thresholds under normal viewing and retinally stabilized conditions. Average and individual (N = 7, gray lines) critical spacing thresholds (edge-to-edge and center-to-center) in the two conditions. Error bars are standard errors. Stimulus size was chosen so that performance was comparable in the stabilized and normal condition. The asterisk marks a statistically significant difference (paired two-sided t-test, P = 0.03, d = 0.64).

References

    1. Ahissar E, Arieli A (2001) Figuring space by time. Neuron 32:185–201. 10.1016/S0896-6273(01)00466-4 - DOI - PubMed
    1. Andersen EE, Weymouth FW (1923) Visual perception and the retinal mosaic. Am J Physiol 64:561–594. 10.1152/ajplegacy.1923.64.3.561 - DOI
    1. Anderson AG, Ratnam K, Roorda A, Olshausen BA (2020) High-acuity vision from retinal image motion. J Vis 20:1–19. 10.1167/jov.20.7.34 - DOI - PMC - PubMed
    1. Andriessen JJ, Bouma H (1976) Eccentric vision: adverse interactions between line segments. Vis Res 16:71–78. 10.1016/0042-6989(76)90078-X - DOI - PubMed
    1. Arend LE (1973) Spatial differential and integral operations in human vision: implications of stabilized retinal image fading. Psychol Rev 80:374–395. 10.1037/h0020072 - DOI - PubMed

LinkOut - more resources