. 2024 Oct 25;15(1):9243.
doi: 10.1038/s41467-024-53675-7.

Nutrient-sensing alteration leads to age-associated distortion of intestinal stem cell differentiating direction

Affiliations

Nutrient-sensing alteration leads to age-associated distortion of intestinal stem cell differentiating direction

Zihua Yu et al. Nat Commun. .

Abstract

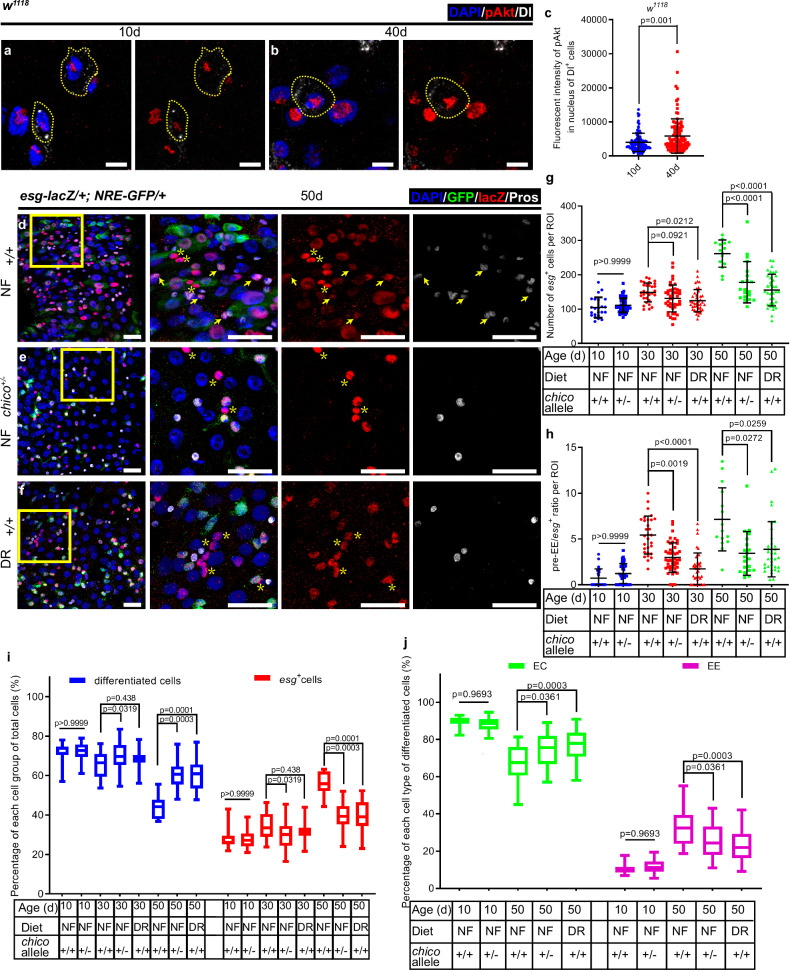
Nutrient-sensing pathways undergo deregulation in aged animals, exerting a pivotal role in regulating the cell cycle and subsequent stem cell division. Nevertheless, their precise functions in governing pluripotent stem cell differentiation remain largely elusive. Here, we uncovered a significant alteration in the cellular constituents of the intestinal epithelium in aged humans and mice. Employing Drosophila midgut and mouse organoid culture models, we made an observation regarding the altered trajectory of differentiation in intestinal stem cells (ISC) during overnutrition or aging, which stems from the erroneous activation of the insulin receptor signaling pathway. Through genetic analyses, we ascertained that the nutrient-sensing pathway regulated the direction of ISC differentiation by modulating the maturation of endosomes and SOX21A transcription factor. This study elucidates a nutrient-sensing pathway-mediated mechanism underlying stem cell differentiation, offering insights into the etiology of stem cell dysfunction in aged animals, including humans.


Conflict of interest statement

The authors declare no competing interests.

Figures

Fig. 1
Fig. 1. Aging alters cellular components in the mammalian intestine epithelium.
ah Immunohistochemistry images of human duodenum section from young (ad) and old (eh) group with Muc2 (a, e), ChgA (b, f), Lyz (c, g), and DCAMKL1 (d, h) staining. it Quantification of the percentage of GCs (i, m, q), EEs (j, n, r), PCs (k, o, s) and TCs (l, p, t) from the young and old group of human duodenum (il) and jejunum (mp) section, and mouse duodenum (qt) samples section. n = 12 (i-l), 8 (mp) and 5 (qt) samples in the young group and n = 7 (il), 5 (mp) and 5 (qt) samples in the old group. u The relative mRNA level of indicated marker genes from duodenum tissue of old and young mice. vx Quantification of organoid survival rate (v), percentage of organoid with normal function indicated by buds number > 3 (w), number of buds per organoid (x) and number of PCs or EEs (y) at day 7 after seeding. Each dot represents repeating times in (vw) and n = 9 in the young group and n = 10 in the old group. Each dot represents one organoid in (xy) and n = 25 (x) and 30 (y) in the young group and n = 30 (x) and 30 (y) in the old group. z The relative mRNA level of indicated marker genes from organoids derived from old and young mice. Each dot represents the mean value of cell percentage from 5 randomly chosen villi (i, j, l, m, n, p, q, r and t) or crypts (k, o, s) in each section. The mRNA level of each gene from young mice was normalized to 1 and each experiment was repeated for 3 times in (u) and (z). Scale bar, 100 μm. Red arrows indicate cells with positive signals. Bars are mean ± SD. Statistics were measured by two-tailed, unpaired student’s t-tests. Source data are provided as a Source Data file. Individual-level data as well as gender and age of human participants are provided in this file.
Fig. 2
Fig. 2. Aging alters intestinal stem cell differentiating direction in Drosophila.
a A model of cell lineage in Drosophila midgut epithelium and the characteristic marker for each cell type was indicated. bd Representative immunofluorescence of midguts with GFP (green), lacZ (red), and Pros (white) staining from 10d (b), 30d (c), and 50d (d) flies (esg-lacZ/+; NRE-GFP/+). e, f Quantification of the number of esg+ cells (e) and esg+Pros+ cells (f) per region of interest (ROI) of midguts in experiments (bd). g The percentage of ISCs, EBs, and Pre-EEs to esg+ cells of midguts in experiments (bd). h The percentage of differentiated cells and esg+ cells to total cells of midguts in experiments (bd). i The percentage of ECs and EEs to total differentiated cells of midguts in experiments (bd). j, k The relative mRNA expression level of EC-specific genes (j) and EE-specific genes (k) from whole midgut in old flies compared with young flies. The mRNA expression level of each gene from young flies was normalized to 1. Each experiment was repeated for 3 times. ROI size 84,100 μm2. DAPI-stained nuclei (blue). Yellow asterisks indicate esg+NRE-Pros ISCs. Yellow arrows indicate esg+Pros+ Pre-EE. Scale bar, 25 μm. For dot plots and (g), bars are mean ± SD. For box plots, box shows median, 25th and 75th percentiles and whiskers represent minima and maxima. Statistics were measured by one-way ANOVA in (ei) and two-tailed, unpaired Student’s t-test in (j, k). Each dot represents one ROI in (e, f). n = 23, 30 and 15 in 10d, 30d, and 50d group, respectively in (ei). Source data are provided as a Source Data file.
Fig. 3
Fig. 3. The InR signaling pathway is responsible for ISC aging phenotype.
a, b Immunofluorescence of midguts with pAkt (red) and Dl (white) staining from 10d (a) and 40d (b) w1118 flies. c Quantification of the fluorescence intensity of pAkt in nuclear of DI-labeled ISCs of midguts in experiments (a, b). Each dot represents one ISC and n = 103 in 10d group and n = 105 in 40d group. df Representative immunofluorescence of midguts with GFP (green), lacZ (red) and Pros (white) staining from 50d control flies raised on normal food (d), 50d chico−/+ flies raised on normal food (e), and 50d flies raised on dietary restriction (DR)-food (f). Flies carrying esg-lacZ/+; NRE-GFP/+ were used as control. Asterisks indicate esg+NRE-Pros- ISCs. Arrows indicate esg+Pros+ Pre-EEs. g Quantification of the number of esg+ cells per ROI with indicated genotypes and treatments. ROI size 84,100 μm2. h The ratio of Pre-EE to total esg+ cells per ROI with indicated genotypes and treatments. i The percentage of differentiated kinds of cells and esg+ cells to total cells with indicated genotypes and treatments. j The percentage of ECs and EEs to total differentiated cells with indicated genotypes and treatments. DAPI-stained nuclei (blue). Yellow frames indicate Dl-labeled ISCs. Yellow asterisks indicate esg+NRE-Pros- ISCs. Yellow arrows indicate esg+Pros+ Pre-EE. Scale bar, 5 μm in (a, b) and 25μm in (df). For dot plots, bars are mean ± SD. For box plots, box shows median, 25th and 75th percentiles and whiskers represent minima and maxima. Statistics were measured by one-way ANOVA. From left to right, n = 23, 48, 30, 45, 40, 15, 20, and 35, respectively in (gi). Each dot represents one ROI in (g, h). j shares the same n number with (gi) in indicated groups. Source data are provided as a Source Data file.
Fig. 4
Fig. 4. Overnutrition alters intestinal stem cell differentiating direction via InR signaling pathway.
a Diagram of the experimental procedure of fly treatment. be Immunofluorescence images of midgut with esg-lacZ (red), NRE-GFP (green), and Pros (white) staining from control flies (esg-lacZ/+; NRE-GFP/+) cultured in NF (b), flies cultured in HSD (c), chico+/− flies cultured in NF (d) and chico+/− flies cultured in HSD (e). f, g Quantification of the number of esg+ cells (f) and the ratio of Pre-EE cells to esg+ cells per ROI (g) with indicated genotypes and food treatments of midguts in experiments (b-e). h The percentage of differentiated cells and esg+ cells to total cells in indicated genotypes and food treatments of midguts in experiments (be). i, j Quantification of the number of esg+NRE-Pros- ISCs (i) and NRE+ EBs (j) per ROI with indicated genotypes of midguts in young Drosophila. k The ratio of Pre-EE cells to esg+ cells per ROI with indicated genotypes of midguts in young Drosophila. l, m Quantification of the number of esg+NRE-Pros- ISCs (l) and NRE+ EBs (m) per ROI with indicated genotypes of midguts in old Drosophila. n The ratio of Pre-EE cells to esg+ cells per ROI with indicated genotypes of midguts in old Drosophila. o The percentage of differentiated cells and esg+ cells to total cells in indicated genotypes of midguts in old Drosophila. DAPI-stained nuclei (blue). ROI size 84,100 μm2. Yellow asterisks indicate esg+NRE-Pros- ISCs. Yellow arrows indicate esg+Pros+ Pre-EE. Scale bar, 25 μm. For dot plots, bars are mean ± SD. For box plots, box shows median, 25th and 75th percentiles and whiskers represent minima and maxima. Each group was compared to the control group in (io). Statistics were measured by one-way ANOVA. Each dot represents one ROI in (f, g) and (in). From left to right, n = 22, 19, 21 and 18, respectively in (fh); n = 18, 19, 35, 23, 16, 17, 17 and 16, respectively in (ik); n = 20, 31, 15 and 16, respectively in (lo). Source data are provided as a Source Data file.
Fig. 5
Fig. 5. Signaling pathway screening reveals downstream candidates responsible for ISC aging phenotype.
a, b Quantification of the number of esg+NREPros ISCs (a) and NRE+ EBs (b) per ROI in 10d flies with indicated genotypes. c The ratio of Pre-EE to total esg+ cells per ROI in 10d flies with indicated genotypes. d The percentage of differentiated cells and esg+ cells to total cells in 10d flies with indicated genotypes. e, f Quantification of the number of esg+NREPros ISCs (e) and NRE+ EBs (f) per ROI in 40d flies with indicated genotypes. The dark dotted line represents the mean value from 10d control flies. g The ratio of Pre-EE to total esg+ cells per ROI in 40d flies with indicated genotypes. The dark dotted line represents the mean value from 10d control flies. h The percentage of differentiated cells and esg+ cells to total cells in 40d flies with indicated genotypes. The purple line represents the mean percentage value of differentiated cells from 10d control flies. The green line represents the mean percentage value of esg+ cells from 10d control flies. i The percentage of ECs and EEs to total differentiated cells in 40d flies with indicated genotypes. The red line represents the mean percentage value of ECs from 10d control flies. The blue line represents the mean percentage value of EEs from 10d control flies. ROI size 84,100 μm. For dot plots, bars are mean ± SD. For box plots, box shows median, 25th and 75th percentiles and whiskers represent minima and maxima. Each group was compared to the control group in all analyses. Statistics were measured by one-way ANOVA. Each dot represents one ROI in (ac) and (eg). From left to right, n = 18, 9, 12, 15, 17, 15, 12, 17, 16, 23, 30, 16 and 25, respectively in (ad), n = 18, 13, 32, 21, 38, 42, 19, 29 and 24, respectively, in (eg) and n = 18, 13, 32, 21, 27, 33, 19, 29 and 24, respectively in (h-i). Source data are provided as a Source Data file.
Fig. 6
Fig. 6. RAB7 regulates ISC differentiating direction downstream of InR.
ad Representative immunofluorescence images of midguts with ISC-GFP (green), NRE-lacZ (red) and Pros (white) staining from 10d flies expressing UAS-GFP (used as control, a), InRCA (b), Rab7CA (c), and InRCA, Rab7CA (d) in driven by ISCts-Gal4. eg Quantification of the number of esg+NREPros ISCs (e), NRE+ EBs (f) and esg+Pros+ pre-EEs (g) per ROI of midguts in experiments (ad). h The ratio of pre-EE cells to esg+ cells per ROI with indicated genotypes of midguts in experiments (ad). i The percentage of differentiated cells and esg+ cells to total cells per ROI in indicated genotypes of midguts in experiments (ad). j The percentage of ECs and EEs to total differentiated cells in indicated genotypes of midguts in experiments (ad). ROI size 84,100 μm2. DAPI-stained nuclei (blue). Yellow arrows indicate esg+Pros+ pre-EE cells. Scale bar, 25 μm. For dot plots, bars are mean ± SD. For box plots, box shows median, 25th and 75th percentiles and whiskers represent minima and maxima. Statistics were measured by one-way ANOVA. Each dot represents one ROI in (eh). From left to right, n = 18, 17, 15, and 15, respectively in (e-j). Source data are provided as a Source Data file.
Fig. 7
Fig. 7. SOX21A is down-regulated in aged flies and functions downstream of InR.
ad Representative immunofluorescence images of midguts from 14d flies (NRE-GFP; Sox21a-HA) without BLM treatment (as mock, a), 40d flies without BLM treatment (b), 14d flies treated with BLM (c), and 40d flies treated with BLM (d). SOX21A was labeled by HA (red). Armadillo (Arm, white) labeled plasma membrane. Yellow arrows indicate EBs. e Quantification of fluorescent intensity of SOX21A-HA in NRE-GFP+ EBs of midguts of experiments (a-d). Each dot represents one NRE-GFP+ EB. From left to right, n = 107, 119, 90, and 98, respectively. fj Representative immunofluorescence of midguts with ISC-GFP (green), NRE-lacZ (red) and Pros (white) staining from 10d flies expressing UAS-GFP (used as control, f), UAS-sox21a RNAi (g), UAS-InRCA (h), UAS-sox21a (i), and UAS-sox21a, UAS-InRCA (j) driven by ISCts-Gal4. Yellow arrows indicate esg+Pros+ pre-EE cells. kl Quantification of the number of esg+NRE-Pros- ISCs (k) and NRE+ EBs (l) per ROI with indicated genotypes of midguts in experiments (fj). m The ratio of pre-EE to total esg+ cells per ROI with indicated genotypes of midguts in experiments (fj). n The percentage of differentiated cells and esg+ cells to total cells with indicated genotypes of midguts in experiments (fj). DAPI-stained nuclei (blue). Scale bar, 10 μm in (ad) and 25 μm in (fj). For dot plots, bars are mean ± SD. For box plots, box shows median, 25th and 75th percentiles and whiskers represent minima and maxima. Statistics were measured by one-way ANOVA. Each dot represents one ROI in (kn). From left to right, n = 18, 15, 18, 15, and 15, respectively in (kn). Source data are provided as a Source Data file.
Fig. 8
Fig. 8. RAB7 is down-regulated in aged human ISCs.
a, b Immunofluorescence images of human duodenum samples section with RAB7 (green) and SOX9 (red) staining from young (a) and old (b) groups. c Quantification of the number of RAB7+ endosomes in SOX9-labeled ISCs of human samples from the young group (n = 45) and the old group (n = 45). Each dot represents one SOX9+ ISC. d, e Schematic of the proposed model. InR is aberrantly upregulated in ISCs upon aging, which leads to reduced differentiation into ECs through the down-regulating RAB7-SOX21A axis. Due to the SC loop, ISCs exhibit a change of differentiating direction. DAPI-stained nuclei (blue). Yellow frames indicate SOX9+ ISCs. Scale bar, 5 μm. Bars are mean ± SD. Statistics were measured by two-tailed, unpaired student’s t-test. Source data are provided as a Source Data file.

References

    1. Fontana, L., Partridge, L. & Longo, V. D. Extending healthy life span—from yeast to humans. Science328, 321–326 (2010). - PMC - PubMed
    1. Hotamisligil, G. S. & Erbay, E. Nutrient sensing and inflammation in metabolic diseases. Nat. Rev. Immunol.8, 923–934 (2008). - PMC - PubMed
    1. Micó, V., Berninches, L., Tapia, J. & Daimiel, L. NutrimiRAging: micromanaging nutrient sensing pathways through nutrition to promote healthy aging. Int. J. Mol. Sci.18, 915 (2017). - PMC - PubMed
    1. Post, Y. & Clevers, H. Defining adult stem cell function at its simplest: the ability to replace lost cells through mitosis. Cell Stem Cell25, 174–183 (2019). - PubMed
    1. Ji, J. et al. Aging in hair follicle stem cells and niche microenvironment. J. Dermatol.44, 1097–1104 (2017). - PubMed

Publication types

MeSH terms

Substances

LinkOut - more resources