. 2024 Oct 25;15(1):9233.
doi: 10.1038/s41467-024-53651-1.

Sugar transporter modulates nitrogen-determined tillering and yield formation in rice

Affiliations

Sugar transporter modulates nitrogen-determined tillering and yield formation in rice

Jinfei Zhang et al. Nat Commun. .

Abstract

Nitrogen (N) fertilizer application ensures crop production and food security worldwide. N-controlled boosting of shoot branching that is also referred as tillering can improve planting density for increasing grain yield of cereals. Here, we report that Sugar Transporter Protein 28 (OsSTP28) as a key regulator of N-responsive tillering and yield formation in rice. N supply inhibits the expression of OsSTP28, resulting in glucose accumulation in the apoplast of tiller buds, which in turn suppresses the expression of a transcriptional inhibitor ORYZA SATIVA HOMEOBOX 15 (OSH15) via an epigenetic mechanism to activate gibberellin 2-oxidases (GA2oxs)-facilitated gibberellin catabolism in shoot base. Thereby, OsSTP28-OSH15-GA2oxs module reduces the level of bioactive gibberellin in shoot base upon increased N supply, and consequently promotes tillering and grain yield. Moreover, we identify an elite allele of OsSTP28 that can effectively promote N-responsive tillering and yield formation, thus representing a valuable breeding target of N use efficiency improvement for agricultural sustainability.


Conflict of interest statement

The authors declare no competing interests.

Figures
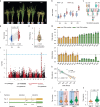
Fig. 1
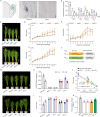
Fig. 1. OsSTP28 locus is associated with tillering response of rice to N supply.
a Phenotype of four parent lines, SAGC-08 (SA), HHZ5-SAL9-Y3-Y1 (HH), BP1976B-2-3-7-TB-1-1 (BP) and PR33282-B-8-1-1-1-1-1(PR), of rice MAGIC population under low nitrogen (LN) or high nitrogen (HN) supply at mature stage. White bars, 20 cm. b Tiller number per plant of four parent varieties under LN or HN supply. Boxes show the first quartile, median, and third quartile; whiskers show the minimum and maximum values. n = 8 individual plants. Different letters indicate significant differences among the treatments (P < 0.05, one-way ANOVA, Tukey’s HSD test). c Pattern diagram of MAGIC population construction by four parents. d Tiller number of 120 MAGIC accessions under LN or HN supply. The dots represent the accessions, lines connect the same accession under LN or HN supply. e Variation of tillering response to N (TRN, the ratio of tiller number between HN and LN). f Manhattan plot for the associations of single nucleic acid polymorphism (SNP) to tiller number under HN on rice whole genome, and the position of 5 candidate genes on rice chromosome 11. Negative log10-transformed P-values from a genome-wide scan were plotted against positions on each of the 12 chromosomes of rice (Oryza sativa L). g TRN and expression response to N (ERN) of OsSTP28. h Correlation between TRN and ERN. The data used for the correlation analyses derived from experiments shown in Fig. 1g. i Natural allelic variation at the promoter region of OsSTP28 in the MAGIC population. The haplotype is referred to as haplotype C (tillering common-response to N, containing 19 lines including SA and BP), and haplotype H (tillering high-response to N, containing 101 lines including HH and PR). Number in yellow or green denotes the number of lines carrying the corresponding allele. j Tiller number of MAGIC lines representing two OsSTP28 haplotypes under LN or HN supply at mature stage. k TRN (HN/LN) of two haplotype lines of MAGIC population. The data used for calculation of TRN derived from experiments shown in Fig. 1j. Significant difference was determined by two-sided Students t-test in d, j and k.
Fig. 2
Fig. 2. Axillary bud located OsSTP28 negatively regulates tillering response of rice to N.
a In situ hybridization of OsSTP28 mRNA in tiller buds. Scale bar, 100 nm. b Relative expression of OsSTP28 responding to different forms and concentrations of N. OsActin1 was used as an internal standard. Data are mean ± SD (n = 4 biological replicates). c Phenotype of WT and stp28 mutants under LN or HN supply. Scale bar, 20 cm. d Tiller number of WT and stp28 lines at different growth stage under LN or HN supply. Data are mean ± SD (n = 7 individual plants). e Tillering response to N of WT and stp28 lines at different developmental stage. Data are mean ± SEM (n = 7 individual plants). In (d, e), asterisks denote significant differences between WT and indicated lines at *P < 0.05 and **P < 0.01 by Dunnett’s multiple tests. f Schematic of transgenic constructs used for the complementation of stp28-3 mutant by expressing OsSTP28(NIP) coding sequence under the control of the different promoters (CSHap.C, proOsSTP28 of SA; CSHap.H, proOsSTP28 of HH). g Representative photographs of WT, stp28-3, CSNC, CSHap.C and CSHap.H under LN or HN supply. CSNC is a negative control with empty vector. Scale bar, 20 cm. OsSTP28 expression abundance (h) and Tiller number (i) in WT, stp28-3, CSNC, CSHap.C and CSHap.H under LN or HN supply. OsActin1 was used as an internal standard. Four independent CSHap.C and CSHap.H complementation lines were tested in this study. Accordingly, in (h), data are mean ± SD (n = 3 biological replicates for WT, stp28-3, and CSNC; n = 12 biological replicates for CSHap.C and CSHap.H). In (i), data are mean ± SD (n = 5 individual plants for WT, stp28-3, and CSNC; n = 20 individual plants for CSHap.C and CSHap.H). j The correlation between tillering number and OsSTP28 expression level of WT, stp28-3, CSNC, CSHap.C and CSHap.H. k TRN of WT, stp28-3, CSNC, CSHap.C and CSHap.H. Data are mean ± SD (n = 5 biological replicates for WT, stp28-3, and CSNC; n = 20 biological replicates for CSHap.C and CSHap.H). In (b, h, i, j, k), different letters indicated significant differences (P < 0.05, one-way ANOVA, Tukey’s HSD test).
Fig. 3
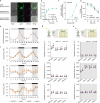
Fig. 3. OsSTP28 as a plasma membrane localized hexose transporter controls N-dependent glucose accumulation at night in apoplast of shoot base.
a Subcellular localization of OsSTP28-eGFP and eGFP-OsSTP28 fusion proteins in rice protoplasts. Scale bars, 10 μm. The results are representative of three independent experiments. b [13C]-glucose transport capacity of OsSTP28 in yeast mutant strain EBY.VW4000. Yeast strains expressing OsSTP28-cDNA or an empty vector were cultured on 100 mM of glucose at pH 5.5. c Glucose influx assay in oocytes. The oocytes were exposed to MBS solution containing 0, 2, 20 (mM) glucose for 2 h, then washed and extracted with H2O. d Glucose efflux assay in oocytes. [13C]-glucose were injected into oocytes and transferred to fresh MBS for 2 h. The external solution was collected after 2 h. In bd, data are mean ± SD (in b and c, n = 5 biological replicates; in (d), n = 3 biological replicates). e Diurnal rhythmic expression of OsSTP28 in shoot. Data are mean ± SD (n = 4 individual seedlings). The samples were collected every 4 h for 2 d. The white and black bars represent light and dark conditions, respectively. f Sucrose, glucose and fructose concentrations in the shoot of WT and stp28 lines. Data are mean ± SD (n = 4 biological replicates). Asterisks denote significant differences between control and indicated treatments at each time point as *P < 0.05 **P < 0.01 according to Dunnett’s multiple test. g, h Apoplastic sucrose, glucose and fructose concentrations in shoot base of WT and stp28 lines at the end of the day (g) and at end of the night (h) in response to N supply. Apoplastic solution was collected by centrifugation of the cells from WT and stp28 mutants, which grown in LN or HN supply respectively for 35 d, calculated with apoplast hydration calculation method and measured by UPLC. Boxes show the first quartile, median, and third quartile; whiskers show the minimum and maximum values. n = 5 biological replicates. Different letters indicate significant differences (P < 0.05, one-way ANOVA, Tukey’s HSD test).
Fig. 4
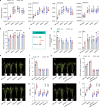
Fig. 4. OsSTP28 functions upstream of GA2-oxidase mediated gibberellin metabolism pathway.
a Expression abundance of OsGA2ox3/5/8/9 in WT and stp28 mutants under LN or HN supply. OsGA2ox3/5/8/9 expression were assessed in shoot bases by qRT-PCR and normalized by OsActin1. Boxes show the first quartile, median, and third quartile; whiskers show the minimum and maximum values. n = 7 individual plants. b Gibberellin 2-oxidase (GA2ox) activities at shoot base of WT and stp28 lines under LN or HN supply. The shoot bases of 35-d-old rice seedlings (WT and stp28 lines) were collected for extracting GA2ox. Data are mean ± SD (n = 5 individual plants). c Schematic representation of the GA2ox catabolic pathway in higher plants. Bioactive GA1 (marked with green background) was inactivated to GA8 (marked with gray background) by GA2ox. d Comparison of the levels of two GA isoforms between WT and stp28 lines under LN or HN supply. ND not detected. Data are mean ± SD (n = 3 individual plants). eg Phenotype (e), GA2ox activities (f) and tiller number (g) of WT and ga2ox5 lines under LN or HN supply. Scale bar, 20 cm. hj Phenotype (h), GA2ox activities (i) and tiller number per plant (j) of WT, stp28-3, ga2ox5-1, and stp28-3/ga2ox5-1 double mutant plants under LN or HN supply. Scale bar, 20 cm. Data in (f, i) represent mean ± SD (n = 4 biological replicates). In (g, j), boxes show the first quartile, median, and third quartile; whiskers show the minimum and maximum values. n = 9 individual plants. In (a, b, d, f, g, i, j), Different letters indicated significant differences (P < 0.05, one-way ANOVA, Tukey’s HSD test).
Fig. 5
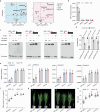
Fig. 5. OSH15, a transcriptional inhibitor, is required for OsSTP28-regulated gibberellin catabolism.
a Volcano plot of DEGs (the marker genes of tiller development) based on RNA-seq data from WT and stp28 mutant (stp28-3 was used for RNA-Seq in this study) under LN or HN supply. down, down-regulated genes; up, up-regulated genes; No Diff, no significant difference. b Expression abundances of OSH15 in WT, stp28 lines under LN or HN supply. Data are mean ± SD (n = 5 biological replicates). c OSH15 directly binds to motif regions of OsGA2ox3/5/8/9 promoter in EMSA. OSH15 binding site was indicated with red triangle in the respectively promoter model. The results are representative of three independent experiments. d Transactivation assays. OSH15 displays transcriptional repression activity to GA2ox3/5/8/9 promoter-LUC in rice protoplasts. Data are mean ± SD (n = 9 biological replicates. Significant difference was determined by two-sided Students t-test. e Expression abundance of OsGA2ox3/5/8/9 in WT and osh15 lines under LN or HN supply. Data are mean ± SD (n = 4 biological replicates). fh, GA2ox activities (f), phenotype (g) and tiller number (h) and of WT and osh15 lines under LN or HN supply. In f, h, boxes show the first quartile, median, and third quartile; whiskers show the minimum and maximum values. n = 4 biological replicates in (f), and n = 9 individual plants in (h). Scale bar, 20 cm. In (b, e, f, h), Different letters indicated significant differences (P < 0.05, one-way ANOVA, Tukey’s HSD test).
Fig. 6
Fig. 6. Elite allele of OsSTP28 contributes to improvement of N-responsive yield formation and N use efficiency in rice.
ae Phenotype (a), panicle number (b), grain number per panicle (c), 1000-grain weight (d), yield per plant (e) and N use efficiency (NUE) (f) in WT, stp28-3, CSNC, CSHap.C and CSHap.H at mature stage under LN or HN supply in Nanjing in 2023. Scale bar = 3.5 cm in (a). Four independent CSHap.C and CSHap.H complementation lines were tested in this study. Accordingly, in (bf), boxes show the first quartile, median, and third quartile; whiskers show the minimum and maximum values. n = 7 individual plants for WT, stp28-3, and CSNC; n = 28 individual plants for CSHap.C and CSHap.H. Different letters indicate significant differences at P < 0.05 according to one-way ANOVA and Tukey’s HSD test. g, h Phenotype, tiller number and grain yield per plant in MH63 (Ming Hui 63, containing OsSTP28Hap. C allele) and stp28MH63 lines (g), or in GLA4 (Guang Lu Ai 4, containing OsSTP28Hap. H allele) and stp28GLA4 lines (h) under LN or HN supply. Scale bar = 20 cm in (g, h). In (g, h), boxes show the first quartile, median, and third quartile; whiskers show the minimum and maximum values. n = 11 individual plants. Different letters indicate significant differences at P < 0.05 according to one-way ANOVA and Tukey’s HSD test.
Fig. 7
Fig. 7. Working model of OsSTP28-glucose mediated tillering pathway.
N supply negatively regulates the expression of OsSTP28 to generate glucose accumulation in tiller buds, which in turn silences the expression of a transcriptional factor OSH15 via H3K27me3 modification to active GA2-oxidases catalyzed GA catabolism in shoot base. OsSTP28-OSH15-GA2oxs module reduces the level of bioactive gibberellin in shoot base under increased N supply, and consequently stimulates tillering.

References

    1. Xu, G., Fan, X. & Miller, A. J. Plant nitrogen assimilation and use efficiency. Annu Rev. Plant Biol.63, 153–182 (2012). - PubMed
    1. Liu, Q. et al. Improving crop nitrogen use efficiency toward sustainable green revolution. Annu. Rev. Plant Biol.73, 523–551 (2022). - PubMed
    1. Hu, B., Wang, W., Chen, J., Liu, Y. & Chu, C. Genetic improvement toward nitrogen-use efficiency in rice: Lessons and perspectives. Mol. Plant16, 64–74 (2023). - PubMed
    1. Guo, J. H. et al. Significant acidification in major Chinese croplands. Science327, 1008–1010 (2010). - PubMed
    1. Sutton, M. A. et al. Too much of a good thing. Nature472, 159–161 (2011). - PubMed

Publication types

MeSH terms

LinkOut - more resources