. 2024 Oct 25;15(1):9231.
doi: 10.1038/s41467-024-53522-9.

Isolated theta waves originating from the midline thalamus trigger memory reactivation during NREM sleep in mice

Affiliations

Isolated theta waves originating from the midline thalamus trigger memory reactivation during NREM sleep in mice

Qin Xiao et al. Nat Commun. .

Abstract

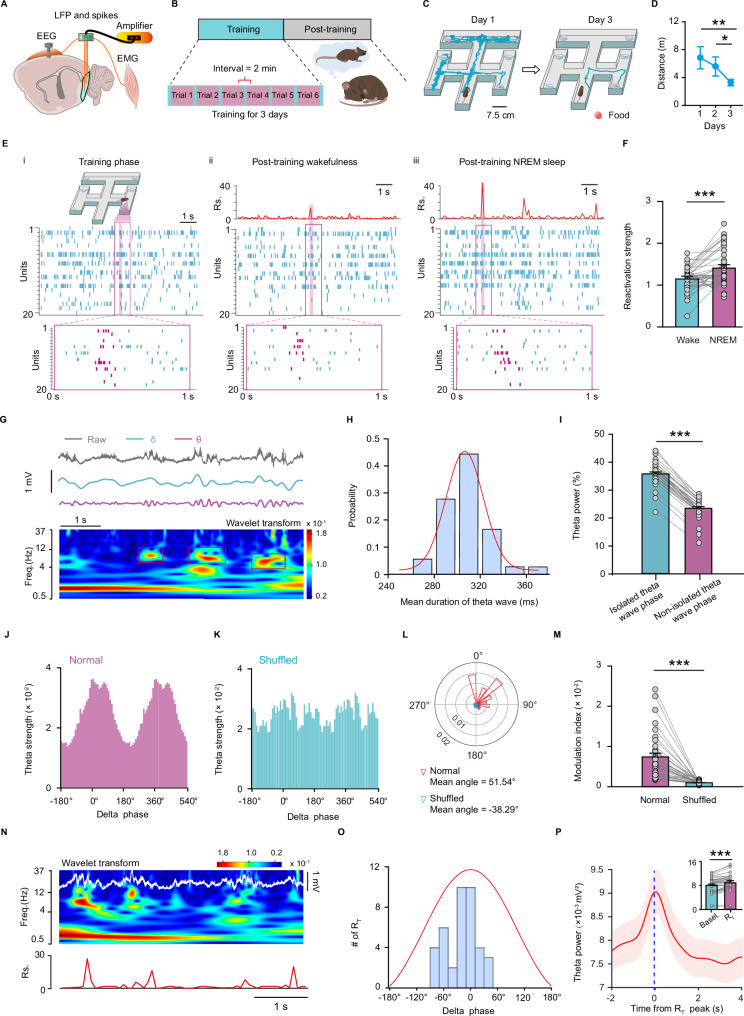
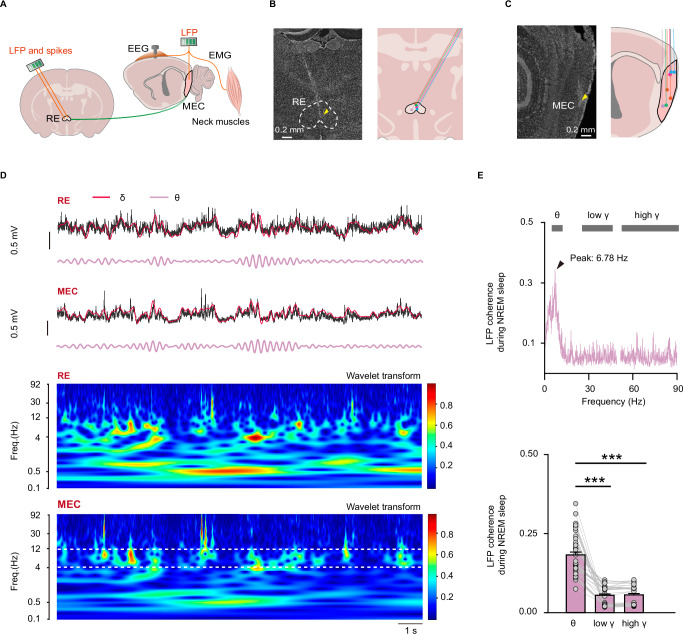
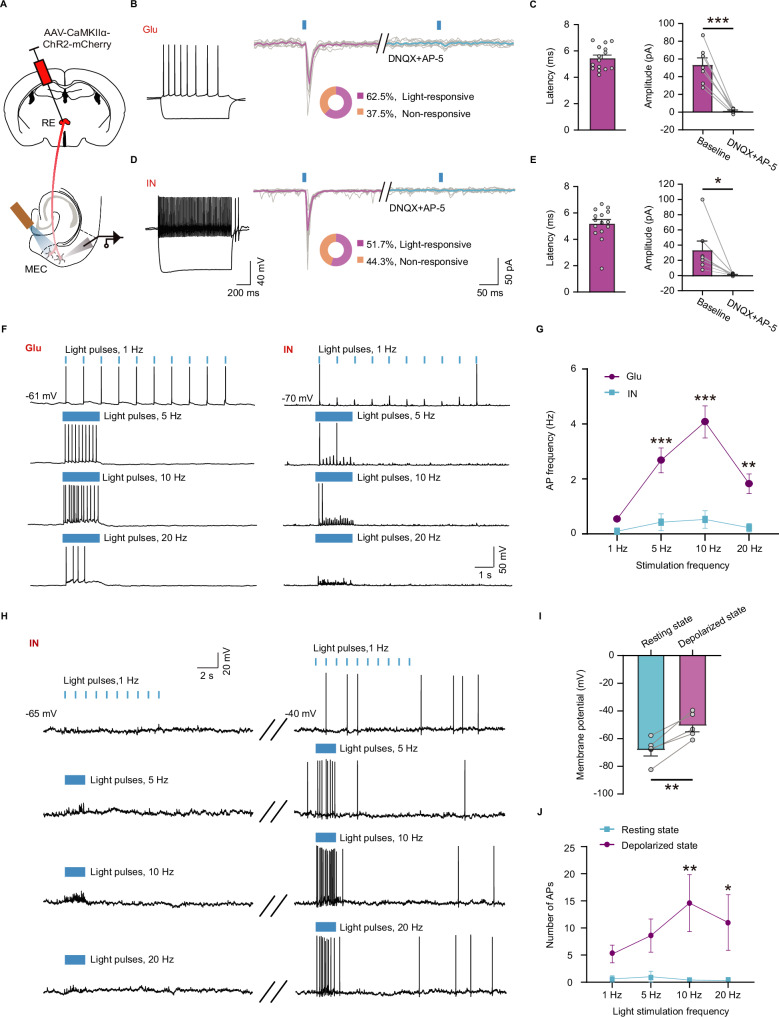
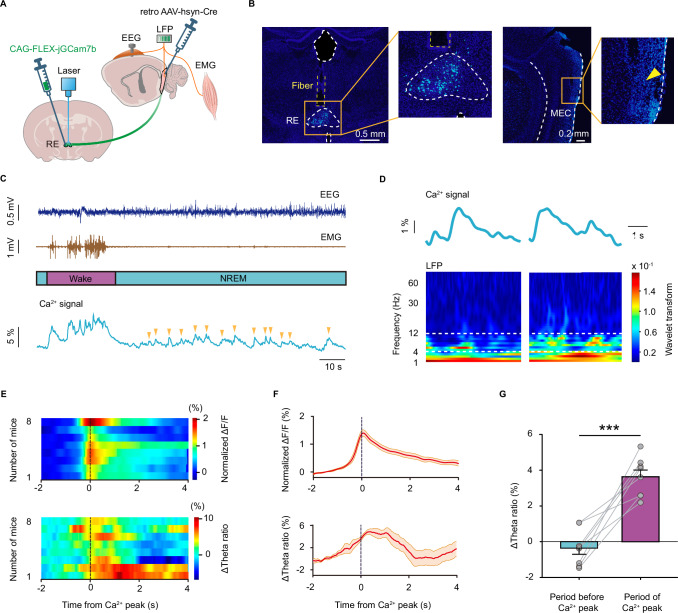
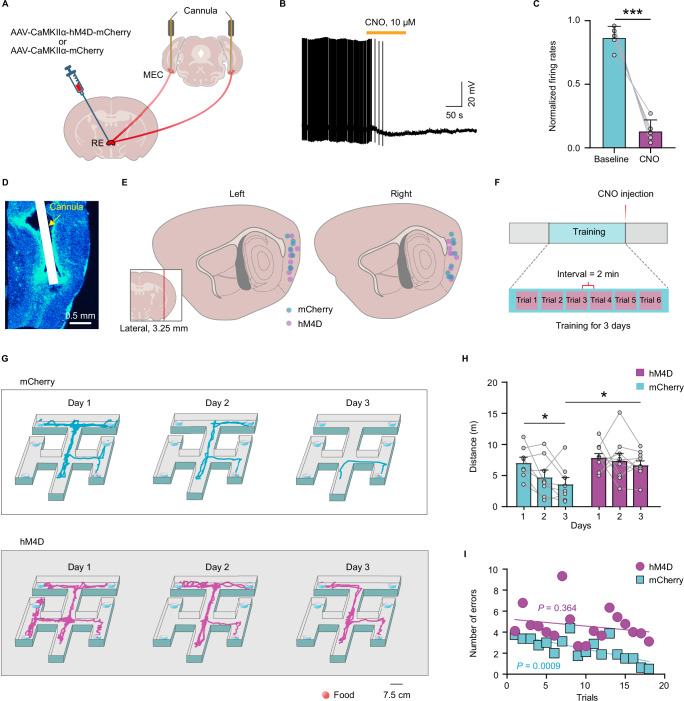
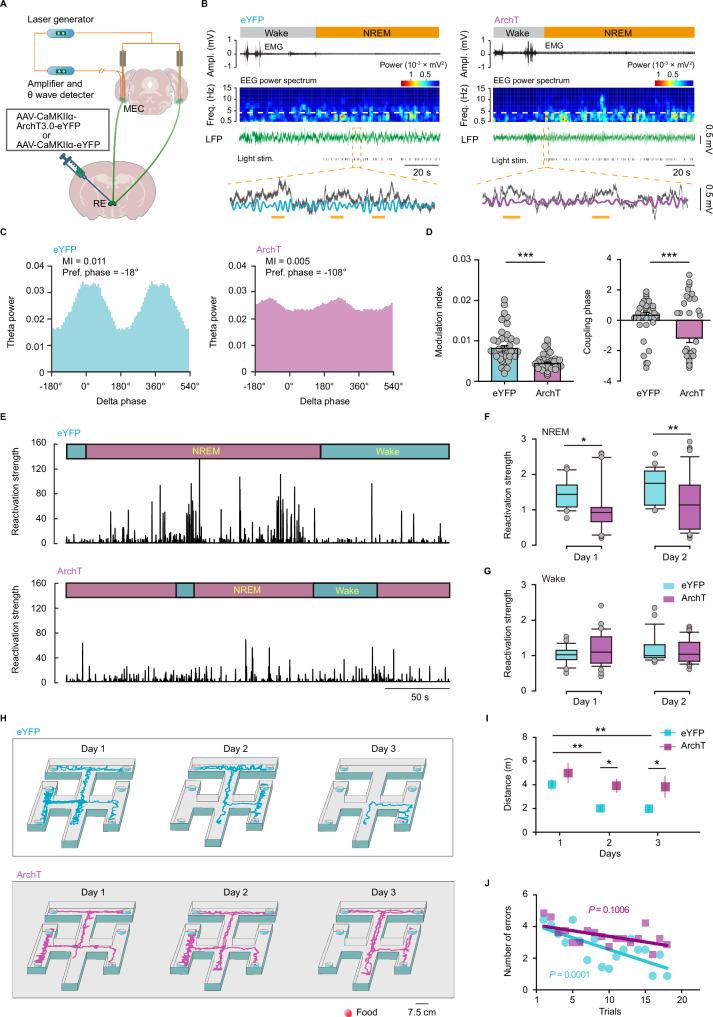
During non-rapid eye movement (NREM) sleep, neural ensembles in the entorhinal-hippocampal circuit responsible for encoding recent memories undergo reactivation to facilitate the process of memory consolidation. This reactivation is widely acknowledged as pivotal for the formation of stable memory and its impairment is closely associated with memory dysfunction. To date, the neural mechanisms driving the reactivation of neural ensembles during NREM sleep remain poorly understood. Here, we show that the neural ensembles in the medial entorhinal cortex (MEC) that encode spatial experiences exhibit reactivation during NREM sleep. Notably, this reactivation consistently coincides with isolated theta waves. In addition, we found that the nucleus reuniens (RE) in the midline thalamus exhibits typical theta waves during NREM sleep, which are highly synchronized with those occurring in the MEC in male mice. Closed-loop optogenetic inhibition of the RE-MEC pathway specifically suppressed these isolated theta waves, resulting in impaired reactivation and compromised memory consolidation following a spatial memory task in male mice. The findings suggest that theta waves originating from the ventral midline thalamus play a role in initiating memory reactivation and consolidation during sleep.


Conflict of interest statement

The authors declare no competing interests.

Figures

Fig. 1
Fig. 1. Reactivation of MEC cells manifests isolated theta waves during NREM sleep.
A, B Schematic diagram depicting LFP and EEG-EMG recording (A), and spatial memory task (B). C Representative trajectories on first and third day training sessions. D Distance that animals traveled in the maze (one-way repeated measures ANOVA followed by post hoc Fisher LSD Method, n = 6 mice, F2,5 = 7.069, P = 0.012; day 1 vs. day 3, P = 0.004; day 1 vs. day 2, P = 0.224; day 2 vs. day 3, P = 0.037). E MEC neuronal activity recorded during training phase (i), post-training wakefulness (ii) and post-training NREM sleep (iii) with a magnified view of a firing pattern (marked by magenta color). F Comparison of reactivation strength (two-tailed paired t test, n = 39 trials from 6 mice, t38 = −3.692, P = 0.000695). G LFP and corresponding power spectrum during NREM sleep. Isolated theta waves are indicated by red rectangle box. H Distributions of mean duration of isolated theta waves. I Percentage of theta power during isolated theta wave and non-isolated theta wave phases (Wilcoxon Signed Rank Test, n = 36 channels from 6 mice, Z = −5.243, P = 1.24 × 10−7). J, K Coupling of isolated theta power and delta phase. L Distribution of isolated theta waves in relation to the delta phase. M Modulation index for normal and shuffled data (Wilcoxon signed-rank test, n = 36 channels from 6 mice during post-training NREM sleep, Z = −5.232, P = 1.68 × 10−7). N Raw LFP trace, corresponding power spectrum and reactivation strength (Rs.). Freq., frequency. O Distribution of reactivation events (RT) during delta phase and a normal distribution fit to this distribution (red curve). P Theta power around the peak of reactivation strength. Inset, comparison of theta power in the period of RT and baseline (Basal.) (Two tailed paired t test, n = 39 trials, t38 = −8.998, P = 5.90×10⁻¹¹). *P < 0.05, **P < 0.01, ***P < 0.001. Data are presented as mean ±  s.e.m. Source data are provided as a Source Data file.
Fig. 2
Fig. 2. RE displays typical theta waves that synchronize with MEC theta oscillations.
A Schematic of in vivo multi-channel synchronous recording in the RE and MEC, combined with EEG-EMG recording. B, C Images showing the electrode implanted in the RE (B) and MEC (C) (n = 5 mice). D Simultaneous recording of LFP (gray: raw trace; red: filtered delta; magenta: filtered theta) and corresponding power spectrum in the RE (top) and MEC (bottom) during NREM sleep. The range between two white dashed lines is the theta band in the MEC LFP power spectrum. E Diagram showing LFP coherence in different bands between RE and MEC during NREM sleep (top). Peak of LFP coherence (black arrowhead) is at the theta band. Comparison of LFP coherence in the RE and MEC during NREM sleep (bottom) (Friedman repeated measures ANOVA on ranks followed by post hoc Student–Newman–Keuls test, n = 51, theta vs low gamma: q = 8.317, P = 1.55 × 10−9; theta vs high gamma: q = 6.832, P = 1.54 × 10−9; low gamma vs high gamma: q = −1.485, P = 0.412). ***P < 0.001. Data are presented as mean ± s.e.m. Source data are provided as a Source Data file.
Fig. 3
Fig. 3. MEC integrates monosynaptic excitatory inputs from RE neurons.
A Scheme for recording the evoked postsynaptic responses. B Left, electrophysiological property of glutamatergic neurons (Glu). Right, optostimulation evokes EPSCs in glutamatergic neuron in the presence (cyan trace) and absence (magenta trace) of DNQX and AP-5, and proportion of neurons that responded to stimulation of RE inputs. C Left, latency of glutamatergic neurons in response to light-stimulated RE inputs. Right, amplitude of the evoked EPSCs in the presence and absence of DNQX and AP-5 (Two tailed paired t test, t6 = 7.227, n = 7 cells, P = 0.0004). D Same as (B) but for MEC GABAergic interneurons (IN). E Left, latency of MEC GABAergic interneurons in response to light-stimulated RE inputs. Right, same as (C) but for GABAergic interneurons (Wilcoxon signed-rank test, n = 7 cells, Z = −2.336, P = 0.016). F Sample traces showing responses of glutamatergic neurons (left) and GABAergic interneurons (right) to light pulses. G Frequency of action potentials (AP) evoked by light pulses of glutamatergic neuron (magenta, n = 10 cells) and GABAergic interneuron (cyan, n = 10 cells) (Two-way Repeated Measures ANOVA followed by post hoc Bonferroni t test, Glu vs IN, F1,18 = 21.045, P = 0.00131; stimulation frequency factor, F3,54 = 40.945, P = 3.48 × 10−10; interaction, F3,54 = 14.707, P = 7.18 × 10−6). H Responses of GABAergic interneurons evoked by light pulses with voltage holding at −65 mV (left) or −40 mV (right). I Membrane potential of GABAergic interneurons when holding at resting states or depolarized states (two-tailed paired t test, n = 5 cells, t4 = −6.692, P = 0.0026). J Number of action potentials evoked by light stimulation (Scheirer–Ray–Hare test followed by post hoc Holm-Sidak method, n = 5 cells; resting state vs. depolarized state, H = 6.524, P = 7.51×10⁻¹¹; stimulation frequency factor, H = 0.125, P = 0.632; interaction, H = 0.183, P = 0.48). *P < 0.05, **P < 0.01, ***P < 0.001. Data are presented as mean ± s.e.m. Source data are provided as a Source Data file.
Fig. 4
Fig. 4. MEC isolated theta waves are positively correlated with increase in the activities of RE neurons projecting to the MEC.
A Diagram for simultaneously fiber photometry recording of RE neurons projecting to MEC as well as LFP recordings in the MEC. B Representative image showing the expression of jGCamp7b (green) and the optical fiber (dotted yellow pane) implanted in the RE (left) and the electrode implanted in the MEC (right, yellow arrowhead), and related enlarged view. C Representative raw EEG-EMG traces, color-coded hypnogram, and Ca2+ signals from a RE-MECjGCamp7b mouse. D Two examples showing synchronous recordings of Ca2+ activity of RE neurons projecting to MEC (top) and LFP in the MEC (bottom) during NREM sleep. Between two dotted white lines is theta frequency band (4–12 Hz). E Heatmaps illustrating synchronous change of Ca2+ activity of RE neurons projecting to MEC (top) and increment of theta/(delta + theta) ratio (ΔTheta ratio, bottom) around Ca2+ peak (0 s) during NREM sleep (n = 8 mice). F Average value of synchronous change of Ca2+ activity (top) and ΔTheta ratio (bottom) from 8 mice displayed as (E). Data are presented as mean (red line) ± s.e.m. (shaded area). G Statistic analysis of ΔTheta ratio before and during the period of Ca2+ peak (two-tailed paired t test, n = 8 mice, t7 = −6.672, P = 0.000285). ***P < 0.001. Data are presented as mean ± s.e.m. Source data are provided as a Source Data file.
Fig. 5
Fig. 5. Chemogenetic inhibition of RE-MEC pathway after training impaired spatial memory.
A Schematic of chemogenetic inhibition of RE-MEC pathway. B Representative trace showing the inhibitory effect of CNO (10 μM, 2 min) on the firing activities of an example hM4D-expressing RE neuron projecting to MEC. C Bath application of CNO suppressed the firing rates of the RE neurons (Two tailed paired t test, t4 = 9.396, n = 5 cells, P = 0.000715). D Representative sagittal section showing the cannula implanted in the MEC. E Microinjection sites were depicted as filled cyan (mCherry) or magenta (hM4D) circles for the tested mice. F Experimental design of CNO-induced chemogenetic inhibition of RE-MEC pathway combined with the spatial memory task. G Representative trajectories of the mice in the mCherry (top) or hM4D (bottom) group searching for food in the six-arm maze. H The distance that animals of the mCherry and hM4D groups traveled in the maze to acquire food each day (two-way repeated measures ANOVA followed by post hoc Bonferroni t test, n = 8 mice for mCherry group, n = 9 mice for hM4D group; mCherry vs hM4D, F1, 15 = 4.696, P = 0.047; days factor: F2, 30 = 4.510, P = 0.019; interaction, F2, 30 = 1.194, P = 0.317). I Average number of errors that animals in the mCherry and hM4D groups made when searching for food during 6 trials each day. Cyan circles or magenta blocks represent mean value for each trial of mCherry (n = 8 mice) or hM4D group (n = 9 mice). Trend lines are the least-square fits to the data. *P < 0.05, ***P < 0.001. Data are presented as mean ± s.e.m. Source data are provided as a Source Data file.
Fig. 6
Fig. 6. RE triggers isolated theta waves required for memory consolidation.
A Schematic of closed-loop optogenetic inhibition. B Representative EMG traces, EEG power spectrum and LFP. Enlarged view shows LFP (gray), filtered LFP in theta band (Cyan: eYFP group; magenta: ArchT group). Ampl. amplitude, Freq. frequency, Light stim. light stimulation. C Theta power-delta phase coupling. M.I. modulation index, Pref. phase preferred phase. D Modulation index (left, Mann–Whitney rank-sum test, eYFP: n = 44, ArchT: n = 42, U = 364, P = 1.00 × 10−6) and phase (right, Welch’s t test, eYFP: n = 44, ArchT: n = 42, t69.535 = 4.320, P = 5.08 × 10−5) of theta-delta wave coupling. E Reactivation strength of the eYFP and ArchT group. F Boxplots showing reactivation strength during NREM sleep. Boxplots represent median plus minima and maxima with lower and upper quantiles; whiskers, one and a half times of interquartile range; points, outliers (Kruskal–Wallis one-way ANOVA on ranks, H = 21.403, P = 8.7 × 10−5; Day 1: eYFP: n = 27, ArchT: n = 38, H = 3.004, P = 0.016; Day 2: eYFP: n = 28, ArchT: n = 49, H = 3.189, P = 0.008). G Same as F but for post-training wakefulness (Kruskal–Wallis one-way ANOVA on ranks, H = 1.653, P = 0.647; Day 1: eYFP: n = 27, ArchT: n = 38, Day 2: eYFP: n = 28, ArchT: n = 49). H Representative trajectories in eYFP and ArchT group. I Distance traveled in the maze (Two-way Repeated Measures ANOVA following post hoc Fisher LSD Method, eYFP: n = 9 mice, ArchT: n = 8 mice. eYFP vs. ArchT, F1,15 = 5.706, P = 0.030; days factor, F2, 30 = 8.284, P = 0.001; interaction, F2, 30 = 0.720, P = 0.495). J Cyan circles or magenta blocks represent average number of errors of eYFP (n = 9 mice) or ArchT group (n = 8 mice). Trend lines are the least-square fits to the data. *P < 0.05, **P < 0.01, ***P < 0.001. Data are presented as mean ± s.e.m. Source data are provided as a Source Data file.

References

    1. Buzsaki, G. The hippocampo-neocortical dialogue. Cereb. Cortex6, 81–92 (1996). - DOI - PubMed
    1. Buzsaki, G. & Moser, E. I. Memory, navigation and theta rhythm in the hippocampal-entorhinal system. Nat. Neurosci.16, 130–138 (2013). - DOI - PMC - PubMed
    1. Colgin, L. L. Rhythms of the hippocampal network. Nat. Rev. Neurosci.17, 239–249 (2016). - DOI - PMC - PubMed
    1. Liao, Y. et al. Spatial memory requires hypocretins to elevate medial entorhinal gamma oscillations. Neuron112, 155–173.e158 (2024). - DOI - PubMed
    1. Chen, Q. H. et al. Histamine enhances theta-coupled spiking and gamma oscillations in the medial entorhinal cortex consistent with successful spatial recognition. Cereb. Cortex28, 2439–2457 (2018). - DOI - PubMed

Publication types

LinkOut - more resources