

The need for high-resolution gut microbiome characterization to design efficient strategies for sustainable aquaculture production
- PMID: 39455736
- PMCID: PMC11511968
- DOI: 10.1038/s42003-024-07087-4
The need for high-resolution gut microbiome characterization to design efficient strategies for sustainable aquaculture production
Abstract
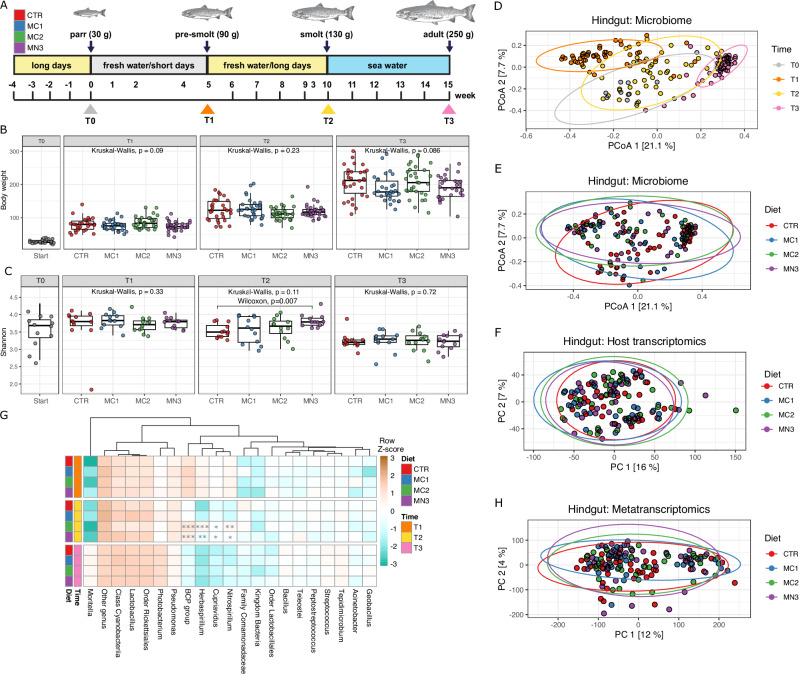
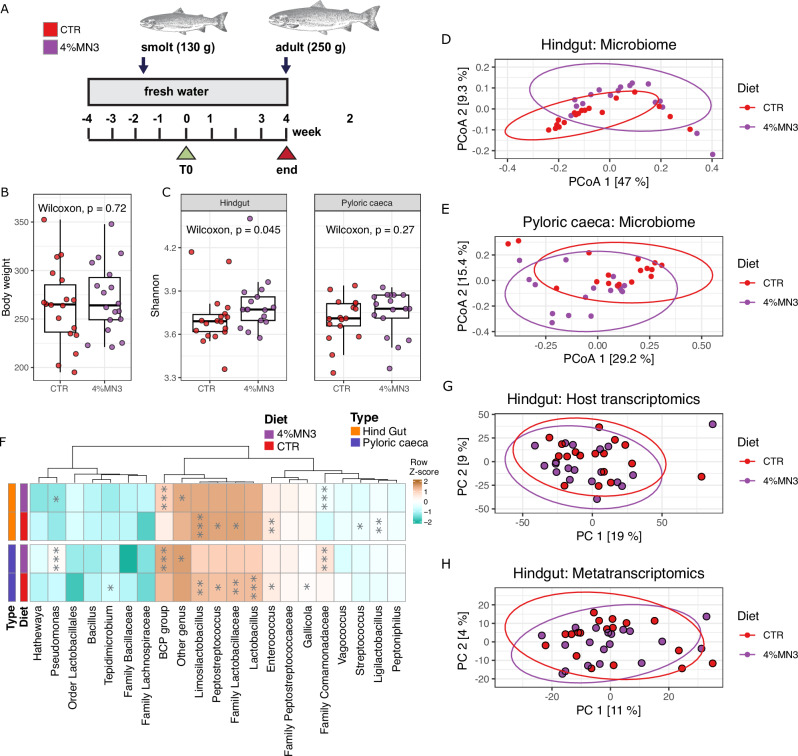
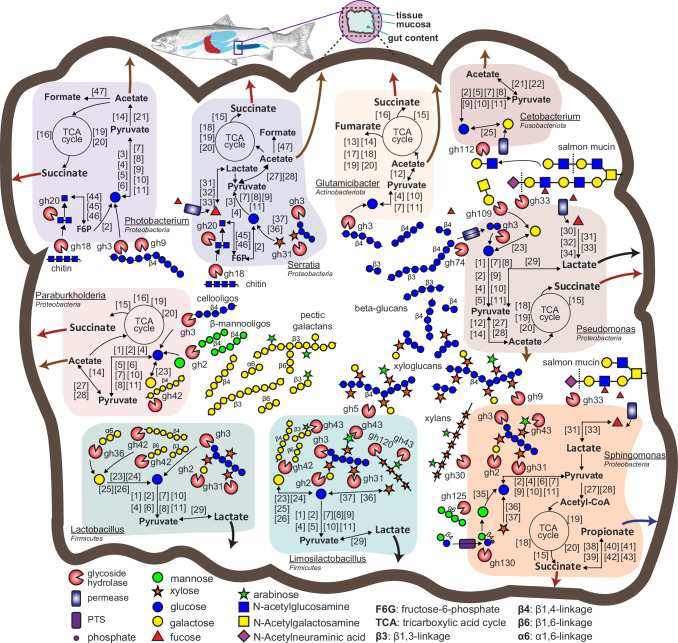
Microbiome-directed dietary interventions such as microbiota-directed fibers (MDFs) have a proven track record in eliciting responses in beneficial gut microbes and are increasingly being promoted as an effective strategy to improve animal production systems. Here we used initial metataxonomic data on fish gut microbiomes as well as a wealth of a priori mammalian microbiome knowledge on α-mannooligosaccharides (MOS) and β-mannan-derived MDFs to study effects of such feed supplements in Atlantic salmon (Salmo salar) and their impact on its gut microbiome composition and functionalities. Our multi-omic analysis revealed that the investigated MDFs (two α-mannans and an acetylated β-galactoglucomannan), at a dose of 0.2% in the diet, had negligible effects on both host gene expression, and gut microbiome structure and function under the studied conditions. While a subsequent trial using a higher (4%) dietary inclusion of β-mannan significantly shifted the gut microbiome composition, there were still no biologically relevant effects on salmon metabolism and physiology. Only a single Burkholderia-Caballeronia-Paraburkholderia (BCP) population demonstrated consistent and significant abundance shifts across both feeding trials, although with no evidence of β-mannan utilization capabilities or changes in gene transcripts for producing metabolites beneficial to the host. In light of these findings, we revisited our omics data to predict and outline previously unreported and potentially beneficial endogenous lactic acid bacteria that should be targeted with future, conceivably more suitable, MDF strategies for salmon.
© 2024. The Author(s).
Conflict of interest statement
B.S., V.C., R.K. and S.S. are employed at Cargill Group, who produces, markets and sells fish feed supplements with some of the ingredients tested in the current investigation. Furthermore, Cargill provided parts of the funding for the fish trials. S.L.L.R. is an Editorial Board Member for Communications Biology, but was not involved in the editorial review of, nor the decision to publish this article. All other authors declare no competing interests.
Figures
Similar articles
-
Deploying an In Vitro Gut Model to Assay the Impact of the Mannan-Oligosaccharide Prebiotic Bio-Mos on the Atlantic Salmon (Salmo salar) Gut Microbiome.Microbiol Spectr. 2022 Jun 29;10(3):e0195321. doi: 10.1128/spectrum.01953-21. Epub 2022 May 9. Microbiol Spectr. 2022. PMID: 35532227 Free PMC article.
-
Influence of Fishmeal-Free Diets on Microbial Communities in Atlantic Salmon (Salmo salar) Recirculation Aquaculture Systems.Appl Environ Microbiol. 2016 Jul 15;82(15):4470-4481. doi: 10.1128/AEM.00902-16. Print 2016 Aug 1. Appl Environ Microbiol. 2016. PMID: 27129964 Free PMC article.
-
Interpopulation Variation in the Atlantic Salmon Microbiome Reflects Environmental and Genetic Diversity.Appl Environ Microbiol. 2018 Aug 1;84(16):e00691-18. doi: 10.1128/AEM.00691-18. Print 2018 Aug 15. Appl Environ Microbiol. 2018. PMID: 29915104 Free PMC article.
-
Understanding the role of the shrimp gut microbiome in health and disease.J Invertebr Pathol. 2021 Nov;186:107387. doi: 10.1016/j.jip.2020.107387. Epub 2020 Apr 21. J Invertebr Pathol. 2021. PMID: 32330478 Review.
-
Carbohydrates great and small, from dietary fiber to sialic acids: How glycans influence the gut microbiome and affect human health.Gut Microbes. 2021 Jan-Dec;13(1):1-18. doi: 10.1080/19490976.2020.1869502. Gut Microbes. 2021. PMID: 33615984 Free PMC article. Review.
References
-
- Colombo, S. M. et al. Towards achieving circularity and sustainability in feeds for farmed blue foods. Rev. Aquac.15, 1115–1141 (2023).
-
- Nagappan, S. et al. Potential of microalgae as a sustainable feed ingredient for aquaculture. J. Biotechnol.341, 1–20 (2021). - PubMed
-
- La Rosa, S. L. et al. Glycan processing in gut microbiomes. Curr. Opin. Microbiol67, 102143 (2022). - PubMed
-
- Wang, J. et al. Microbiota in intestinal digesta of Atlantic salmon (Salmo salar), observed from late freshwater stage until one year in seawater, and effects of functional ingredients: a case study from a commercial sized research site in the Arctic region. Anim. Microbiome3, 14 (2021). - PMC - PubMed
-
- Torrecillas, S., Montero, D. & Izquierdo, M. Improved health and growth of fish fed mannan oligosaccharides: potential mode of action. Fish. Shellfish Immunol.36, 525–544 (2014). - PubMed
MeSH terms
Substances
LinkOut - more resources
Full Text Sources
