. 2024 Oct 25;14(1):25403.
doi: 10.1038/s41598-024-76292-2.

Frozen no more, a case study of Arctic permafrost impacts of oil and gas withdrawal

Affiliations

Frozen no more, a case study of Arctic permafrost impacts of oil and gas withdrawal

Kimberley Miner et al. Sci Rep. .

Abstract

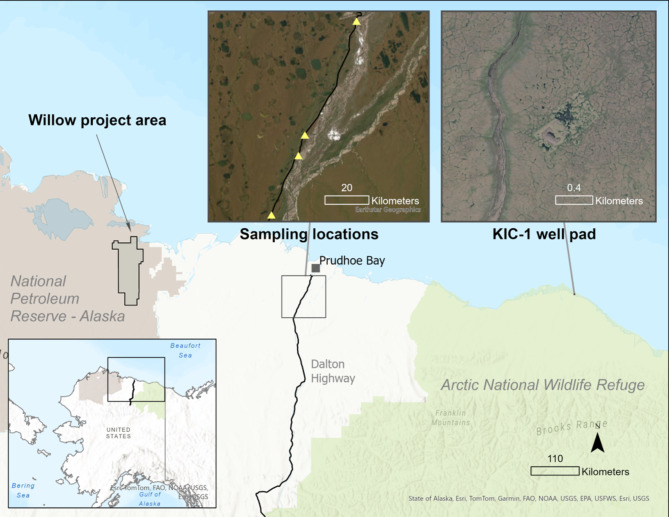
Approximately 8100 km2 of Alaska are leased to the oil and gas industry for exploration and extraction. According to industry estimates, subsurface expansion from these leases could cover up to 130.2 km2 per pad. As industrial oil extraction activities increase across the thawing Alaskan permafrost, impacts on the permafrost environment will include rapid thaw, increased hydrological flux, and the release of climate warming greenhouse gases. Here, we use remote sensing and field observations to provide a first-order comparison of the direct impacts to the permafrost tundra from oil well pads, and the long-term consequences of a legacy oil pads on the warming North Slope of Alaska. We find that oil well pads on the permafrost accelerate permafrost degradation and persist despite remediation.


Conflict of interest statement

The authors declare no competing interests.

Figures

Fig. 1
Fig. 1
Map of sampling locations from this paper, the remediated KIC-1 pad and the proposed Willow Project development area. Credit for background image of sampling location is Esri, Maxar, Earthstar Geographics, and the GIS User Community. Credit for the background imagery of KIC-1 is Maxar Products, Dynamic Mosaic © 2020 Maxar Technologies Inc., Alaska Geospatial Office, USGS. Figure was prepared using ArcGIS Pro 3.1.0 Copyright © 2023 Esri Inc. https://www.esri.com/en-us/arcgis/products/arcgis-pro/resources.
Fig. 2
Fig. 2
Soil temperature and pH data from sampled locations along the Dalton Highway illustrating the stabilizing temperature, soil moisture and pH gradients at 5 cm and 15 cm depth, and increased distance from pad. The full dataset is available in the supplementary information.
Fig. 3
Fig. 3
a AVIRIS-NG Reflectance at KIC-1 acquired on August 4, 2022, show significant permafrost degradation within the original well pad borders and accelerated degradation in the adjacent tundra despite remediation best practices. Airborne imaging spectroscopy data were downloaded free-of-charge from the AVIRIS-NG data portal at: https://avirisng.jpl.nasa.gov/dataportal/. Figure were prepared using ENVI Classic Version 5.6: https://www.nv5geospatialsoftware.com/Products/ENVI. b Maxar imagery of the KIC-1 oil pads during summer 2020. Data were acquired through the NASA Commercial Smallsat Data Acquisition (CSDA) Program: https://www.earthdata.nasa.gov/esds/csda. ©2020 Maxar. Figure was prepared using ENVI Classic Version 5.6: https://www.nv5geospatialsoftware.com/Products/ENVI.
Fig. 4
Fig. 4
Compiled greenness and water indices of KIC-1 from Planet Lab data acquired on August, 12 2020. Vegetation fraction shows progressive greening around the KIC well site, most prominent in late summer. Substrate fraction shows a progressive decrease in dry soils, presumably associated with increasing moisture due to permafrost thaw. Original data were acquired through the NASA Commercial Smallsat Data Acquisition (CSDA) Program: https://www.earthdata.nasa.gov/esds/csda. Image ©Planet Labs. Greenness and water indices were computed using ArcGIS Pro 3.1.0 Copyright © 2023 Esri Inc. Figure was prepared using ArcGIS Pro 3.1.0 Copyright © 2023 Esri Inc. https://www.esri.com/en-us/arcgis/products/arcgis-pro/resources.
Fig. 5
Fig. 5
Sampling locations near Prudhoe Bay, AK, indicated by markers. The sample sites are along the Dalton Highway. The outset image shows the path of sampling at 90 degrees from the pad location. Background image of the sampling location provided by Esri, Maxar, Earthstar Geographics, and the GIS User Community. Figure was prepared using ArcGIS Pro 3.1.0 Copyright © 2023 Esri Inc. https://www.esri.com/en-us/arcgis/products/arcgis-pro/resources.

Similar articles

References

    1. Szabo, D. J. & Meyers, K. O. Prudhoe Bay: Development History and Future Potential. in (OnePetro, 1993). 10.2118/26053-MS.
    1. Arctic National Wildlife Refuge, 1002 Area, Petroleum Assessment, 1998, Including Economic Analysis. https://pubs.usgs.gov/fs/fs-0028-01/fs-0028-01.htm.
    1. Fountain, H. Here’s what oil drilling looks like in the Arctic Refuge, 30 Years Later. The New York Times (2017).
    1. Mystery surrounds only oil well drilled in ANWR - Anchorage Daily News.
    1. Jorgenson, M. T. & Jorgenson, J. C. Arctic Connections to Global Warming and Health. in Climate Change and Global Public Health (eds. Pinkerton, K. E. & Rom, W. N.) 91–110 (Springer International Publishing, Cham, 2021). 10.1007/978-3-030-54746-2_5.

LinkOut - more resources