

Relationships between capnogram parameters by mainstream and sidestream techniques at different breathing frequencies
- PMID: 39455813
- PMCID: PMC11512031
- DOI: 10.1038/s41598-024-75808-0
Relationships between capnogram parameters by mainstream and sidestream techniques at different breathing frequencies
Abstract
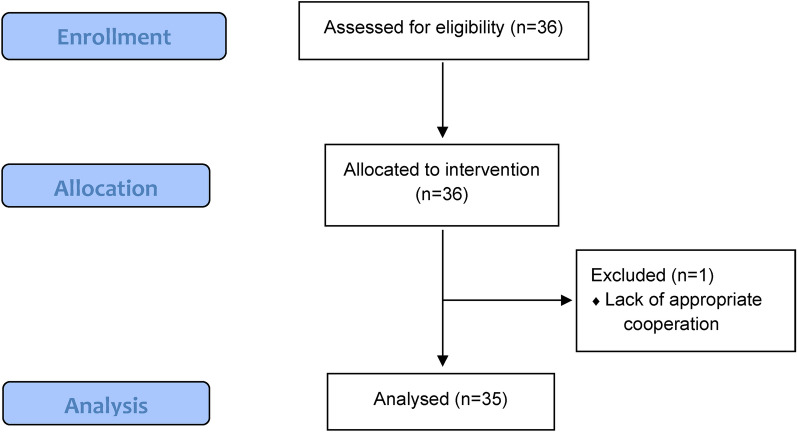
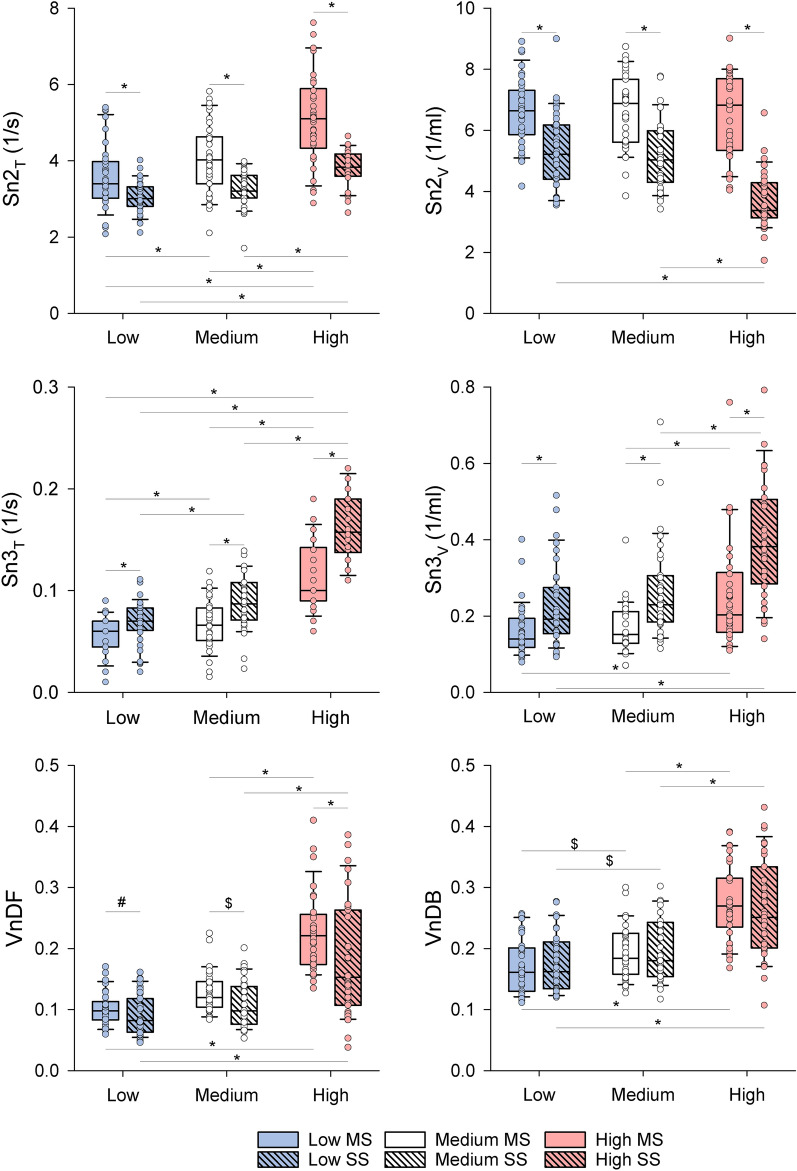
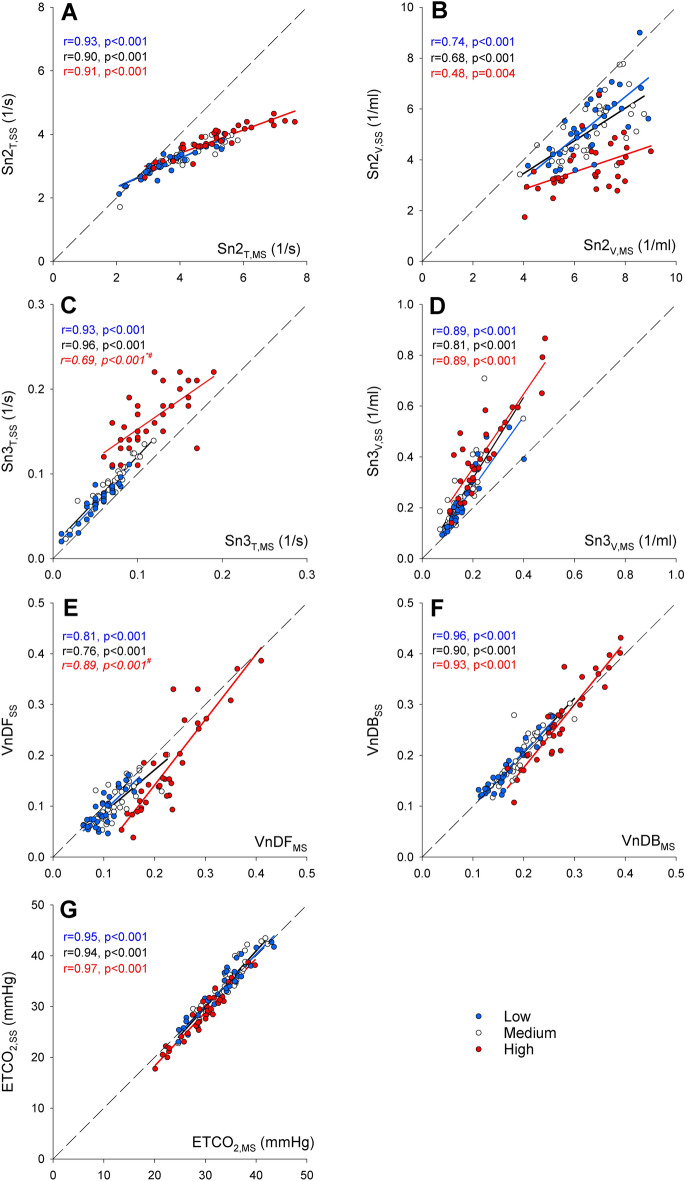
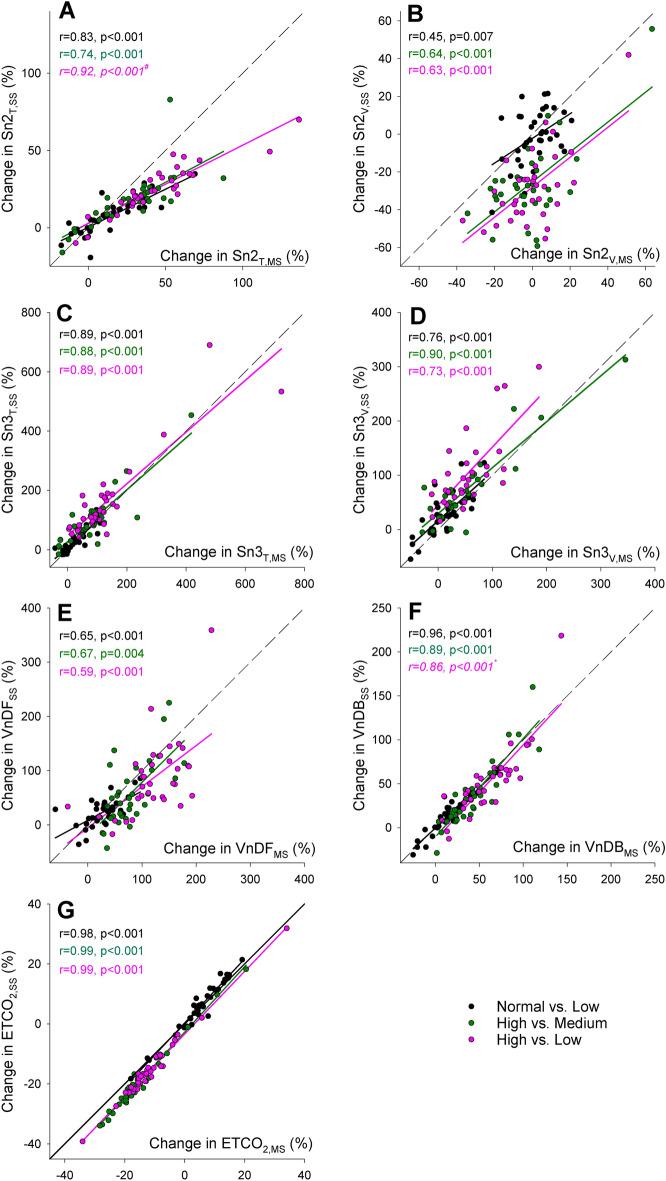
Capnography, routinely used in operating rooms and intensive care units, reveals essential information on lung ventilation and ventilation-perfusion matching. Mainstream capnography directly measures CO2 in the breathing circuit for accurate analysis and is considered a reference technique. Sidestream capnography, however, analyzes gas away from the patient leading to potentially less accurate measures. While these methodological differences impact the capnogram indices in mechanically ventilated patients, such assessments during spontaneous breathing are essentially lacking. Accordingly, we aimed to compare mainstream and sidestream capnography in spontaneously breathing subjects, focusing on differences in capnogram shape and dead space indices at various respiratory rates. Simultaneous mainstream and sidestream time and volumetric capnography were performed on spontaneously breathing adults (n = 35). Measurements were performed during controlled low (10/min), medium (12/min), and high (20/min) breathing rates as a challenge. Correlation and Bland-Altman analyses were used to assess trends and agreements between time and volumetric capnography indices obtained by the mainstream and sidestream techniques, including end-tidal CO2 (ETCO2), shape factors reflecting the slopes of phases 2 and 3, and anatomical and physiological dead space fractions. ETCO2 and physiological dead space measured by mainstream and sidestream techniques showed excellent correlations (r > 0.90, p < 0.001 for all breathing rates) and agreements. While strong correlations and moderate agreements were evidenced in the parameters reflecting the late phase of expiration (phase 3 slope and exhaled CO2 volume), these relationships were weaker for indices related to the early phase of expiration (phase 2 slope, anatomical dead space). Changing breathing frequency caused significant alterations in all capnography parameters, which were detectable by both mainstream and sidestream techniques. Sidestream capnography cannot substitute the more accurate mainstream technique for measuring the absolute values of shape factors and ventilation dead space fractions. However, sidestream capnography is also able to detect and track changes in uneven alveolar emptying, ventilation-perfusion matching and ventilation dead space fraction in spontaneously breathing subjects.
Keywords: Dead spaces; Main- and sidestream capnography; Spontaneous breathing; Time and volumetric domains.
© 2024. The Author(s).
Conflict of interest statement
The authors declare no competing interests.
Figures
References
-
- Ortega, R., Connor, C., Kim, S., Djang, R. & Patel, K. Monitoring ventilation with capnography. N Engl. J. Med.367, e27 (2012). - PubMed
-
- Walsh, B. K., Crotwell, D. N. & Restrepo, R. D. Capnography/Capnometry during mechanical ventilation: 2011. Respir. Care56, 503–509 (2011). - PubMed
-
- Thompson, J. E. & Jaffe, M. B. Capnographic waveforms in the mechanically ventilated patient. Respir. Care50, 100–108 (2005). - PubMed
-
- Owens, B. & Hall, C. Application of end-tidal CO2 monitoring to ICU management. Crit. Care Nurs. Q47, 157–162 (2024). - PubMed
-
- Kremeier, P., Bohm, S. H. & Tusman, G. Clinical use of volumetric capnography in mechanically ventilated patients. J. Clin. Monit. Comput.34, 7–16 (2020). - PubMed
MeSH terms
Substances
Grants and funding
LinkOut - more resources
Full Text Sources
