

Deep learning-based super-resolution and denoising algorithm improves reliability of dynamic contrast-enhanced MRI in diffuse glioma
- PMID: 39455814
- PMCID: PMC11512070
- DOI: 10.1038/s41598-024-76592-7
Deep learning-based super-resolution and denoising algorithm improves reliability of dynamic contrast-enhanced MRI in diffuse glioma
Erratum in
-
Author Correction: Deep learning-based super-resolution and denoising algorithm improves reliability of dynamic contrast-enhanced MRI in diffuse glioma.Sci Rep. 2024 Nov 13;14(1):27828. doi: 10.1038/s41598-024-79468-y. Sci Rep. 2024. PMID: 39537823 Free PMC article. No abstract available.
Abstract
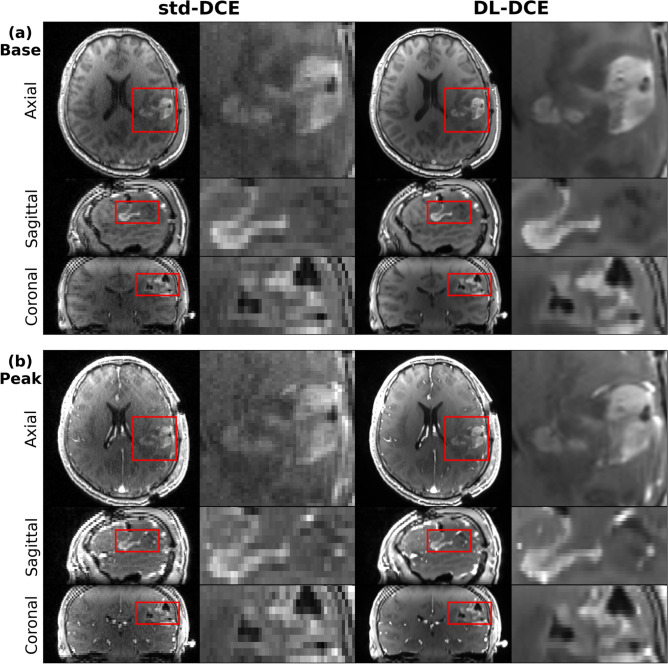
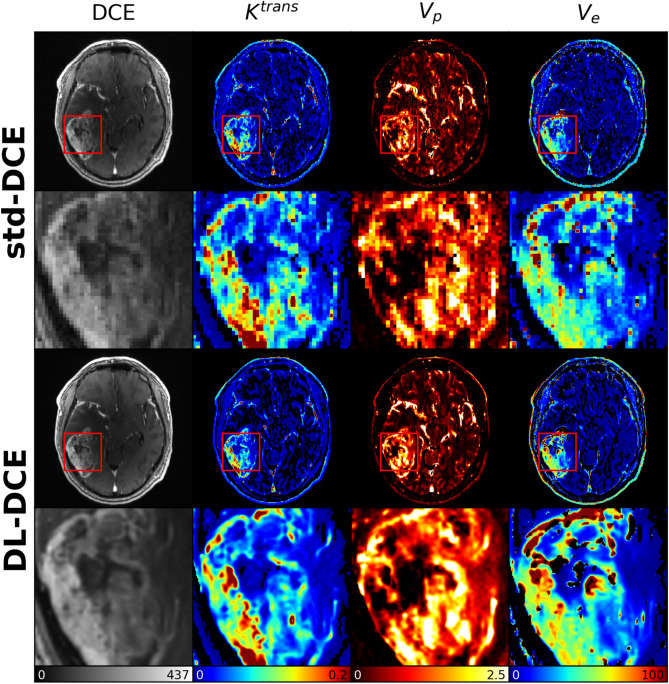
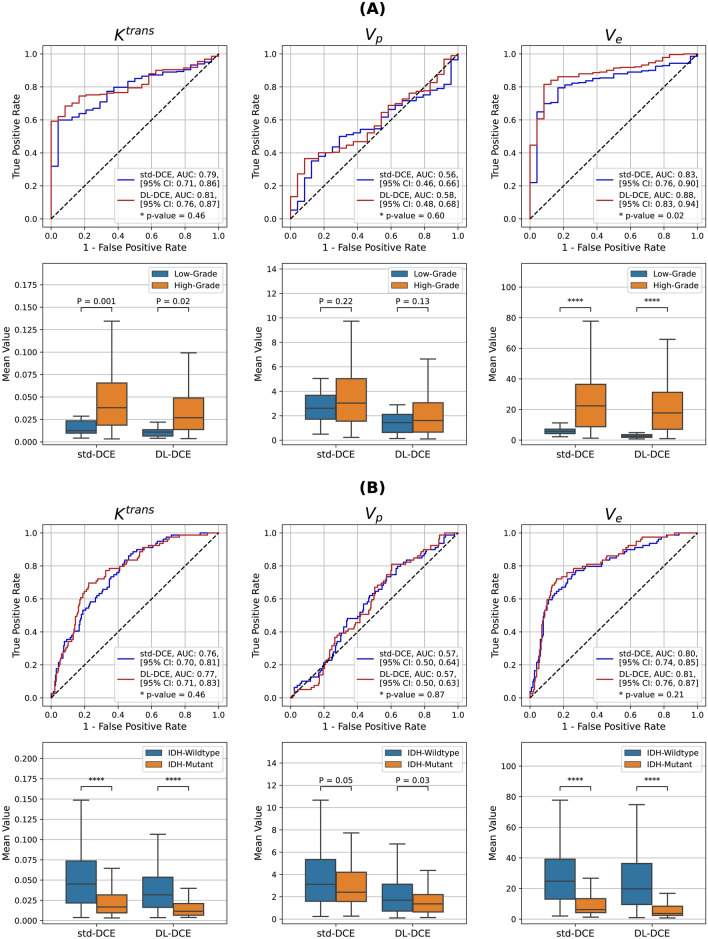
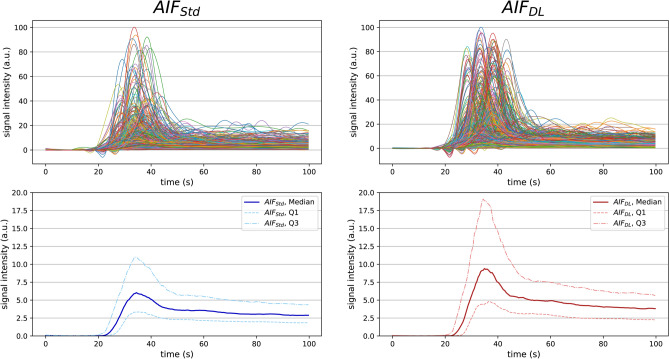
Dynamic contrast-enhanced MRI (DCE-MRI) is increasingly used to non-invasively image blood-brain barrier leakage, yet its clinical utility has been hampered by issues such as noise and partial volume artifacts. In this retrospective study involving 306 adult patients with diffuse glioma, we applied deep learning-based super-resolution and denoising (DLSD) techniques to enhance the signal-to-noise ratio (SNR) and resolution of DCE-MRI. Quantitative analysis comparing standard DCE-MRI (std-DCE) and DL-enhanced DCE-MRI (DL-DCE) revealed that DL-DCE achieved significantly higher SNR and contrast-to-noise ratio (CNR) compared to std-DCE (SNR, 52.09 vs 27.21; CNR, 9.40 vs 4.71; P < 0.001 for all). Diagnostic performance assessed by the area under the receiver operating characteristic curve (AUROC) showed improved differentiation of WHO grades based on a pharmacokinetic parameter [Formula: see text] (AUC, 0.88 vs 0.83, P = 0.02), while remaining comparable to std-DCE in other parameters. Analysis of arterial input function (AIF) reliability demonstrated that [Formula: see text] exhibited superior agreement compared to [Formula: see text], as indicated by mostly higher intraclass correlation coefficients (Time to peak, 0.79 vs 0.43, P < 0.001). In conclusion, DLSD significantly enhances both the image quality and reliability of DCE-MRI in patients with diffuse glioma, while maintaining or improving diagnostic performance.
Keywords: Deep learning; Glioma; Image enhancement; Magnetic resonance imaging; Perfusion.
© 2024. The Author(s).
Conflict of interest statement
The authors declare no competing interests.
Figures

References
-
- Tofts, P. S. et al. Estimating kinetic parameters from dynamic contrast-enhanced t1-weighted mri of a diffusable tracer: Standardized quantities and symbols. J. Magn. Reson. Imaging Off. J. Int. Soc. Magn. Reson. Med.10, 223–232 (1999). - PubMed
MeSH terms
Substances
Grants and funding
- No. 2021M3E5D2A01022493/National Research Foundation of Korea
- No. RS-2023-00251022/National Research Foundation of Korea
- 20011878/Ministry of Trade, Industry and Energy
- Phase III (Postdoctoral fellowship) grant of the SPST (SNU-SNUH Physician Scientist Training) Program/College of Medicine, Seoul National University
- No. 04-2023-2050/Seoul National University Hospital
LinkOut - more resources
Full Text Sources
Medical
Research Materials
