. 2024 Oct 25;7(1):1388.
doi: 10.1038/s42003-024-07082-9.

Autoregulation ensures vertical transmission of the linear prophage GIL01

Affiliations

Autoregulation ensures vertical transmission of the linear prophage GIL01

Anja Pavlin et al. Commun Biol. .

Abstract

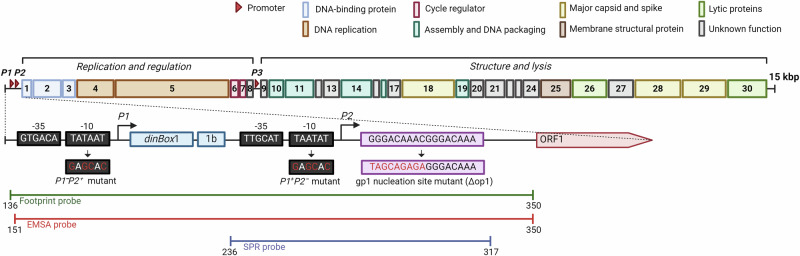
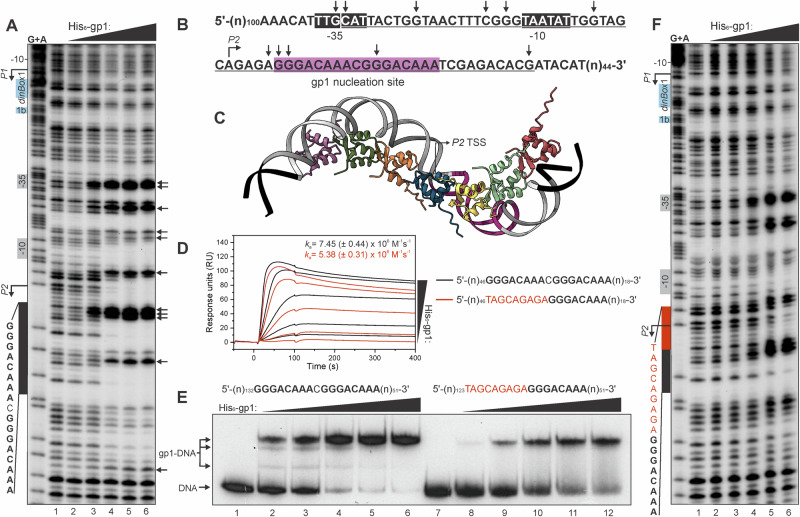
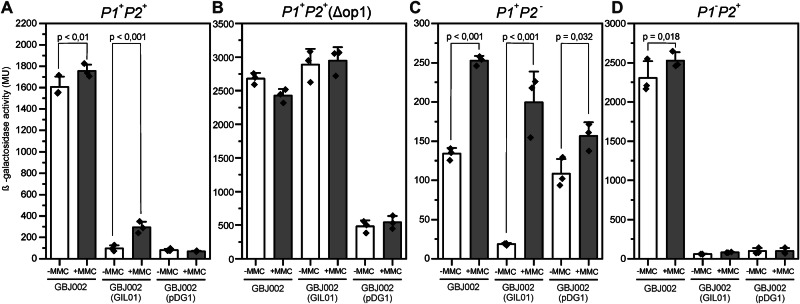
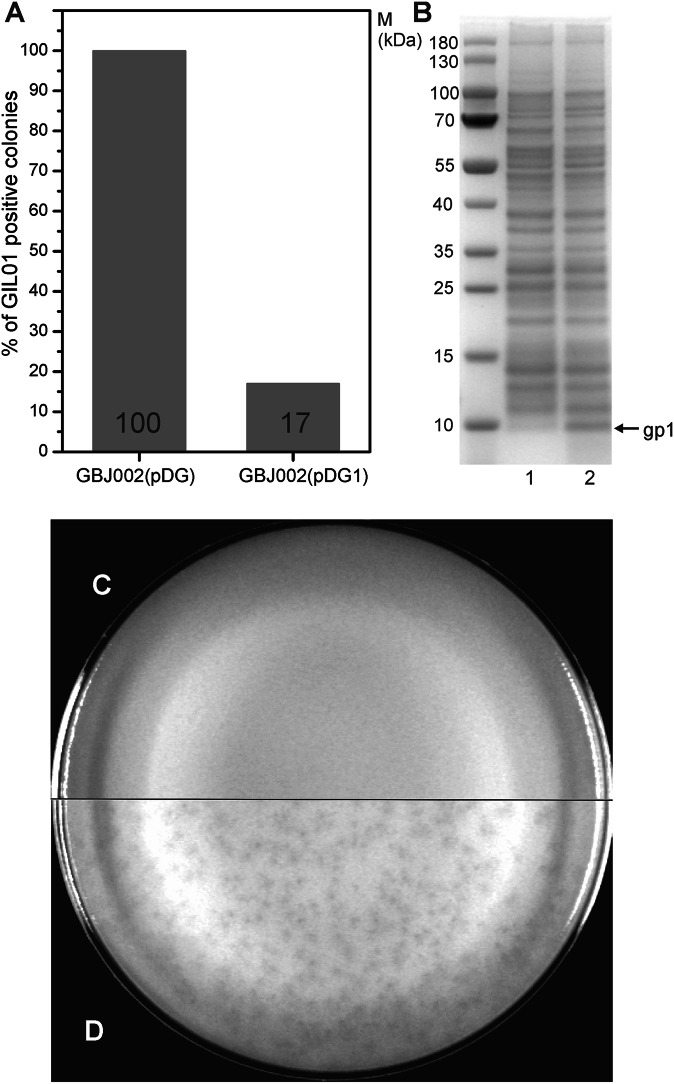
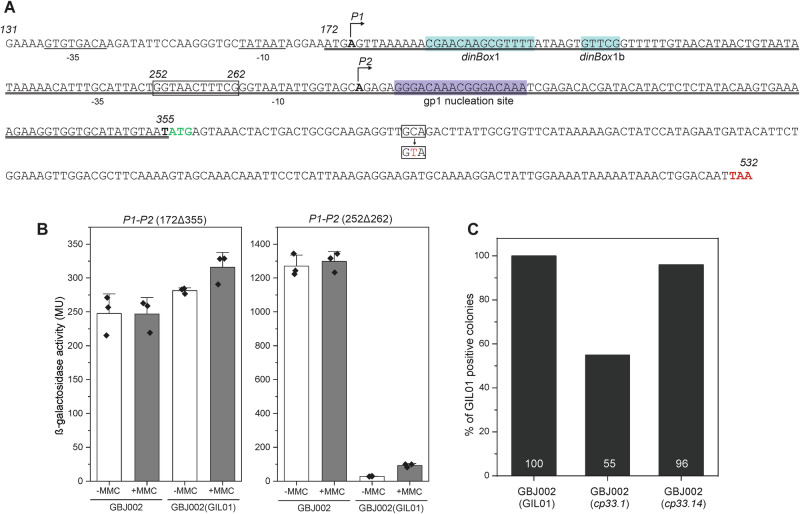
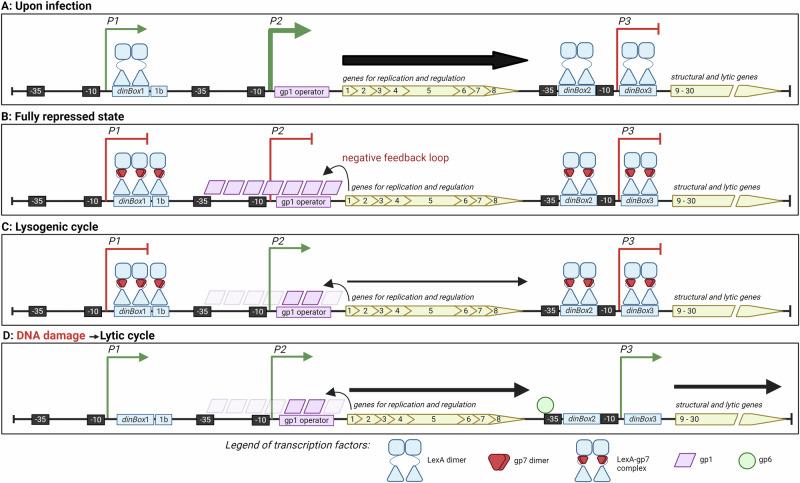
Betatectiviruses are prophages consisting of linear extrachromosomal genomes without obvious plasmid modules. It remains unclear how betatectiviruses are maintained in low-copy numbers in host cells and how they are vertically transmitted. Phage GIL01 is a model betatectivirus that infects the mosquito pathogen Bacillus thuringiensis serovar israelensis. Previous studies identified two closely spaced promoters, P1 and P2, responsible for the expression of GIL01 genes required for prophage replication and the switch from the lysogenic to lytic cycle. Here, we report that the GIL01-encoded 58-amino acid long gp1 protein forms a large nucleoprotein complex that represses its transcription from the strong promoter P2. Notably, ectopic expression of gp1 resulted in the loss of GIL01 in exponential cultures and immunized cells against infection with GIL01, indicating that gp1 plays a repressive role in the phage cycle. This finding is consistent with mutations in gp1 committing GIL01 to the lytic cycle and we show that maintenance of this phage variant in the bacterial population is contingent on the accumulation of deletions in the P1-P2 region. The fact that gp1 is conserved across most sequenced betatectiviruses suggests that the regulatory mechanism of gp1 that controls prophage maintenance is widespread among these bacteriophages.


Conflict of interest statement

The authors declare no competing interests.

Figures

Fig. 1
Fig. 1. Schematic representation of the phage GIL01 genome.
The 15-kbp genome of phage GIL01 comprises 30 ORFs, all transcribed in the same left-to-right direction and grouped into two functional modules: on the left, a 4.8-kbp module containing genes required for the regulation and replication of the GIL01 genome, and on the right, a 10.2-kbp module containing structural and lytic genes. Each ORF is color-coded to indicate a function described in the legend. Transcription of the left module is controlled by the P1 and P2 tandem promoters, and that of the right module is controlled by the P3 promoter. All three promoters are indicated with red arrowheads. The regulatory region containing P1 and P2 is enlarged below the schematic of the GIL01 genome. The P1 and P2 transcription start sites are indicated with angled arrows, the -10 and -35 promoter elements are denoted with black boxes, the LexA binding sites—canonical dinBox1 and non-canonical dinBox1b—are denoted with blue boxes, the gp1 nucleation site is shown in purple, and a partial ORF1 is represented in red. Below the -10 promoter elements are the nucleotide substitutions (highlighted in red) that form derivatives of the wild-type P1+P2+ promoter region with inactivated P1 (named P1-P2+) and inactivated P2 (named P1+P2-), both used in promoter–lacZ fusions for measurement of ß-galactosidase activity (Fig. 3). Below the sequence of the gp1 nucleation site (operator 1; purple box) is the sequence of the Δop1 deletion mutant, with displaced nucleotides in red, that was used along with the wild-type sequence in lacZ fusions, DNase I footprinting (Fig. 2A, F), surface plasmon resonance (SPR) (Fig. 2D), and electrophoretic mobility shift assay (EMSA; Fig. 2E) experiments. The positions and GIL01 genome coordinates (GenBank ID, AJ536073.2) of the probes used in these experiments are indicated. This figure was created with BioRender.com.
Fig. 2
Fig. 2. Gp1 forms a large nucleoprotein complex with promoter P2.
A, F DNase I footprint analysis of His6-gp1 binding to the GIL01 P1-P2 promoter region. The negative strand of DNA probes encompassing the wild-type gp1 nucleation site (215 bp) (A) or Δop1 mutant (207 bp) (F) (GenBank ID, AJ536073.2; genome coordinates 136 to 350; Fig. 1) was labeled, incubated with increasing concentrations (200 to 3200 nM in two-fold increments; lanes 2 to 6) of His6-gp1, and digested with DNase I. The cleavage products were separated on an 8% sequencing gel. G + A lanes contain purine cleavage products corresponding to the respective 32P-labeled DNA probes and the first marked lanes contain DNA probes without added protein. The positive strand sequences of the wild-type gp1 nucleation site (A) and the Δop1 mutant (F) are shown to the left of the footprints. The P1 and P2 transcription start sites are indicated with angled arrows. The -10 and -35 sequences of P2 are shown in grey and the -10 promoter element of P1 is indicated with a number. The LexA-binding sites (dinBox1 and dinBox1b) are denoted in blue. Arrows to the right of A indicate DNase I hypersensitive sites. B Nucleotide sequence protected by His6-gp1 in DNase I footprint analysis. The P2 transcription start site is indicated with an angled arrow, and the -10 and -35 elements of P2 are highlighted in black. The region protected by His6-gp1 is underlined, and the gp1 nucleation site is highlighted in purple. Vertical arrows above the sequence indicate the positions of DNase I hypersensitive sites. C Model of the heptamer gp1 filament interacting with the 65-bp DNA fragment protected in DNase I footprint analysis (shown in gray and purple) flanked by 6 nucleotides at each extremity (shown in black). The gp1 nucleation site (operator 1) is shown in purple and the P2 transcription start site (TSS) is indicated with an angled arrow. The figure was created using program ChimeraX. D Surface plasmon resonance (SPR) analysis of the interaction of His6-gp1 with the 81 bp DNA fragment of the P2 promoter region (GenBank ID, AJ536073.2; genome coordinates 236 to 317; Fig. 1) carrying the wild-type gp1 nucleation site or Δop1 mutant. Gp1 was injected over each DNA fragment immobilized on the chip (50–55 RU) for 90 s at a flow rate of 30 µL min-1 in concentrations ranging from 4 to 64 nM in two-fold increments. The sensorgram shows the concentration-dependent responses of His6-gp1 interaction with the wild-type gp1 nucleation site (black lines) or the Δop1 mutant (red lines). The obtained association rate constants (ka) of three independent experiments (n = 3) and standard deviations are shown in respective colors. Nucleation site sequences are shown to the right of the sensorgram, with displaced nucleotides in red. Experiments were performed in triplicate and a representative sensorgram is shown. E Electrophoretic mobility shift assay of His6-gp1 binding to the GIL01 P1-P2 promoter region. 32P-labeled DNA fragments of the P1-P2 promoter region (GenBank ID, AJ536073.2; genome coordinates 151 to 350; Fig. 1) carrying the wild-type gp1 nucleation site (200 bp, left panel) or the Δop1 mutant (192 bp, right panel) were used. Nucleation site sequences are shown above the gel, with the displaced sequence in red. Lanes 1 and 7 is labeled DNA without added protein. His6-gp1 concentrations range from 2 to 32 nM (in two-fold increments) in lanes 2 to 6 and lanes 8 to 12. The black arrows to the left indicate the bands corresponding to DNA and gp1–DNA complexes.
Fig. 3
Fig. 3. Gp1 represses SOS-independent promoter P2.
Bar charts illustrating the ß-galactosidase activity in GIL01-cured GBJ002, GIL01 lysogen GBJ002(GIL01), or gp1-expressing GBJ002(pDG1), carrying the following promoter–lacZ fusions: A wild-type P1+P2+ promoter region, B P1+P2+ (Δop1) with partial deletion of the gp1 nucleation site, C P1+P2- with mutated -10 promoter element in P2, and D P1-P2+ with mutated -10 promoter element in P1. Isopropyl β-D-1-thiogalactopyranoside (IPTG; 0.1 mM) was added to the strains harboring the pDG148 plasmid derivatives to induce the expression of gp1 upon inoculation, and the activity of the different promoter–lacZ fusions was measured in the absence (white) or presence (gray) of MMC (50 ng mL-1) 1 h after its addition to bacterial cultures in early exponential phase. Data are presented as bar charts with data points overlap of three independent replicates (n = 3). Upper line of the bar chart represents the mean value and the error bar represents the data range within the 1.5 interquartile range. The statistical significance of the data was assessed using Fisher’s Least Significant Difference (LSD) test.
Fig. 4
Fig. 4. Ectopic expression of gp1 prevents vertical transfer of prophage GIL01 and infection by phage GIL01.
A Percentage of GIL01-positive colonies of Bacillus thuringiensis strains GBJ002(pDG) and GBJ002(pDG1) 4 h after addition of 0.1 mM IPTG to induce expression of gp1. One hundred individual colonies of each strain were screened for the presence of GIL01 by transferring them to a lawn of recipient strain GBJ002. GIL01-positive colonies formed turbid plaques on GBJ002 lawns. B Analysis of gp1 expression in Bacillus thuringiensis strains GBJ002(pDG) and GBJ002(pDG1). The first unmarked lane of the SDS-PAGE gel contains a protein ladder, and lanes 1 and 2 contain 20 µL of GBJ002(pDG) and GBJ002(pDG1) culture lysates obtained 4 h after addition of 0.1 mM IPTG. The band corresponding to gp1 (~6.5 kDa) is indicated with an arrow. IPTG-induced strains GBJ002(pDG1) (C) and GBJ002(pDG) (D) infected with GIL01 in soft agar layers.
Fig. 5
Fig. 5. Characterization of GIL01 double mutants.
A Nucleotide sequence of the P1-P2 promoter region and the gene encoding gp1. The P1 and P2 transcription start sites are indicated with angled arrows, -35 and -10 promoter elements are underlined, canonical dinBox1 and non-canonical dinBox1b LexA-binding sites are highlighted in blue, gp1 nucleation site is highlighted in purple, and ORF1 start and stop codons are shown in green and red, respectively. The nucleotide substitution in ORF1, translating into gp1 (A11V) in cp33, is shown in red as a boxed codon. The 172Δ355 deletion found in the double mutant cp33.1 is double underlined, and the 252Δ262 deletion of double mutant cp33.14 is boxed. B Bar charts illustrating the ß-galactosidase activity in cured GBJ002 or in the GIL01 lysogen, GBJ002(GIL01), carrying the P1-P2 promoter regions of cp33.1 (172Δ355) or cp33.14 (252Δ262) fused to the reporter gene lacZ. Activity of the different promoter–lacZ fusions was measured in the absence (white) or presence (gray) of MMC (50 ng mL-1) 1 h after its addition to bacterial cultures in early exponential phase. Data are presented as bar charts with data points overlap of three independent replicates (n = 3). Upper line of the bar chart represents mean value and error bar represents the data range within 1.5 interquartile range. The statistical significance of the data was assessed using Fisher’s Least Significant Difference (LSD) test. C Percentage of GIL01-positive colonies in strains GBJ002(GIL01), GBJ002(cp33.1), and GBJ002(cp33.14). At least one hundred individual bacterial colonies of each strain were screened for the presence of GIL01 by transferring them to a lawn of recipient strain GBJ002. GIL01-positive colonies formed turbid plaques on GBJ002 lawns.
Fig. 6
Fig. 6. Model of regulation of GIL01 gene expression.
A Upon GIL01 infection, the host transcription factor LexA alone is not sufficient to repress transcription from the P1 promoter. This is because LexA requires complex formation with gp7 to simultaneously occupy the target sites dinBox1 and dinBox1b. Because gp1 is not yet synthesized, the P2 promoter is also derepressed and active. Consequently, genes responsible for replication and regulation of GIL01 are transcribed from P1 and P2, leading to expression of ORFs 1-8 and accumulation of the regulatory proteins gp1, gp6, and gp7, among others. Transcription from the internal lytic promoter P3 is blocked because its activation requires LexA inactivation and the intracellular accumulation of the transcription activator gp6. B In a fully repressed state, gp1 represses transcription from promoter P2 and LexA-gp7 specifically targets the weak promoter P1 and the lytic promoter P3. C Autorepression of gp1 leads to a decrease in gp1 levels and enables the production of DNA polymerase and terminal protein to ensure the replication of GIL01 and its vertical transfer during the lysogenic cycle. Expression of gp7 enables further repression of P1 and P3 to prevent entry into the lytic cycle. D Following persistent DNA damage, LexA is inactivated and its intracellular concentration falls, leading to the derepression of promoters P1 and P3. Expression from P1 leads to substantial accumulation of gp6, resulting in P3 activation and the expression of the downstream genes responsible for virion production and cell lysis.

Similar articles

References

    1. Gillis, A. et al. Role of plasmid plasticity and mobile genetic elements in the entomopathogen Bacillus thuringiensis serovar israelensis. FEMS Microbiol. Rev.42, 829–856 (2018). - PMC - PubMed
    1. Gillis, A. & Mahillon, J. Prevalence, genetic diversity, and host range of tectiviruses among members of the Bacillus cereus group. Appl. Environ. Microbiol.80, 4138–4152 (2014). - PMC - PubMed
    1. Verheust, C., Jensen, G. & Mahillon, J. pGIL01, a linear tectiviral plasmid prophage originating from Bacillus thuringiensis serovar israelensis. Microbiology149, 2083–2092 (2003). - PubMed
    1. Muñoz-Espín, D., Holguera, I., Ballesteros-Plaza, D., Carballido-López, R. & Salas, M. Viral terminal protein directs early organization of phage DNA replication at the bacterial nucleoid. Proc. Natl Acad. Sci. USA107, 16548–16553 (2010). - PMC - PubMed
    1. Pavlin, A. et al. A small bacteriophage protein determines the hierarchy over co-residential jumbo phage in Bacillus thuringiensis serovar israelensis. Commun. Biol.5, 1286 (2022). - PMC - PubMed

MeSH terms

LinkOut - more resources