. 2024 Oct 25;7(1):1393.
doi: 10.1038/s42003-024-07089-2.

miR-124 coordinates metabolic regulators acting at early stages of human neurogenesis

Affiliations

miR-124 coordinates metabolic regulators acting at early stages of human neurogenesis

Geurim Son et al. Commun Biol. .

Abstract

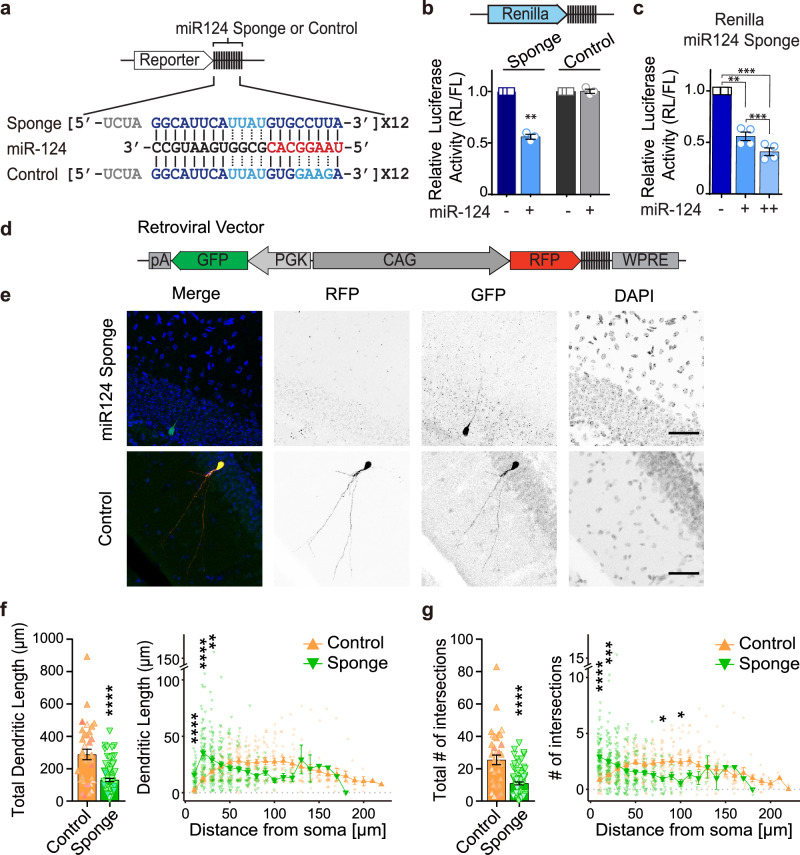
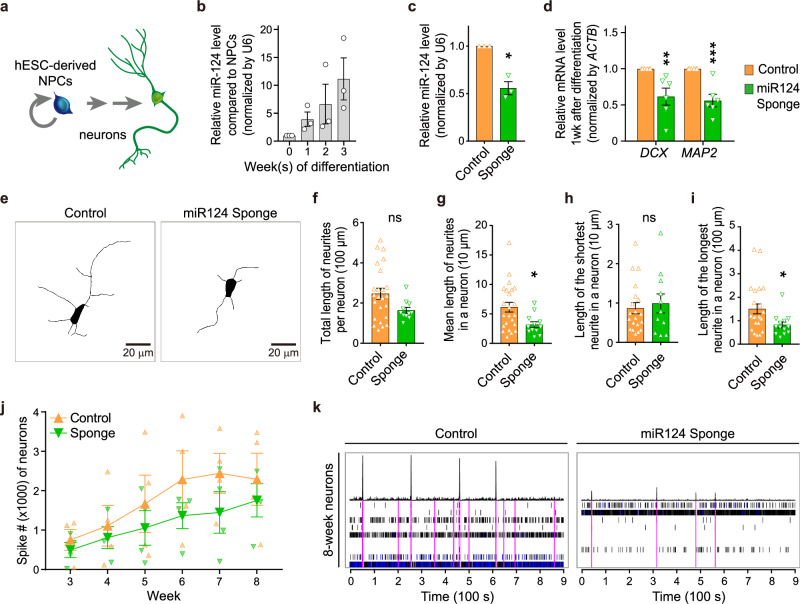
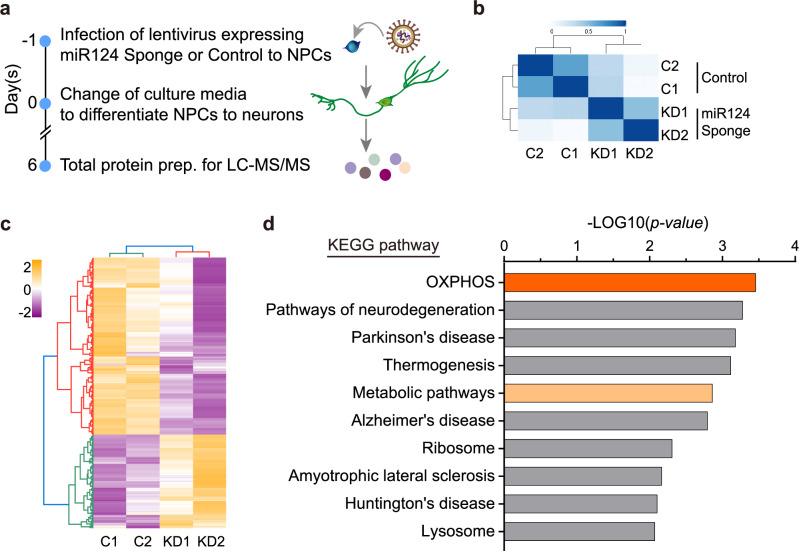
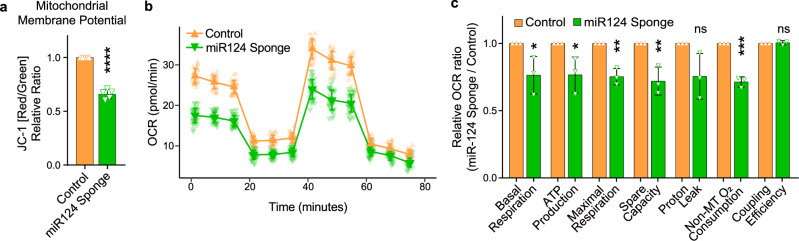
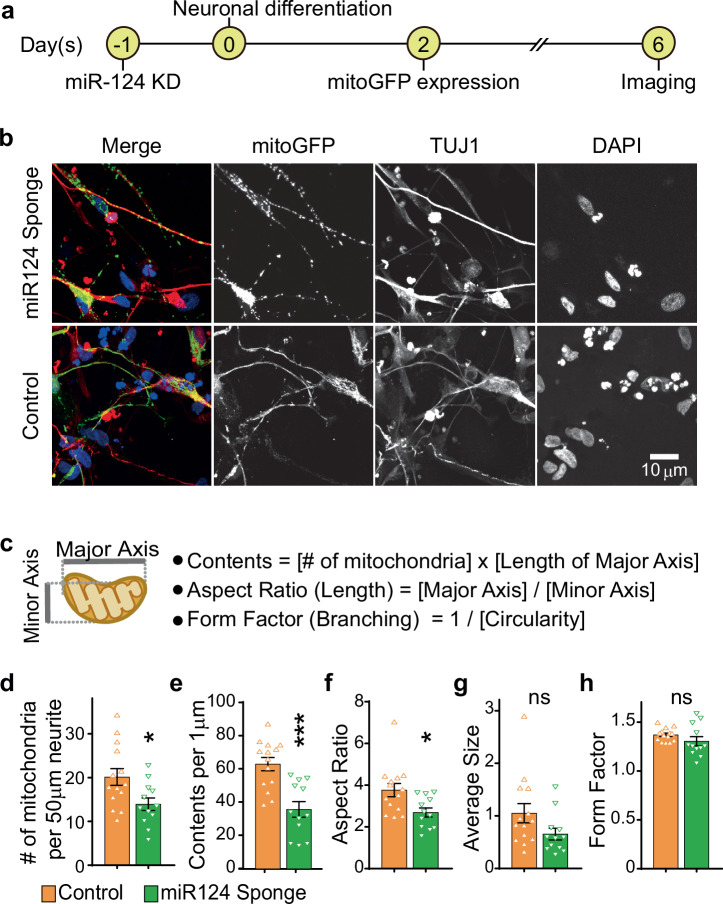
Metabolic dysregulation of neurons is associated with diverse human brain disorders. Metabolic reprogramming occurs during neuronal differentiation, but it is not fully understood which molecules regulate metabolic changes at the early stages of neurogenesis. In this study, we report that miR-124 is a driver of metabolic change at the initiating stage of human neurogenesis. Proteome analysis has shown the oxidative phosphorylation pathway to be the most significantly altered among the differentially expressed proteins (DEPs) in the immature neurons after the knockdown of miR-124. In agreement with these proteomics results, miR-124-depleted neurons display mitochondrial dysfunctions, such as decreased mitochondrial membrane potential and cellular respiration. Moreover, morphological analyses of mitochondria in early differentiated neurons after miR-124 knockdown result in smaller and less mature shapes. Lastly, we show the potential of identified DEPs as novel metabolic regulators in early neuronal development by validating the effects of GSTK1 on cellular respiration. GSTK1, which is upregulated most significantly in miR-124 knockdown neurons, reduces the oxygen consumption rate of neural cells. Collectively, our data highlight the roles of miR-124 in coordinating metabolic maturation at the early stages of neurogenesis and provide insights into potential metabolic regulators associated with human brain disorders characterized by metabolic dysfunctions.


Conflict of interest statement

The authors declare no competing interests.

Figures

Fig. 1
Fig. 1. The miRNA-124 sponge system successfully suppresses adult hippocampal neurogenesis.
a The miRNA-124 sponge contains 12 repeats of the sequences complementary to the miR-124 seed region (indicated in red) downstream of a reporter gene (Renilla luciferase or RFP). For the control, four nucleotides of the miR-124 sponge construct have been mutated (indicated in orange) to mismatch the miR-124 seed-binding region. b Renilla luciferase activity of the miR-124 sponge construct suppressed with miR-124 overexpression (OE) in HEK293T cells. For both miR-124 sponge and control, the relative level of Renilla luciferase activity to firefly luciferase activity was compared with or without miR-124 OE (n = 3, two-tailed paired t-test, **p-value = 0.0029, error bar = s.e.m.). c Experiment conducted in panel 1b repeated with a higher level of miR-124 OE. Substantial amounts of miR-124 OE led to further suppression of Renilla luciferase activity, indicating a dose-dependent reaction (n = 4, two-tailed paired t-test, **p = 0.0018 (− vs. +), ***p = 0.0006 (− vs. ++), ***p = 0.0002 (+ vs. ++), error bar = s.e.m.). d Retrovirus was infected to mouse hippocampus for Sholl analysis. GFP is constantly expressed, but translation of RFP is suppressed when miR-124 binds to miR-124 sponge sequences. e Representative images of panels f and g. RFP translation was not suppressed in the control, so co-expressed with GFP when infected. Mouse hippocampus was imaged three weeks post-infection. Scale bar = 50 µm. f, g Sholl analysis results show significantly shorter dendritic length of miR-124-depleted neurons and significantly less number of intersections in miR-124-depleted neurons (Control n = 34 from 5 mice, Sponge n = 83 from 4 mice; error bar = s.e.m.; two-tailed unpaired t-test (bar graphs), ****p-value < 0.0001; two-way ANOVA Bonferroni’s multiple comparisons test (line graphs), dendritic length: ****adj p-value < 0.0001 and **adj p-value = 0.0065, intersections: ****adj p-value < 0.0001, ***adj p-value = 0.0005, *adj p-value (80 µm) = 0.0188, and *adj p-value (100 µm) = 0.0494).
Fig. 2
Fig. 2. miR-124 knockdown causes defects in neuronal differentiation of human NPCs.
a Scheme of neuronal differentiation using human embryonic stem cell (hESC)-derived neural progenitor cells (NPCs) to study neurogenesis. b The expression level of mature miR-124 relative to U6 increases during human neurogenesis (n = 3, Kruskal-Wallis one-way ANOVA, p-value = 0.0198, error bar = s.e.m.). c The miR-124 sponge decreases the expression level of mature miR-124. Relative miR-124 level was measured by real time PCR in neurons differentiated for 6 days after miR-124 sponge infection (n = 3, two-tailed paired t-test, *p-value = 0.0233, error bar = s.e.m.). d The expression of neuronal genes, DCX and MAP2, is decreased in miR-124-depleted day-6 neurons (n = 6, two-tailed unpaired t-test, **p-value (DCX) = 0.0083, ***p-value (MAP2) = 0.0005, error bar = s.e.m.). e Representative images of day-6 neurons with or without miR-124 function. miR-124 KD reduces the neurite complexities of early differentiating neurons. fi Neurite length analyzed by using a FIJI plugin NeuronJ (n = 3, two-tailed unpaired t-test, error bar = s.e.m.). f Total length of neurites per neuron (24 Control neurons, 11 Sponge neurons, ns = non-significant, p-value = 0.0563). g Mean length of neurite in a neuron (23 Control neurons, 12 Sponge neurons, *p-value = 0.0184). h Length of the shortest neurite in a neuron (20 Control neurons, 11 Sponge neurons, ns = non-significant, p-value = 0.6466). i Length of the longest neurite in a neuron (23 Control neurons, 13 Sponge neurons, *p-value = 0.0283). j, k. miR-124 KD suppresses electrophysiological maturation. Electrophysiological properties of neurons with or without miR-124 were measured via microelectrode array for 8 weeks. j Number of spikes from week-3 to -8 neurons (n = 4, two-way ANOVA, *p-value = 0.0423, error bar = s.e.m.). k Representative raster plots presenting network bursts in neurons differentiated for 8 weeks.
Fig. 3
Fig. 3. Proteomics analysis reveals an association of miR-124 with cellular metabolism.
a Scheme of a TMT LC-MS/MS proteomic analysis. b Hierarchical clustering of proteomic analysis results with Pearson correlation distance. c Heatmap of 593 DEPs (−1.3 < FC < +1.3) clustered with Pearson correlation distance. d Gene ontology analysis with KEGG pathway annotations using 593 DEPs used in panel 3c.
Fig. 4
Fig. 4. Effects of miR-124 on the functional features of mitochondria on day-6 neurons.
a miR-124 sponge neurons show depolarized mitochondria, indicated by lower ratio of red-to-green JC-1 dyes representing lower MMP (n = 5, two-tailed unpaired t-test, ****p-value < 0.0001, error bar = stdev). Gating strategy is provided in Supplemental Information. b, c Mitochondrial respiration of early neurons. Seahorse Cell Mito Stress test was performed using neurons differentiated for six days after miR-124 knockdown. b One representative result from three biological experiments is depicted. Cellular respiration is decreased in miR-124 KD neurons (27 wells for control, 33 wells for miR-124 KD, error bar = stdev). c The parameters of the Cell Mito Stress Test are presented as relative values between the control and miR-124 KD, allowing for the integration of results from all three biological experiments (n = 3, two-tailed unpaired t-test, *p-value (Basal) = 0.0428, *p-value (ATP) = 0.0379, **p-value (Maximal) = 0.0022, **p-value (Spare) = 0.0096, p-value (Proton) = 0.0661, ***p-value (Non-MT) = 0.0002, p-value (Coupling) = 0.6320, ns = non-significant, error bar = stdev).
Fig. 5
Fig. 5. Effects of miR-124 on the morphological features of mitochondria on day-6 neurons.
a Timeline of experimental steps for analyzing mitochondrial morphology in day-6 neurons from control and miR-124 knockdown groups. b Representative images of mitochondria along neurites. cg Details of analyzed parameters and quantification using particle analysis plugin in FIJI (Control = 14, Sponge = 12, two-tailed unpaired t-test, error bar = s.e.m.). d Number of mitochondria per 50 μm neurite (*p-value = 0.0188). e Contents per 1 μm (***p-value = 0.0002). f Aspect Ratio (*p-value = 0.0128). g Average Size (ns = non-significant, p-value = 0.0866). h Form Factor (ns = non-significant, p-value = 0.1770).
Fig. 6
Fig. 6. Proteomics analysis of miR-124 KD day-6 neurons.
a Volcano plot indicating statistically significant 43 upregulated proteins (red) and 50 downregulated proteins (blue) in miR-124 KD day-6 neurons (−1.3 < FC < +1.3 and p-value < 0.05). b Proteins predicted to be ‘mitochondrial’ in all databases (IMPI, MitoCarta 2.0, and GO) of MitoMiner v4.0. c List of DEPs predicted to be ‘mitochondrial’.
Fig. 7
Fig. 7. Upregulation of GSTK1 suppresses mitochondrial respiration.
a Protein expression of GSTK1 increased in miR-124 KD day-6 neurons, confirming proteomics analysis. GSTK1 was used for validation (n = 4, two-tailed unpaired t-test, normalized by loading controls, *p-value = 0.0118, error bar = s.e.m.). b Using CRISPRa (dCas9-VPR) to upregulate GSTK1 in NPCs. Western blot analysis showing successful upregulation of GSTK1 (n = 3, two-tailed unpaired t-test, *p-value = 0.0243, **p-value = 0.0068, error bar = stdev). c, d Seahorse Cell Mito Stress test of day-6 neurons after upregulating GSTK1 via CRISPRa. c Three biological experiments were performed and one representative experimental result is depicted. Cellular respiration decreased in GSTK1 upregulated neurons (22 wells for sgRNA scramble, 25 wells for GSTK1-sgRNA1, 25 wells for GSTK1-sgRNA2, error bar = stdev). d The parameters of the Cell Mito Stress Test are presented as relative values among control and GSTK1 upregulated neurons, allowing for the integration of results from all three biological experiments (n = 3, one-way ANOVA, Dunnett’s multiple comparisons test, *adj p-value (Basal) = 0.0221, **adj p-value (Basal) = 0.0068, *adj p-value (ATP) = 0.0256, **adj p-value (ATP) = 0.0070, *adj p-value (Maximal) = 0.0218, **adj p-value (Maximal) = 0.0053, *adj p-value (Spare) = 0.0257, **adj p-value (Spare) = 0.0046, adj p-value (Proton) = 0.0588, *adj p-value (Proton) = 0.0266, *adj p-value (Non-MT) = 0.0203, **adj p-value (Non-MT) = 0.0018, adj p-value (Coupling – sgRNA1) = 0.7291, adj p-value (Coupling–sgRNA2) = 0.4564, ns = non-significant, error bar = stdev).

References

    1. Son, G. & Han, J. Roles of mitochondria in neuronal development. BMB Rep.51, 549–556 (2018). - PMC - PubMed
    1. Agostini, M. et al. Metabolic reprogramming during neuronal differentiation. Cell Death Differ.23, 1502–1514 (2016). - PMC - PubMed
    1. Zheng, X. et al. Metabolic reprogramming during neuronal differentiation from aerobic glycolysis to neuronal oxidative phosphorylation. eLife5, 1–25 (2016). - PMC - PubMed
    1. Zhu, X.-H. et al. Quantitative imaging of energy expenditure in human brain. NeuroImage60, 2107–2117 (2012). - PMC - PubMed
    1. Iwata, R., Casimir, P. & Vanderhaeghen, P. Mitochondrial dynamics in postmitotic cells regulate neurogenesis. Science369, 858–862 (2020). - PubMed

LinkOut - more resources