. 2025 Mar;32(2):106-120.
doi: 10.1038/s41434-024-00493-7. Epub 2024 Oct 25.

Chemogenetics with PSAM4-GlyR decreases excitability and epileptiform activity in epileptic hippocampus

Affiliations

Chemogenetics with PSAM4-GlyR decreases excitability and epileptiform activity in epileptic hippocampus

Ana Gonzalez-Ramos et al. Gene Ther. 2025 Mar.

Abstract

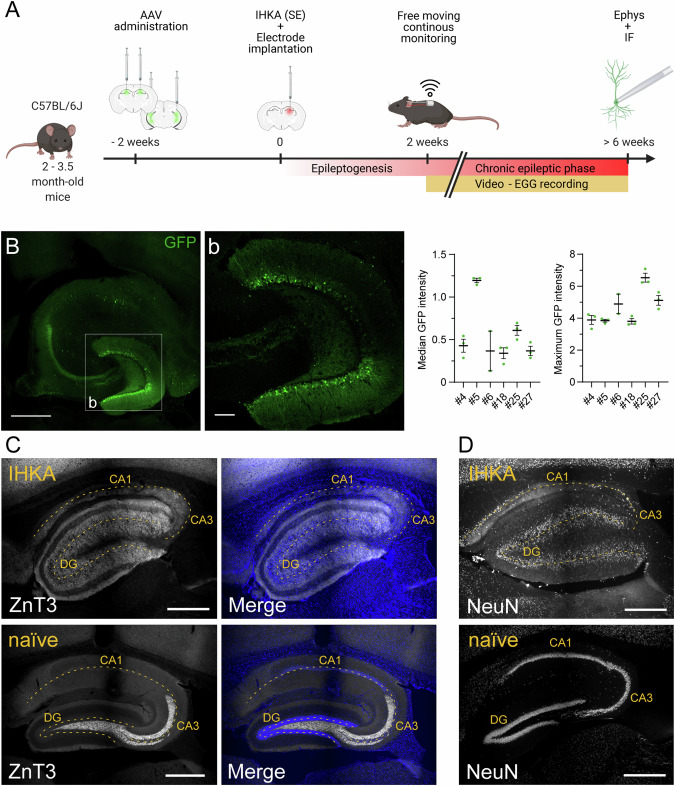
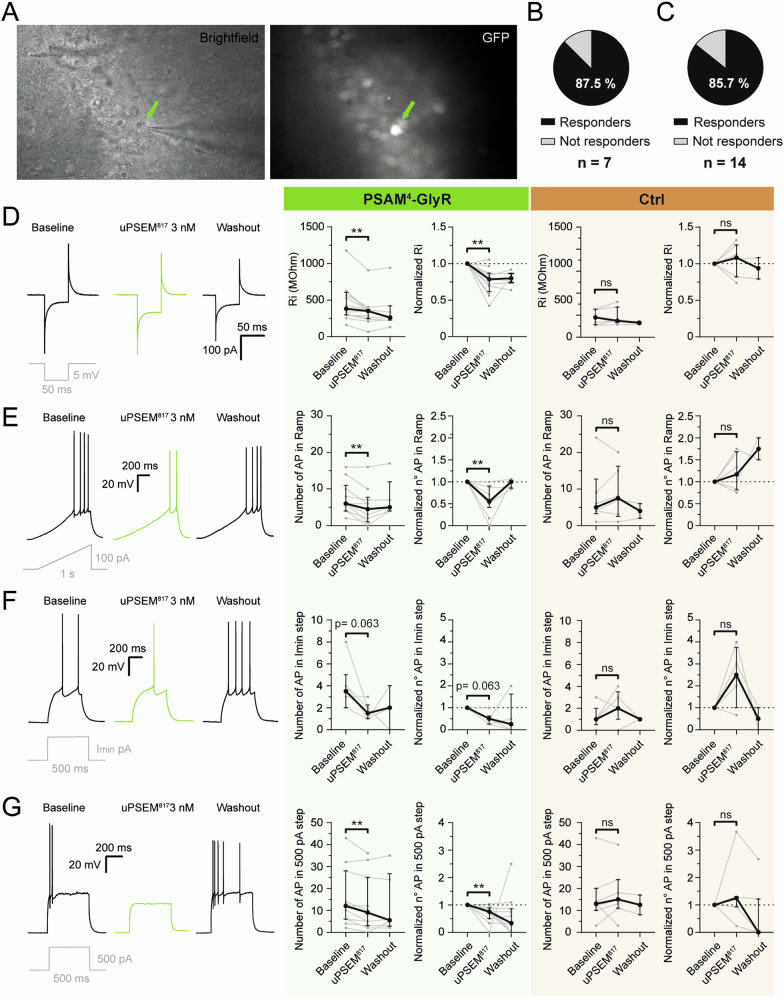
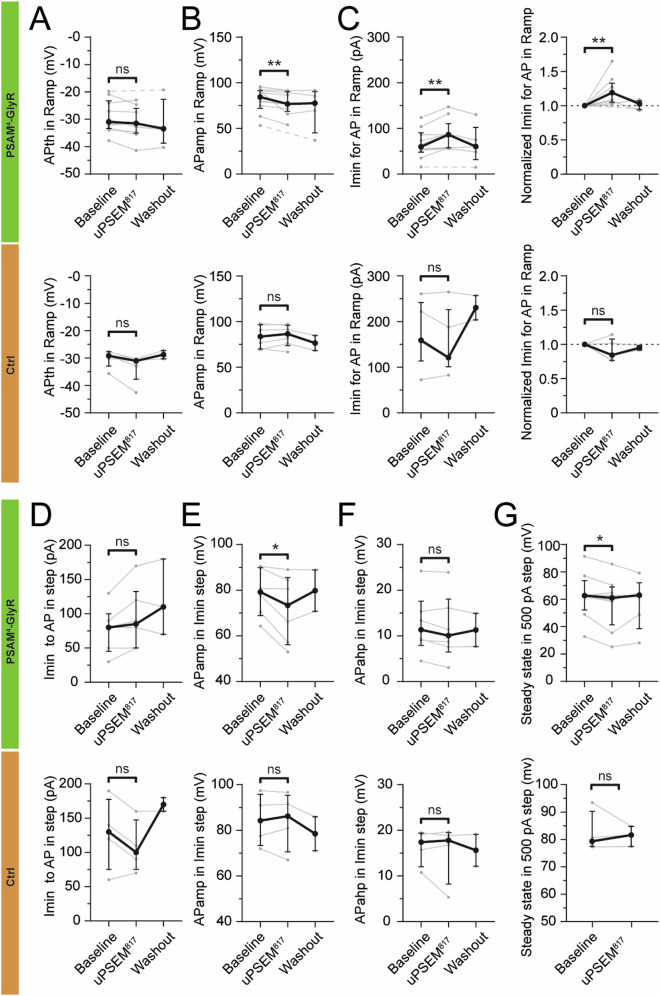
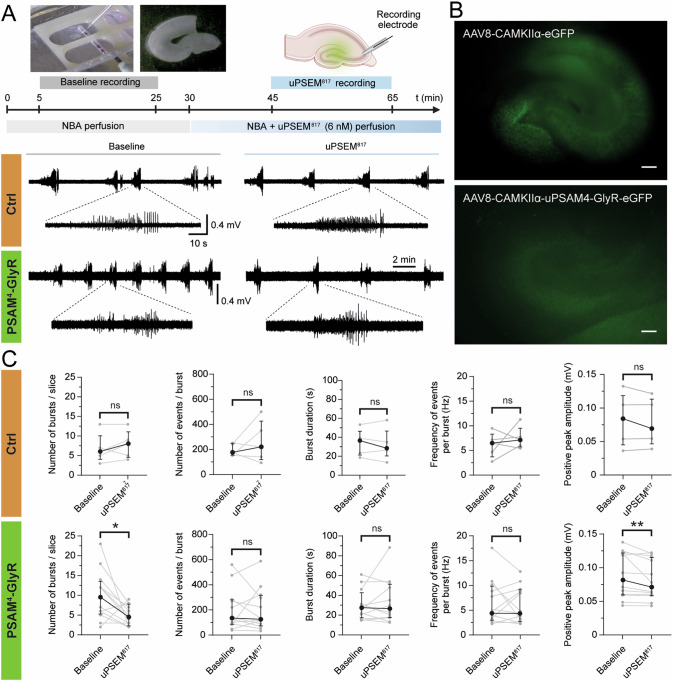
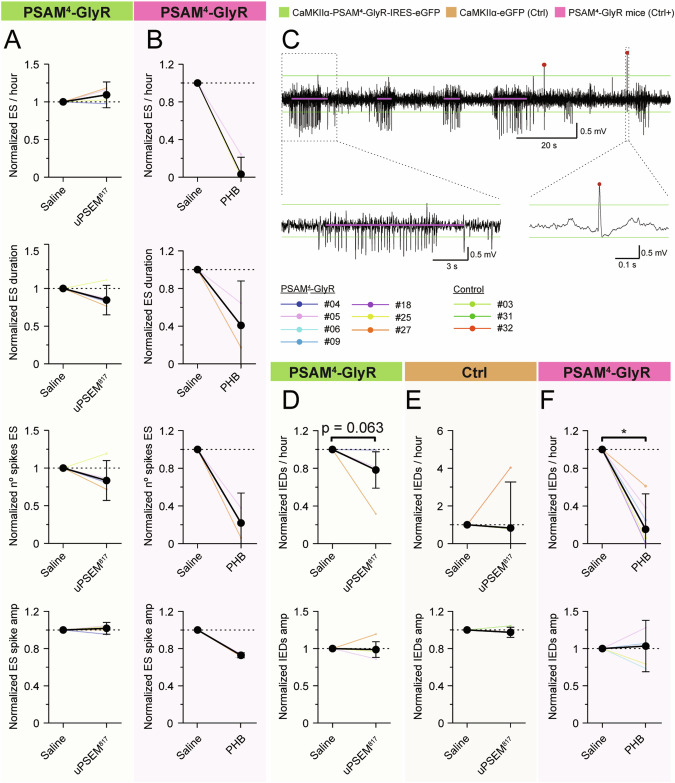
Despite the availability of new drugs on the clinics in recent years, drug-resistant epilepsy remains an unresolved challenge for healthcare, and one-third of epilepsy patients remain refractory to anti-seizure medications. Gene therapy in experimental models has emerged as effective treatment targeting specific neuronal populations in the epileptogenic focus. When combined with an external chemical activator using chemogenetics, it also becomes an "on-demand" treatment. Here, we evaluate a targeted and specific chemogenetic therapy, the PSAM/PSEM system, which holds promise as a potential candidate for clinical application in treating drug-resistant epilepsy. We show that the inert ligand uPSEM817, which selectively activates the chloride-permeable channel PSAM4-GlyR, effectively reduces the number of depolarization-induced action potentials in vitro. This effect is likely due to the shunting of depolarizing currents, as evidenced by decreased membrane resistance in these cells. In organotypic slices, uPSEM817 decreased the number of bursts and peak amplitude of events of spontaneous epileptiform activity. Although administration of uPSEM817 in vivo did not significantly alter electrographic seizures in a male mouse model of temporal lobe epilepsy, it did demonstrate a strong trend toward reducing the frequency of interictal epileptiform discharges. These findings indicate that PSAM4-GlyR-based chemogenetics holds potential as an anti-seizure strategy, although further refinement is necessary to enhance its efficacy.


Conflict of interest statement

Competing interests: The authors declare no competing interests. Ethical approval: As described in the material and methods section, the experimental procedures performed were approved by the Malmö/Lund Animal Research Ethics Board, ethical permit number 2998/2020-m, and conducted in agreement with the Swedish Animal Welfare Agency regulations and the EU Directive 2010/63/EU for animal experiments. Organotypic slices experiments were conducted according to European Union Guidelines (2012/707/EU) and to the Portuguese legislative action (DL 113/2013) for the protection of animals used for scientific purposes. The methods described were approved by “iMM’s Institutional Animal Welfare Body (ORBEA-iMM, Lisboa, Portugal) and authorized by the Portuguese authority for Animal Welfare (Direção Geral de Alimentação e Veterinária - DGAV).

Figures

Fig. 1
Fig. 1. Experimental design, PSAM4-GlyR expression, and histopathology after the IHKA injection.
A Schematics of the study timeline. IHKA intrahippocampal kainic acid; SE status epilepticus; Ephys electrophysiology; IF immunofluorescence; EEG electroencephalogram. B Maximum intensity projection of immunofluorescence showing PSAM4-GlyR-IRES-eGFP expression across the hippocampus in a horizontal section. b Magnification of the dentate gyrus on a z-stack plane. On the right, quantification of median and maximum GFP+ fluorescence intensity of the DG area in the different PSAM4-GlyR animals used in the analysis. C Immunofluorescence for mossy fiber sprouting, using antibodies against ZnT3, and merged with the nuclear staining DAPI in naïve (bottom) and IHKA (top) mice (indicated in yellow). D Immunofluorescence for neuronal nuclei, NeuN, in naïve (bottom) and IHKA (top) mice. Images correspond to the surrounding area of the IHKA depot and electrode location in the right dorsal hippocampus, sagittal sections. Tissue was collected following the completion of in vivo recordings, using a vibratome to prepare slices for acute electrophysiology experiments. The dashed yellow line in (C, D) represents the cell body layers highlighting the anatomical structure of the hippocampus. Scale bar: 500 µm (BD) and 100 µm (b).
Fig. 2
Fig. 2. Effect of uPSEM817 on intrinsic electrophysiological properties of the cells expressing PSAM4-GlyR.
A Whole-cell patch-clamp recording of a GFP+ cell (green arrow). The Infrared differential interference contrast (IR-DIC) image on the left and fluorescent 470 nm light visualization on the right. Pie chart illustration of the percentage of PSAM4-GlyR treated animals ((B), n = 7), and all measured CaMKIIα-PSAM4-GlyR-GFP+ cells from those animals ((C), n = 14), undergoing changes in intrinsic properties when uPSEM817 was washed in. D Test pulse response in the different treatments, green indicating uPSEM817 application in PSAM4-GlyR-GFP+ cells. From left to right, Ri measurement and normalized values in CaMKIIα-PSAM4-GlyR-eGFP+ cells (green) and CaMKIIα-eGFP+ cells (Ctrl, orange) before, during, and after uPSEM817 application. E Differential cell response to 0–100 pA ramps of depolarizing current in different treatments, green indicating uPSEM817 application in PSAM4-GlyR-GFP+ cells. From left to right, number of APs in response to ramps of depolarizing current and normalized values in CaMKIIα-PSAM4-GlyR-eGFP+ cells (green) and CaMKIIα-eGFP+ cells (Ctrl, orange) before, during, and after uPSEM817 application. F Differential cell response to the lowest depolarizing current pulses for AP induction abbreviated as Imin (in this case 80 pA) in the different treatments, green indicating uPSEM817 application in PSAM4-GlyR-GFP+ cells. From left to right, number of APs in response to Imin current pulses and normalized values in CaMKIIα-PSAM4-GlyR-eGFP+ cells (green) and CaMKIIα-eGFP+ cells (Ctrl, orange) before, during, and after uPSEM817 application. G Differential cell response to 500 pA depolarizing current pulses in the different treatments, green indicating uPSEM817 application in PSAM4-GlyR-GFP+ cells. From left to right, number of APs in response to 500 pA pulses and normalized values in CaMKIIα-PSAM4-GlyR-eGFP+ cells (green) and CaMKIIα-eGFP+ cells (Ctrl, orange) before, during, and after uPSEM817 application. Ri, input resistance; Imin, minimum current pulse step to trigger an AP. Animals injected with AAV8-CaMKIIα-PSAM4-GlyR-IRES-eGFP, n = 7 (total cells n = 14); control/GFP-only animals injected with AAV8- CaMKIIα-eGFP, n = 3 (total cells n = 7). Cells used in the analysis as responders n = 12. Median ± interquartile range. Wilcoxon paired test for comparison of the PSEM effect to the Baseline. **, p < 0.01.
Fig. 3
Fig. 3. The effect of uPSEM817 on PSAM4-GlyR causes alterations in some evoked action potential properties.
Whole-cell patch-clamp recording of CaMKIIα-PSAM4-GlyR-eGFP+ cells (green) and control GFP-only cells (Ctrl, orange). Measurements in depolarizing ramp currents of the APth (A), APamp (B), and Imin for the first AP ((C), left). Normalized values for Imin for the first AP ((C), right). The minimum current needed to trigger APs in depolarizing step currents (D). Measurements in Imin depolarizing step for APamp (E) and APahp (F). Steady-state current amplitude in 500 pA step (G). AP, action potential; Imin, minimum current to trigger an AP in step currents; APth AP threshold; APamp AP amplitude; APahp AP afterhyperpolarization amplitude. The dashed line indicates that the cell did not generate an AP during the uPSEM817 effect, thereby there is no value in the analysis for that cell and the line connects the value from the baseline directly to the wash-out. CaMKIIα-PSAM4-GlyR-eGFP+ cells: n = 12, CaMKIIα-eGFP+ cells: n = 7. Median ± interquartile range. Wilcoxon paired test for comparison of the PSEM effect to the Baseline. *, p < 0.05; **, p < 0.01.
Fig. 4
Fig. 4. Effect of uPSEM817 on epileptic-like activity of entorhinal cortex-hippocampus organotypic slices.
A Experimental schematic of the timeline to record the epileptiform activity of rhinal cortex-hippocampus organotypic slices at 14 days in vitro (DIV) at baseline condition (grey) and under the effect of 6 nM uPSEM817 (blue). Above, example images of the recording set-up, organotypic slices, and the electrode positioning for spontaneous field recordings on CA3. Below, representative traces of epileptic-like activity from slices transduced with AAV8-CaMKIIα-eGFP (orange) and AAV8-CaMKIIα-PSAM4-GlyR-IRES-eGFP (green), during baseline (left, grey) and uPSEM817 application (right, blue). Burst details are shown in magnified traces. B Representative fluorescence images showing GFP expression on the organotypic slices. C Characterization of epileptiform-like activity and evaluation of the uPSEM817 application effect. From left to right, analysis of the number of bursts per slice, number of events per burst, burst duration, frequency of events per burst, and average positive peak amplitude within each burst. Individual values represent the mean per slice, including n = 5 slices transfected with AAV8-CaMKIIα-eGFP (orange) and n = 12 slices with AAV8-CaMKIIα-PSAM4-GlyR-IRES-eGFP (green). NBA, Neurobasal A medium. Scale bar: 200 µm. Median ± interquartile range. Wilcoxon paired test for comparison of the uPSEM817 effect to the baseline. *, p < 0.05; **, p < 0.01.
Fig. 5
Fig. 5. Effect of uPSEM817 on ES and IEDs in a chronic model of TLE in mice expressing PSAM4-GlyR.
A Normalized effect of uPSEM817 i.p. administration to saline i.p. injection in PSAM4-GlyR animals on ES rate, mean ES duration, number of spikes in the ES, and ES spike amplitude (green, n = 4). Note that none of the GFP-only vector-treated animals developed spontaneous ES. B Normalized effect of PHB in PSAM4-GlyR animals on ES rate, mean ES duration, number of spikes in the ES, and ES spike amplitude (magenta, n = 3). C Example of raw signal with ES detections (magenta line) and IED detections (dark red points). Green lines mark the thresholds for spike detection. Magnification of an ES on the left and of an IED on the right. D Normalized effect of uPSEM817 i.p. administration in PSAM4-GlyR animals on IEDs rate, and amplitude (green, n = 5). E Normalized effect of uPSEM817 i.p. administration on GFP-only vector-treated animals on IEDs rate, and amplitude (orange, n = 3). F Normalized effect of PHB i.p. administration in both PSAM4-GlyR animals on IEDs rate, and amplitude (magenta, n = 6). i.p intraperitoneal; PHB phenobarbital; amp amplitude. Median ± interquartile range. Wilcoxon paired test for comparison of the PSEM effect to the saline, and PHB compared to saline.

Similar articles

References

    1. Collaborators GE. Global, regional, and national burden of epilepsy, 1990–2016: a systematic analysis for the Global Burden of Disease Study 2016. Lancet Neurol. 2019;18:357. - PMC - PubMed
    1. Toda Y, Kobayashi K, Hayashi Y, Inoue T, Oka M, Ohtsukaet Y. Effects of intravenous diazepam on high-frequency oscillations in EEGs with CSWS. Brain Dev. 2013;35:540–7. - PubMed
    1. Peng B-W, Justice JA, Zhang K, Li J-X, He X-H, Sanchez RM. Gabapentin promotes inhibition by enhancing hyperpolarization-activated cation currents and spontaneous firing in hippocampal CA1 interneurons. Neurosci Lett. 2011;494:19–23. - PubMed
    1. Braga MF, Aroniadou-Anderjaska V, Li H, Rogawski MA. Topiramate reduces excitability in the basolateral amygdala by selectively inhibiting GluK1 (GluR5) kainate receptors on interneurons and positively modulating GABAA receptors on principal neurons. J Pharmacol Exp Ther. 2009;330:558–66. - PubMed
    1. Ylinen A, Valjakka A, Lahtinen H, Miettinen R, Freund TF, Riekkinen P. Vigabatrin pre-treatment prevents hilar somatostatin cell loss and the development of interictal spiking activity following sustained simulation of the perforant path. Neuropeptides. 1991;19:205–11. - PubMed